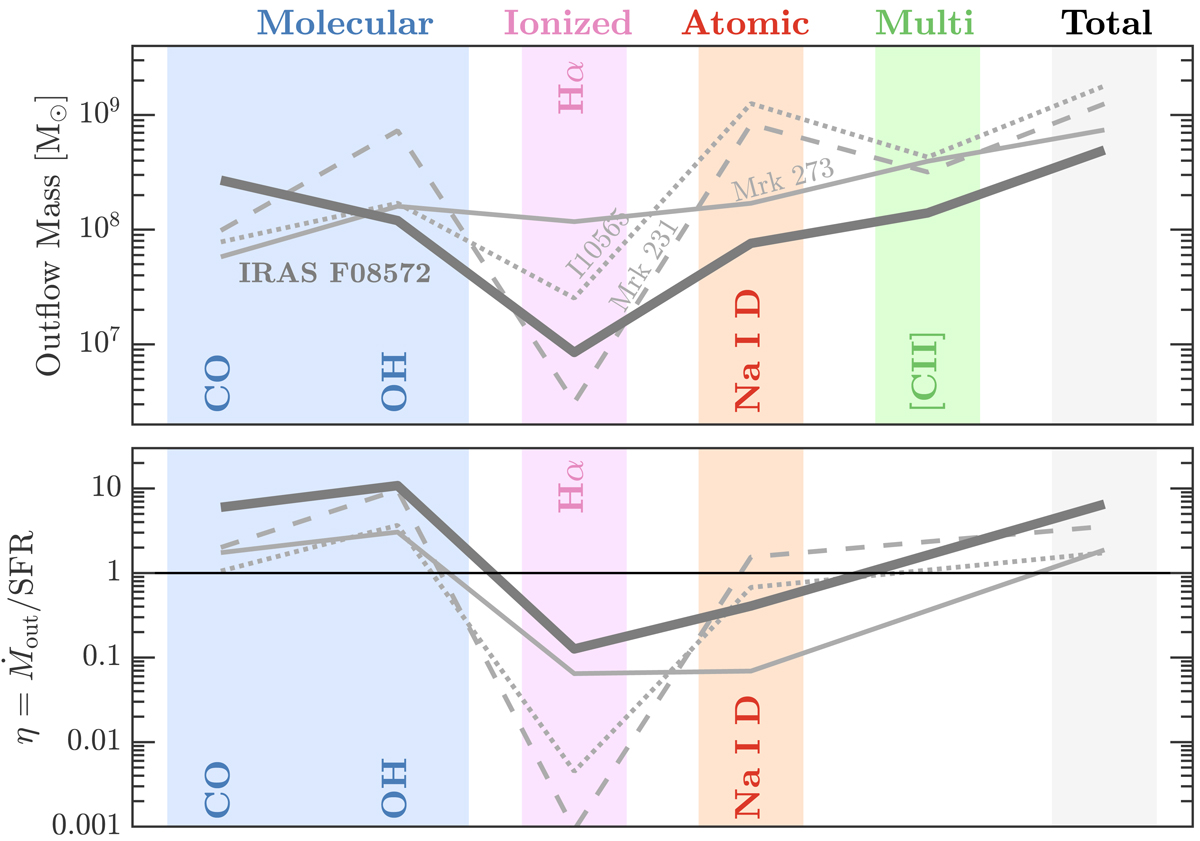
Fig. 7.

Outflow mass (top) and mass loading factor η (bottom) for different gas phases of the outflow, including molecular (as traced by CO and OH), ionized (Hα) and atomic phases (Na I D), and most likely a combination of the three as traced by [C II]. For the sum of the phases (last column) we consider the molecular phase as traced by the CO line emission. We caution the reader that these measurements are affected by a series of assumptions on the physical conditions of the gas and geometry that can have a significant impact on the final value. The results for IRAS F08572+3915 are shown with a thick gray line. For comparison, outflow properties of other major merger, infrared luminous systems such as Mrk 231 (dashed line), Mrk 273 (solid line), and IRAS F10565+2448 are also shown (Rupke & Veilleux 2013a; Veilleux et al. 2013; Cicone et al. 2014; Janssen et al. 2016; González-Alfonso et al. 2017).
Current usage metrics show cumulative count of Article Views (full-text article views including HTML views, PDF and ePub downloads, according to the available data) and Abstracts Views on Vision4Press platform.
Data correspond to usage on the plateform after 2015. The current usage metrics is available 48-96 hours after online publication and is updated daily on week days.
Initial download of the metrics may take a while.


