Fig. 5.
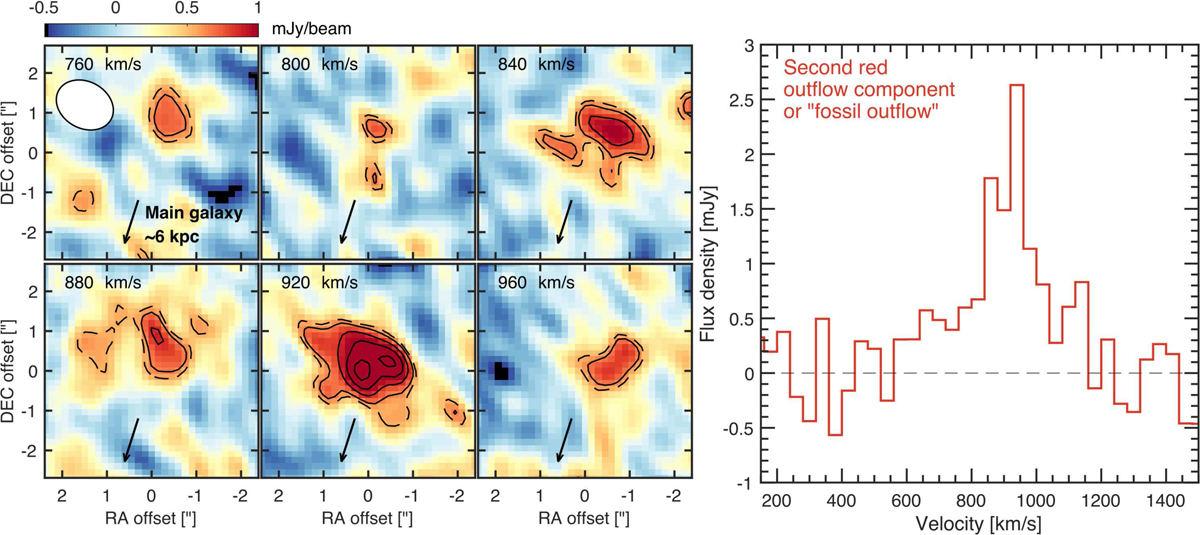
Left: channel maps showing the CO(1-0) line emission of the “gas blob” (RA 9:00:25.26, Dec +39:03:58.9) located ∼6 kpc north of the main galaxy. The NOEMA beam is shown in the top-left corner of the first panel. The contours show the 2.5σ (dashed line) and 3, 4, 5 and 6σ (solid lines) levels of emission. Right: CO(1-0) spectrum extracted from a circular region with a radius of 1.5″ centered around the “gas blob.”
Current usage metrics show cumulative count of Article Views (full-text article views including HTML views, PDF and ePub downloads, according to the available data) and Abstracts Views on Vision4Press platform.
Data correspond to usage on the plateform after 2015. The current usage metrics is available 48-96 hours after online publication and is updated daily on week days.
Initial download of the metrics may take a while.