Fig. B.2.
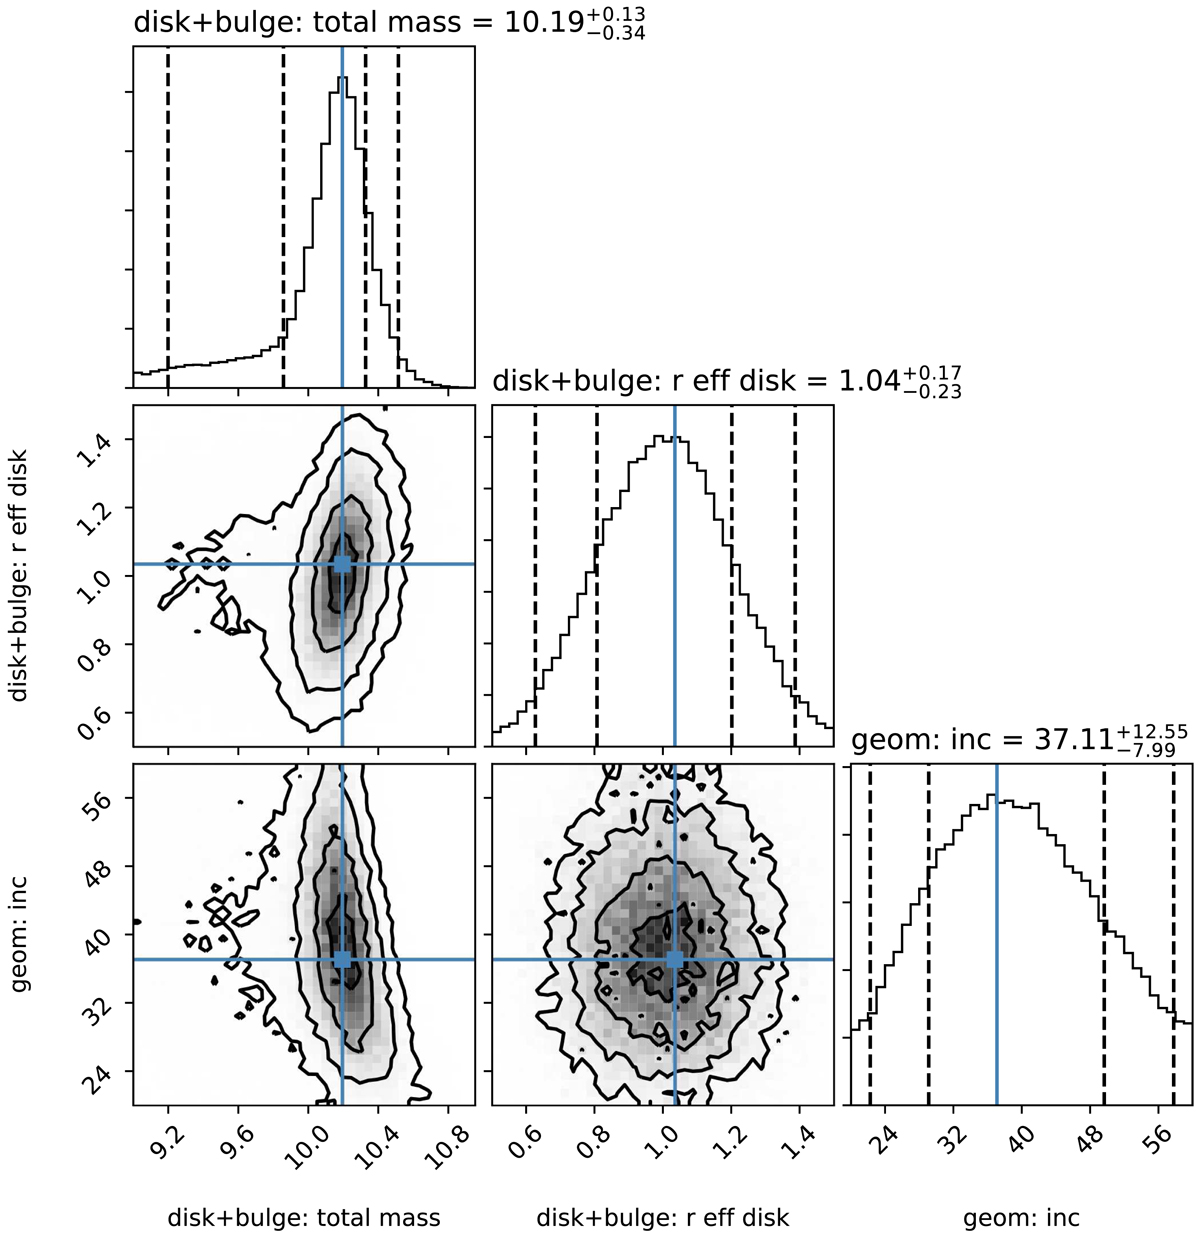
MCMC “corner plot” of our best-fit parametric model (see Fig. B.1). Figure shows the one- and two-dimensional projections of the posterior probability distributions of the three free parameters: the dynamical mass (Mdyn), the effective radius (Reff), and the inclination (i). The median values and 1σ confidence ranges of the marginalized distributions are indicated by the dashed lines in the 1D histograms. The median values are also shown as blue squares on top of the 2D histograms. The contours show the 1, 2, and 3σ confidence levels of the 2D distributions.
Current usage metrics show cumulative count of Article Views (full-text article views including HTML views, PDF and ePub downloads, according to the available data) and Abstracts Views on Vision4Press platform.
Data correspond to usage on the plateform after 2015. The current usage metrics is available 48-96 hours after online publication and is updated daily on week days.
Initial download of the metrics may take a while.