Free Access
Fig. A.1.
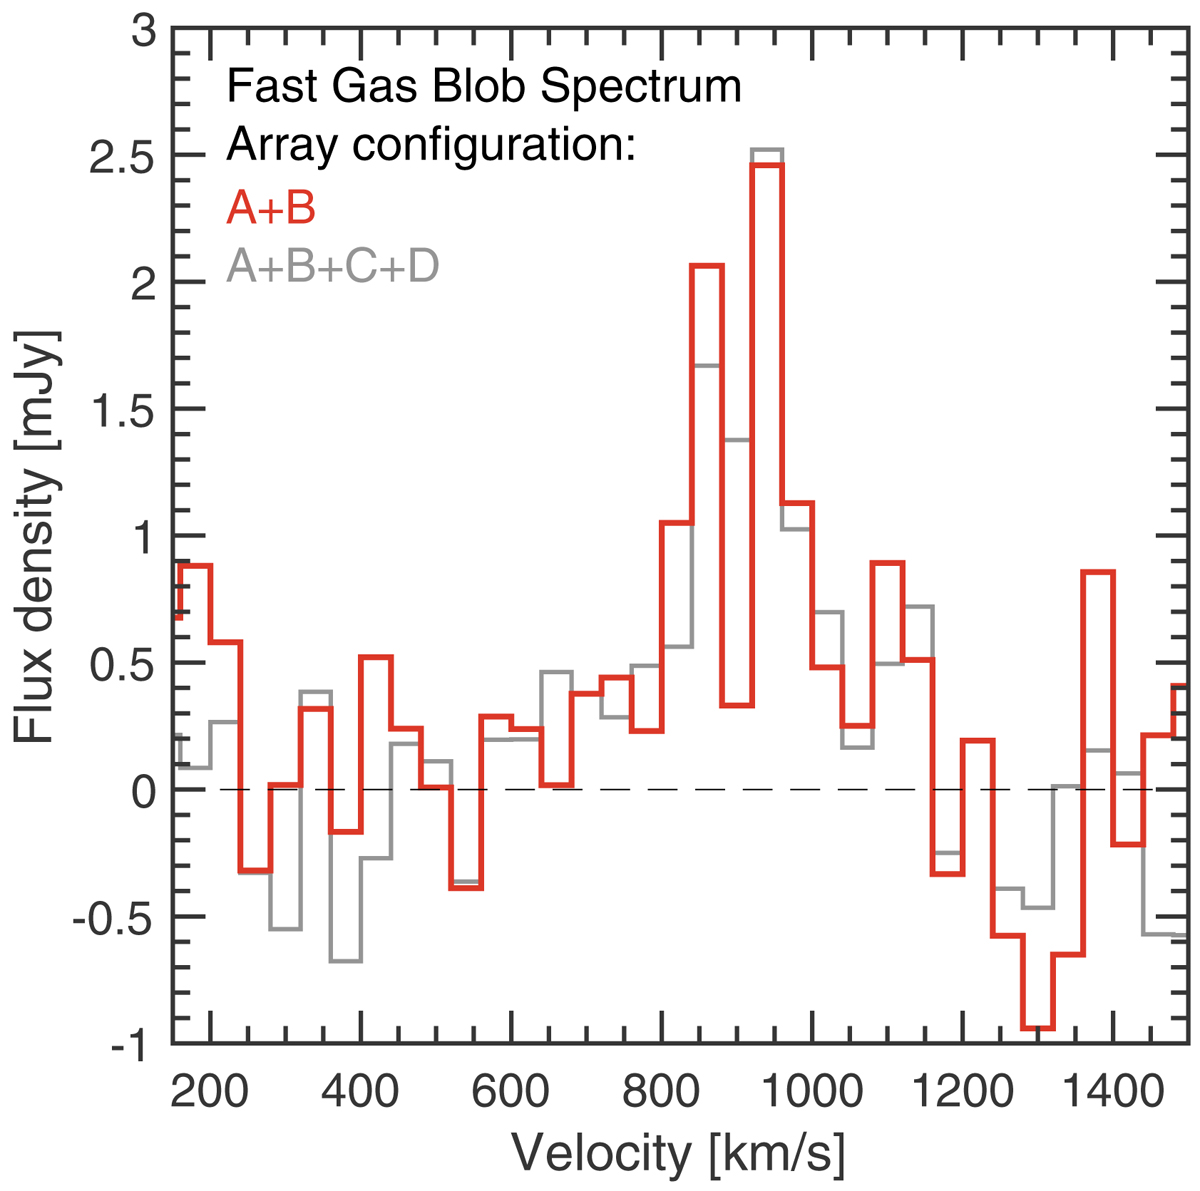
CO(1-0) spectrum of the outflowing gas blob located ∼6 kpc north of the NW galaxy and that is independent of the main outflow structure. In red we show the spectrum extracted from the A+B only data, while in grey we show the spectrum from the combined A+B+C+D data (which is identical to the one shown in Fig. 5).
Current usage metrics show cumulative count of Article Views (full-text article views including HTML views, PDF and ePub downloads, according to the available data) and Abstracts Views on Vision4Press platform.
Data correspond to usage on the plateform after 2015. The current usage metrics is available 48-96 hours after online publication and is updated daily on week days.
Initial download of the metrics may take a while.