Fig. 2.
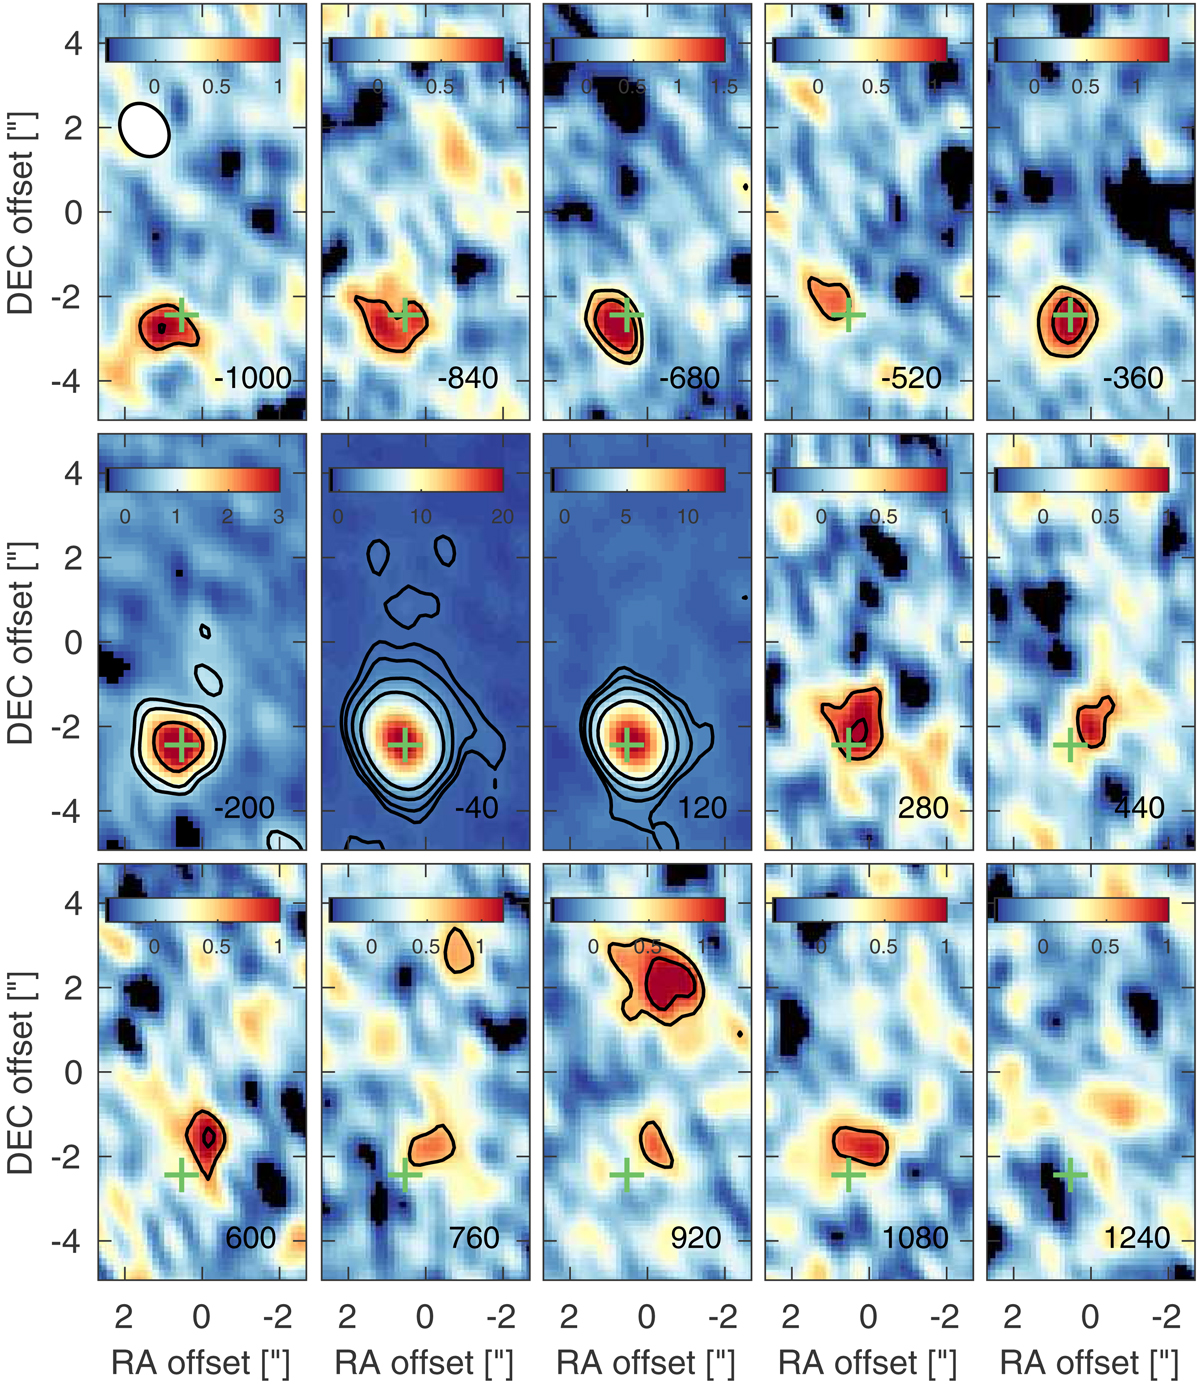
Channel maps (40 km s−1 bins) showing the CO(1-0) line emission in IRAS F08572+3915 in velocity steps of 160 km s−1. The velocity of each map is printed in the lower-right corner and the NOEMA beam is shown in the top-left corner of the first panel. The green cross marks the position of the CO(1-0) peak in the NW galaxy, and the contours are placed at the 3, 5, 10 and 20σ level. Each map has its own color scale to make both bright and faint features visible, so we include the corresponding colorbar in the top of each panel in units of mJy beam−1. We observe that the outflow is aligned with the kinematic major axis of the disk (roughly going from the southeast to the northwest), and that the second redshifted outflow component is brightest around 900 km s−1.
Current usage metrics show cumulative count of Article Views (full-text article views including HTML views, PDF and ePub downloads, according to the available data) and Abstracts Views on Vision4Press platform.
Data correspond to usage on the plateform after 2015. The current usage metrics is available 48-96 hours after online publication and is updated daily on week days.
Initial download of the metrics may take a while.