Fig. 4.
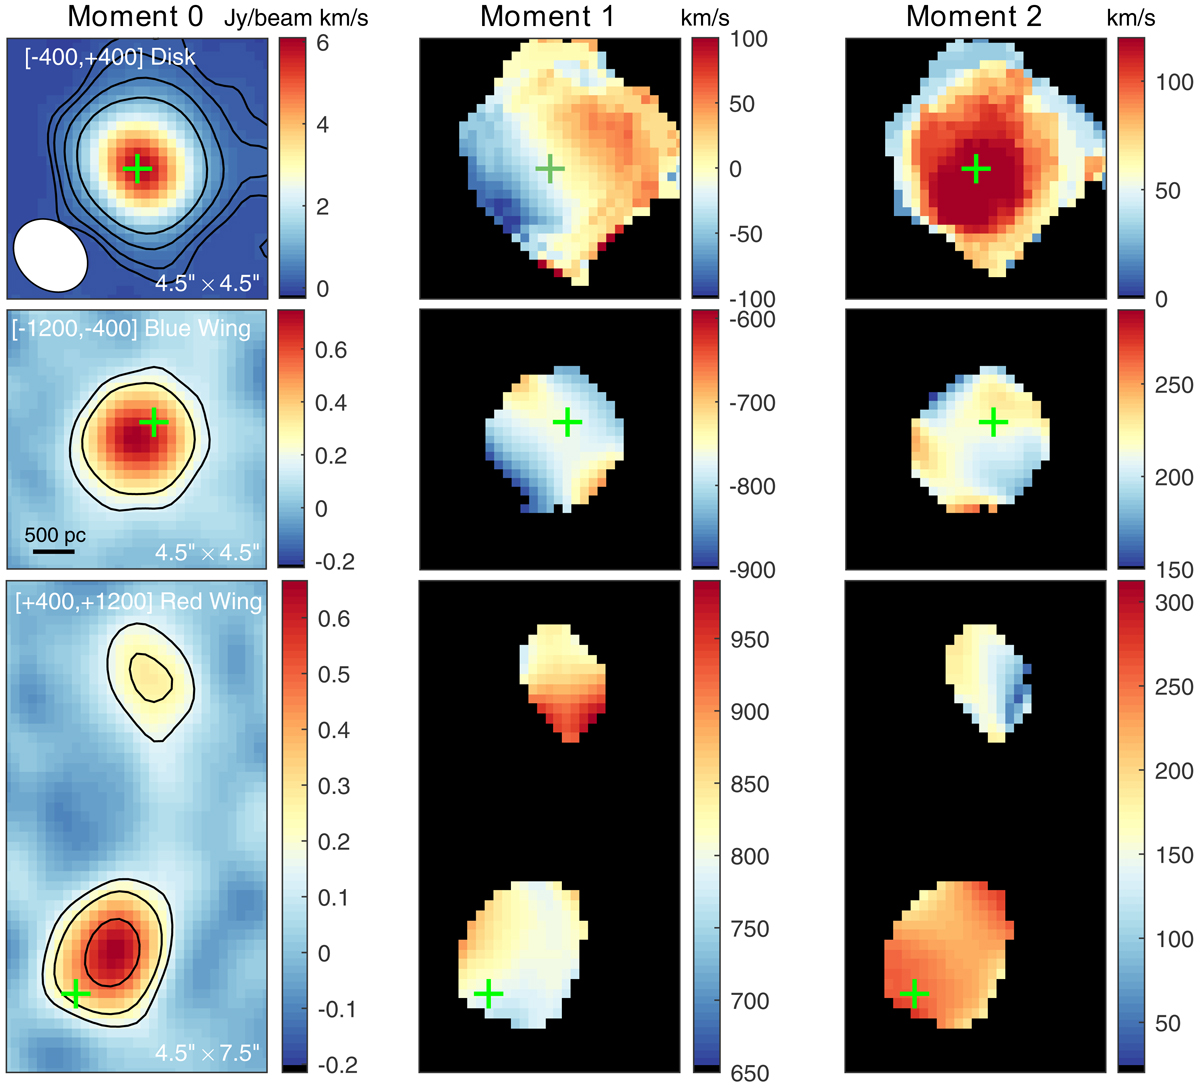
Integrated intensity (left column), velocity (center column), and dispersion (right column) maps for the NW galaxy (top row), the blue wing (center row), and the two red wing components (bottom row). Only regions with > 3σ detections are shown. The green cross marks the position of the CO(1-0) peak in the NW galaxy. Contours correspond to 3, 5, 10 and 20σ, where σ for each map is listed in Table 2. The NOEMA beam is shown in the bottom-left corner of the first panel.
Current usage metrics show cumulative count of Article Views (full-text article views including HTML views, PDF and ePub downloads, according to the available data) and Abstracts Views on Vision4Press platform.
Data correspond to usage on the plateform after 2015. The current usage metrics is available 48-96 hours after online publication and is updated daily on week days.
Initial download of the metrics may take a while.