Fig. 8.
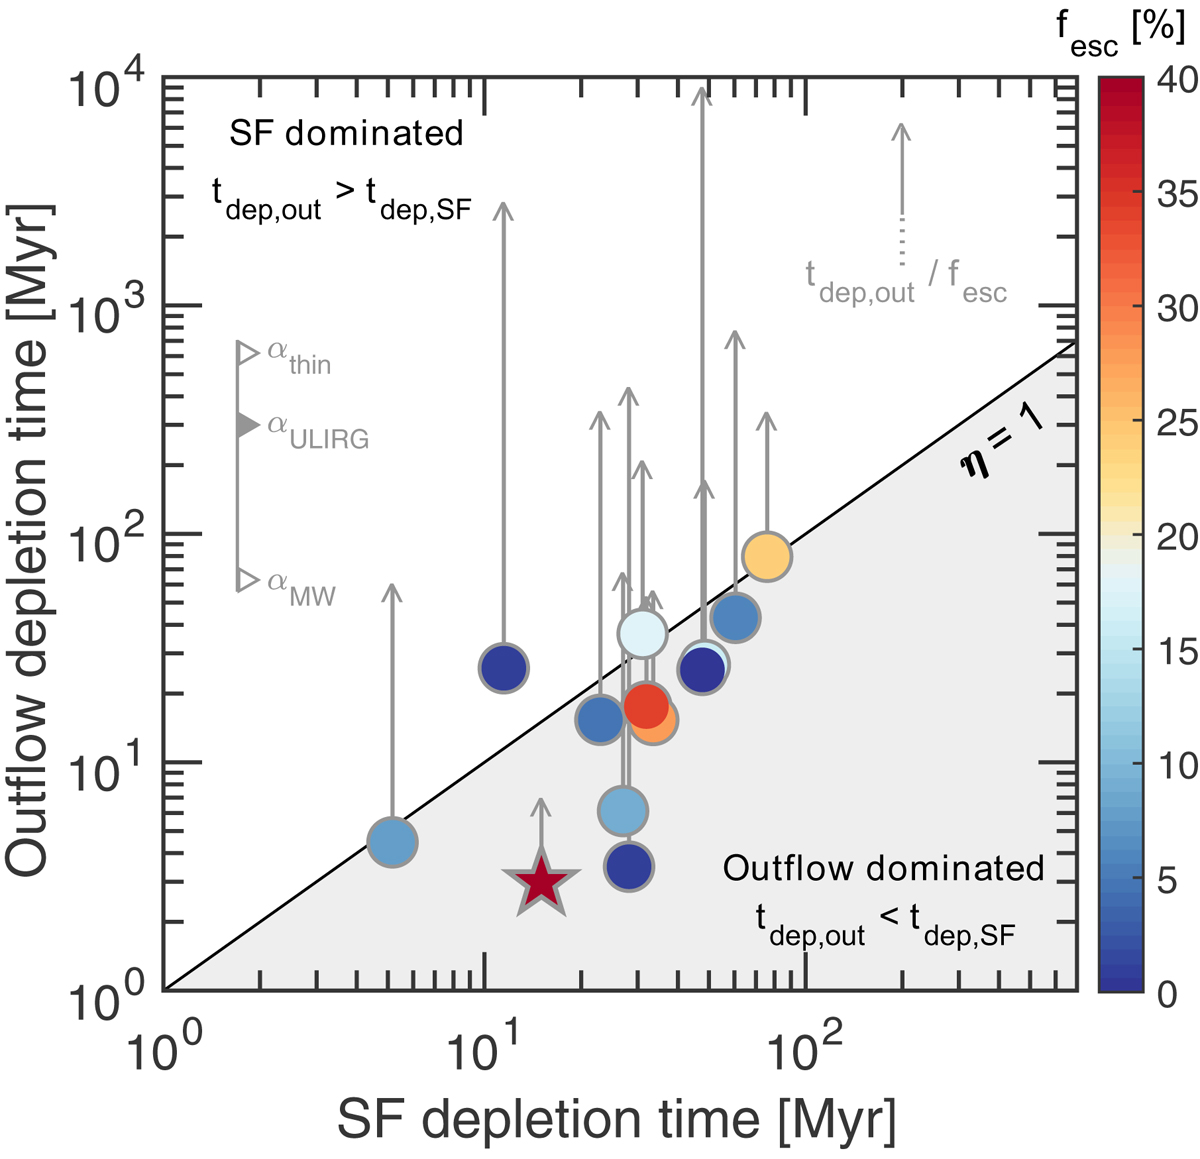
Molecular gas depletion timescale (in Myr) due to gas consumption by star formation activity (tdep, SF = Mmol/SFR; abscissa) and gas removal by the outflow (tdep,out = Mmol/Ṁout,mol; ordinate). IRAS F08572+3915 is shown as a star, and other (U)LIRGs taken from the literature are shown as circles (Pereira-Santaella et al. 2018; Fluetsch et al. 2019). The points are color-coded according to the escape fraction fesc, defined as the mass fraction of the molecular gas in the outflow that can escape the gravitational potential of its host. Diagonal line represents tdep, SF = tdep, out or, equivalently, a mass loading factor of η = 1. Vertical lines show where the data points would move if we calculate the depletion time based on the rate of molecular gas ejected by the outflow that can escape the gravitational potential of its host (i.e., Ṁesc,mol = fesc × Ṁout,mol).
Current usage metrics show cumulative count of Article Views (full-text article views including HTML views, PDF and ePub downloads, according to the available data) and Abstracts Views on Vision4Press platform.
Data correspond to usage on the plateform after 2015. The current usage metrics is available 48-96 hours after online publication and is updated daily on week days.
Initial download of the metrics may take a while.