| Issue |
A&A
Volume 634, February 2020
|
|
|---|---|---|
| Article Number | A49 | |
| Number of page(s) | 38 | |
| Section | Stellar atmospheres | |
| DOI | https://doi.org/10.1051/0004-6361/201935498 | |
| Published online | 06 February 2020 | |
The stellar and wind parameters of six prototypical HMXBs and their evolutionary status★
1
Institut für Physik und Astronomie, Universität Potsdam,
Karl-Liebknecht-Str. 24/25,
14476
Potsdam,
Germany
e-mail: This email address is being protected from spambots. You need JavaScript enabled to view it.
2
Instituto Universitario de Física Aplicada a las Ciencias y las Tecnologías, Universidad de Alicante,
03690
Alicante,
Spain
3
European Space Astronomy Centre (ESA/ESAC), Science Operations Department,
Villanueva de la Cañada, Madrid,
Spain
4
Georgia College and State University, Department of Chemistry, Physics and Astronomy,
221 N. Wilkinson St.,
Milledgeville,
GA
31061,
USA
5
Institute of astrophysics, KU Leuven,
Celestijnlaan 200D,
3001
Leuven,
Belgium
6
Armagh Observatory and Planetarium,
College Hill,
Armagh,
BT61 9DG,
UK
Received:
19
March
2019
Accepted:
19
December
2019
Abstract
Context. High-mass X-ray binaries (HMXBs) are exceptional astrophysical laboratories that offer a rare glimpse into the physical processes that govern accretion on compact objects, massive-star winds, and stellar evolution. In a subset of the HMXBs, the compact objects accrete matter solely from winds of massive donor stars. These so-called wind-fed HMXBs are divided in persistent (classical) HMXBs and supergiant fast X-ray transients (SFXTs) according to their X-ray properties. While it has been suggested that this dichotomy depends on the characteristics of stellar winds, they have been poorly studied.
Aims. With this investigation, we aim to remedy this situation by systematically analyzing donor stars of wind-fed HMXBs that are observable in the UV, concentrating on those with neutron star (NS) companions.
Methods. We obtained Swift X-ray data, HST UV spectra, and additional optical spectra for all our targets. The spectral analysis of our program stars was carried out with the Potsdam Wolf–Rayet model atmosphere code.
Results. Our multi-wavelength approach allows us to provide stellar and wind parameters for six donor stars (four wind-fed systems and two OBe X-ray binaries). The wind properties are in line with the predictions of the line-driven wind theory. Based on the abundances, three of the donor stars are in an advanced evolutionary stage, while for some of the stars, the abundance pattern indicates that processed material might have been accreted. When passing by the NS in its tight orbit, the donor star wind has not yet reached its terminal velocity but it is still significantly slower; its speed is comparable with the orbital velocity of the NS companion. There are no systematic differences between the two types of wind-fed HMXBs (persistent versus transients) with respect to the donor stars. For the SFXTs in our sample, the orbital eccentricity is decisive for their transient X-ray nature. The dichotomy of wind-fed HMXBs studied in this work is primarily a result of the orbital configuration, while in general it is likely that it reflects a complex interplay between the donor-star parameters, the orbital configuration, and the NS properties. Based on the orbital parameters and the further evolution of the donor stars, the investigated HMXBs will presumably form Thorne–Żytkow objects in the future.
Key words: X-rays: binaries / binaries: close / stars: early-type / stars: atmospheres / stars: winds, outflows / stars: mass-loss
Based on observations made with the NASA/ESA Hubble Space Telescope (HST), obtained from the data archive at the Space Telescope Science Institute. STScI is operated by the Association of Universities for Research in Astronomy, Inc. under NASA contract NAS 5-26555.
© ESO 2020
1 Introduction
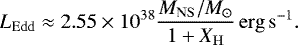
High-mass X-ray binaries (HMXBs) are binary systems consisting of a massive star, also denoted as the donor star, and a compact object, which is either a neutron star (NS) or a black hole (BH). These systems are characterized by high X-ray luminosities (LX ≈ 1036 erg s−1) emitted by stellar material accreted onto the compact object. Multi-wavelength studies of HMXBs offer the opportunity to contribute to a variety of physical and astrophysical research areas, including but not limited to accretion physics, stellar evolution, and the precursors of gravitational wave events.
The HMXB population encompasses different types of binary systems. Depending on the orbital configuration, the evolution state of the donor star, and how the matter is channeled to the compact object, one can distinguish between different types: in Roche–lobe overflow (RLOF) systems, the compact object directly accretes matter via the inner Lagrangian point (L1). In wind-fed HMXBs, the compact object accretes from the wind of the donor star. In OBe X-ray binary systems, the donor stars are usually OB-type dwarfs with a decretion disk. The compact object in these kind of systems either accretes matter from these disks or from the donor-star winds.
The wind-fed HMXBs are of particular interest (for recent reviews see Martínez-Núñez et al. 2017 and Sander 2019). Here the compact object is situated in and accretes solely from the wind of the massive star, usually a supergiant. Therefore, these objects are also denoted as SgXBs. Ostriker & Davidson (1973) realized that accretion from a stellar wind onto a compact object is sufficient to power the high X-ray luminosities observed for these objects. Depending on their X-ray properties, wind-fed HMXBs are distinguished into classical (or persistent) HMXBs and the so-called Supergiant Fast X-ray Transients (SFXTs). While the former always exhibit an X-ray luminosity on the order of LX ≈ 1036 erg s−1, the latter are characterized by quiescent X-ray phases with LX ≈ 1032 − 1034 erg s−1, which are interrupted by sporadic X-ray flares (LX ≥ 1036 erg s−1). Although the origin of this dichotomy is hitherto not understood, it is assumed that the donor stars play an important role in this picture (e.g., in’t Zand et al. 2007; Oskinova et al. 2012; Krtička et al. 2015; Giménez-García et al. 2016; Sidoli & Paizis 2018).
The Bondi–Hoyle–Lyttleton accretion mechanism (Hoyle & Lyttleton 1939; Bondi & Hoyle 1944) predicts that the X-ray luminosity (LX) of a wind-fed HMXB is very sensitive to the mass-loss rate (Ṁ) and the wind velocity (vwind) of the donorstar,
 (1)
(1)
where vrel = | vwind + vorb | is the relative velocity of the wind matter captured by the compact object. The orbital velocity (vorb) is often neglected while evaluating Eq. (1), since stellar winds of OB-type stars have high terminal velocities, sometimes in excess of 2000 km s−1. However, most HMXBs are compact systems with orbital periods of a few days (Walter et al. 2015). This implies that the distance between the compact objects and the donor stars are relatively small, which means that donor star winds will not have reached their terminal velocities at the position of the compact objects. On the other hand, the vorb can be quite high, especially during periastron in eccentric systems. Therefore, it is of high importance to reliably quantify the role of vwind and vorb in these kind of systems, especially because of the strong dependence of LX on vrel.
The X-rays emitted by the compact object can, in turn, have a significant impact on the donor star’s atmosphere and wind. These X-rays strongly ionize a certain part of the donor star wind, which can lead to significant changes in the observed spectra of these sources. This is demonstrated by van Loon et al. (2001) for important UV wind-lines using phase resolved spectroscopy of several donor stars. The underlying mechanism is first discussed by Hatchett & McCray (1977), which is, therefore, also denoted as the Hatchett–McCray effect. Depending on the wind density, the orbital configuration, and the amount of X-rays emitted by the compact object, its influence on the donor wind can be quite diverse (e.g., Blondin et al. 1990; Blondin 1994).
For high X-ray luminosities, Krtička et al. (2015) and Sander et al. (2018) show that the donor wind velocity field in the direction of the compact object can be significantly altered. This is because the radiation of the compact object changes the ionization balance in the donor star wind, leading to a modification of the radiative acceleration of the wind matter. In extreme cases the donor star winds can be virtually stopped or even disrupted.
In this work, we concentrate on wind-fed HMXBs with NS companions and moderate X-ray luminosities, where the Hatchett–McCray effect is of modest importance and the winds are not significantly disturbed. However, even for those systems, the X-rays need to be accounted for during the spectral analysis, since they might have a noticeable effect on the ionization balance in the donor star wind and consequently on the spectra.
Despite the strong connection between the X-ray properties of wind-fed HMXBs and the properties of the donor stars, only a few of these stars have been studied so far. One reason for this deficiency is that most of the wind-fed HMXBs are highly obscured. Therefore, the most important wavelength range for the analysis of OB-star winds, the UV that provides essential wind diagnostics, is often not accessible. In this work, we analyze four wind-fed HMXBs and two OBe X-ray binaries that are observable in the UV.
The paper is organized as follows: in Sect. 2, we introduce our sample, while the data used in this work are described in Sect. 3. The atmosphere models and the fitting process are outlined in Sect. 4. Our results are presented in Sect. 5, and discussed in Sects. 6 and 7. The summary and conclusions can be found in Sect. 9. Additional tables, comments on the individual objects, and the complete spectral fits are presented in Appendices A–C, respectively.
2 The sample
While about 30 wind-fed HMXBs are known in our Galaxy (see Martínez-Núñez et al. 2017 for a recent compilation), most of these objects are located in the Galactic plane (Chaty 2008). Therefore, they are often highly obscured and are not observable in the UV. However, ultraviolet resonance lines allow to characterize even the relatively weak winds of B-type stars (e.g., Prinja 1989; Oskinova et al. 2011). Since the determination of wind parameters is the main objective of this study, we restrict our sample to those wind-fed HMXBs that are observable in the UV.
In addition to Vela X-1, which has been analyzed previously by Giménez-García et al. (2016), only four more wind-fed HMXBs meet the above condition, namely HD 153919 (4U 1700-37), BD+60 73 (IGR J00370+6122), LM Vel (IGR J08408-4503), and HD 306414 (IGR J11215-5952). The latter two systems are SFXTs, while the first one is a persistent HMXB, and BD+60 73 (IGR J00370+6122) exhibits properties of both types. Our sample also includes the Be X-ray binary HD 100199 (IGR J11305-6256) and BD+53 2790 (4U 2206+54), which is classified as an Oe X-ray binary or as a persistent wind-fed binary with a non evolved donor. The latter classification is based on its X-ray properties, while the former is a result of the prominent hydrogen emission lines that are visible in optical spectra of this object. These lines are most likely formed in a decretion disk of the donor star. Thus, this systems might actually be intermediate between the classical wind-fed HMXB and the OBe X-ray binaries. The HMXB type, the spectral classification of the donor, and common alias names of the investigated systems are given in Table 1.
The orbital parameters of the investigated systems and the spin period of the neutron stars are compiled from the literature and listed in Table 2. The only exception is HD 100199 because neither the orbit nor the properties of its NS are known.
3 The data
3.1 Spectroscopy
For our UV survey of wind-fed HMXBs, we made use of the Space Telescope Imaging Spectrograph (STIS, Woodgate et al. 1998; Kimble et al. 1998) aboard the HST. These high resolution, high S/N spectra (Proposal ID: 13703, PI: L. M. Oskinova) cover important wind diagnostics in the range 1150–1700 Å. In this paper, we use the automatically reduced data that are provided by the HST archive. For three of our program stars, far UV data obtained with the Far Ultraviolet Spectroscopic Explorer (FUSE, Moos et al. 2000) were retrieved from the MAST archive.
These data are complemented by optical spectroscopy from different sources. For HD 100199, HD 306414, LM Vel, and HD 153919, we use data taken with the Fiber-fed Extended Range Optical Spectrograph (FEROS, Kaufer et al. 1999) mounted at the 2.2 m telescope operated at the European Southern Observatory (ESO) in La Silla. These data sets were downloaded from the ESO archive. From the same repository, we also retrieved FOcal Reducer and low dispersion Spectrograph (FORS, Appenzeller et al. 1998) spectra for HD 153919. Optical spectra for BD+60 73 were kindly provided by A. González-Galán. These spectra were taken with the high-resolution FIbre-fed Echelle Spectrograph (FIES, Telting et al. 2014)mounted on the Nordic Optical Telescope (NOT) and published in González-Galán et al. (2014). For BD+53 2790, we downloaded a low resolution spectrum from the VizieR archive that was taken by Munari & Zwitter (2002) with a Boller & Chivens Spectrograph of the Asiago observatory. In addition, we obtained an optical spectrum of BD+53 2790with a DADOS spectrograph in combination with two different SBIG cameras (SFT8300M & ST-8XME) mounted to the Overwhelmingly Small Telescope (OST) of the student observatory at the University of Potsdam. Default data reduction steps were performed for this data set using calibration data (dome flats, dark frames, HgAr-lamp spectrum) taken immediately after the science exposures. Finally Near-IR spectroscopy was obtained during the night of 2014 September 1, using the Near Infrared Camera and Spectrograph (NICS) mounted at the 3.5-m Telescopio Nazionale Galileo (TNG) telescope (La Palma island). Medium-resolution spectra (3.5 Å pixel−1) were taken with the H and Kb grisms under good seeing conditions. Details on the reduction process can be seen in Rodes-Roca et al. (2018). The individual spectral exposures used in this work are listed in Table A.1. In this table, we also give the phase at which the observations were taken for those systems where ephemerides are available (see Table 2 and references therein).
Spectral classifications, distances, and common aliases.
Orbital parameters and the spin period of the neutron star.
3.2 Photometry
We compiled UBV RI photometry from various sources (Anderson & Francis 2012; Mermilliod 2006; Zacharias et al. 2004; Reig & Fabregat 2015; DENIS Consortium 2005) for all our program stars. G-band photometry was retrieved from the Gaia DR1 release (Gaia Collaboration 2016). Near-infrared photometry (J, H, KS) was obtained from Cutri et al. (2003), while WISE photometry is available from Cutri et al. (2012) for all our targets. Moreover, we made use of MSX infrared photometry (Egan et al. 2003) for HD 153919. The complete list of photometric measurements used for the individual objects is compiled in Table A.2.
3.3 X-ray data
For all our HST observations, we obtained quasi-simultaneous X-ray data with the Neil Gehrels Swift Observatory (Swift, Gehrels et al. 2004). In addition, strictly simultaneous Chandra X-ray and HST UV observations were performed for HD 153919 (Chandra ObsID. 17630, exposure time 14.6 ks).
The data obtained with the X-ray telescope (XRT, Burrows et al. 2005) aboard Swift are reduced using the standard XRT pipeline as part of HEASOFT v6.23. To extract the source spectra from data gathered while the XRT was in the photon counting (PC) mode, we used a circular region centered at its J2000 coordinates with a 25′′ radius or 80′′ radius depending on the source characteristics. Background counts were extracted from an annulus encompassing the source extraction region. When XRT was in the window timing mode (WT), the source extraction region consisted of a square with a width of 40 pixels while background counts were extracted from a similar-sized region situated away from the source.
The observed spectra were fitted using a suit of various X-ray spectral fitting software packages. For all objects, the photoionization cross-sections from Verner et al. (1996) and abundances from Wilms et al. (2000) were employed. The goal of X-ray spectral fitting was to provide the parameters describing the X-ray radiation field in the format required for the stellar atmosphere modeling (see Sect. 4.1). X-ray spectra of HMXBs are typically well represented by power law spectral models, which are not yet implemented in our stellar atmosphere model. Therefore, we decided to fit the observed spectra using a fiducial black body spectral model. The fitting returns a “temperature” parameter TX, which is not-physical but is employed to describe the spectral hardness and X-ray photon flux.
The Swift XRT observation of HD 153919 was taken in the WT mode. We extracted 43 640 net source counts during 5270 s of exposure time. After rebinning the spectral data to contain a minimum of 20 net counts per bin, we fit an absorbed ( cm−2) blackbody (kBT = 2.1 ± 0.1 keV) plus a power-law component (Γ = 4 ± 1). The observed X-ray flux is
  erg cm−2 s−1. Chandra observations of HD 153919 are presented by Martinez-Chicharro et al. (2018). Towards the end of the observation which lasted about4 h, the source experienced a flare with X-ray flux increasing by a factor of three. Our HST observations were partially obtained during the end of this flare.
Nineteen source (+background) counts were gathered during the XRT observation of BD+60 73 taken on the same day as the HST observation (ObsID 00032620025). Without rebinning the data, and assuming C-statistics (Cash 1979), we fit an absorbed blackbody model and obtained spectral parameters that were poorly constrained ( cm−2 and kBT ~ 1 keV) with an observed flux of 6.2 ×10⁻¹⁴ erg cm−2 s−1.
HD 306414 was not detected in any of the contemporaneous Swift observations, and therefore we could not measure its X-ray flux. HD 100199 was marginally detected with 12 ± 4 photons in an observation one day before the HST observation (ObsID 00035224007). We estimate a flux of 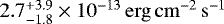 from these data.
LM Vel was also very X-ray faint during the HST observation (ObsID 00037881107). We therefore use Swift data taken a few days earlier (ObsID 00037881103) to measure the spectral shape. We find that a thermal blackbody model describes the data well, and use this model to fit the simultaneous data. There we find a flux of 5.8 × 10⁻¹³ erg cm−2 s−1 between 3–10 keV.
For BD+53 2790 (4U 2206+543), we extracted 2511 net source counts during an 1106 s XRT observation in WT mode. The spectral data were arranged in order to contain at least 20 counts per bin, and were then fit with an absorbed blackbody model (NH ≤ 8 × 1021 cm−2 and kBT = 1.3 ± 0.1 keV). The model derived flux is 1.3 ± 0.1 × 10⁻¹¹ erg cm−2 s−1.
A compilation of the X-ray data used in this work can be found in Table A.3, while the derived X-ray luminosities are listed in Table 3.
X-ray luminosities measured at times close to the HST observations (see text for details).
4 Spectral modeling
4.1 Stellar atmosphere models
The spectral analyses presented in this paper were carried out with the Potsdam Wolf–Rayet (PoWR) models. PoWR is a state-of-the-art code for expanding stellar atmospheres. The main assumption of this code is a spherically symmetric outflow. The code accounts for deviation from the local dynamical equilibrium (non-LTE), iron line blanketing, wind inhomogeneities, a consistent stratification in the quasi hydrostatic part, and optionally also for irradiation by X-rays. The rate equations for the statistical equilibrium are solved simultaneously with the radiative transfer in the comoving frame, while energy conservation is ensured. Details on the code can be found in Gräfener et al. (2002), Hamann & Gräfener (2003), Todt et al. (2015), and Sander et al. (2015).
The inner boundary of the models is set to a Rosseland continuum optical depth τross of 20, defining the stellar radius R*. The stellar temperature T* is the effective temperature that corresponds to R* via the Stefan–Boltzmann law,
 (2)
(2)
with L being the luminosity. The outer boundary is set to Rmax = 100 R*, which proved to be sufficient for our program stars.
In the subsonic part of the stellar atmosphere, the velocity field v(r) is calculated consistently such that the quasi-hydrostatic density stratification is fulfilled. In the wind, corresponding to the supersonic part of the atmosphere, a β-law (Castor & Lamers 1979; Pauldrach et al. 1986) is assumed. A double-β law (Hillier & Miller 1999; Gräfener & Hamann 2005) in the form described by Todt et al. (2015) is used for those objects where β values larger than unity are required to achieve detailed fits. For the first exponent we always assume 0.8, while the second exponent is adjusted during the spectral fitting procedure. The gradient of such a double-β law is steeper at the bottom of the wind than for a single β-law with a large exponent.
In the main iteration, line broadening due to natural broadening, thermal broadening, pressure broadening, neglected multiplet splitting, and turbulence is approximately accounted for by assuming Gaussian line profiles with a Doppler width of 30 km s−1. The turbulent pressure is accounted for in the quasi hydrostatic equation (see Sander et al. 2015 for details). In the formal integral, line broadening is treated in all detail. For the microturbulence we set ξ = 10 km s−1 in the photosphere, growing proportional with the wind velocity up to a value of ξ(Rmax) = 0.1 v∞. The only exceptions are the supergiants HD 306414 and BD+60 73 where higher ξ values are necessary to reproduce the observation (see Appendix B for details). The atmospheric structures (e.g., the density and the velocity stratification) of the final models for the donor stars are listed in Tables A.6–A.11.
Wind inhomogeneities are accounted for in the “microclumping” approach that assumes optically thin clumps (Hillier 1991; Hamann & Koesterke 1998). The density contrast between the clumps of an inhomogeneous model and a homogeneous one (with the same mass-loss rate Ṁ) is described by the clumping factor D. Since the interclump medium is assumed to be void, D is the inverse of the clump’s volume filling factor fV = D−1. According to hydrodynamical simulations (e.g., Runacres & Owocki 2002; Sundqvist et al. 2018), a radial dependency is expected for the clumping factor. Here, we use the clumping prescription suggested by Martins et al. (2009). The clumping onset (parameterized by vcl), where the clumping becomes significant, is set to 10 km s−1, since this results in the best fits for all objects where this property could be constrained. The clumping factor is adjusted for each individual object.
The PoWR code accounts for ionization due to X-rays. The X-ray emission is modeled as described by Baum et al. (1992), assuming that the only contribution to the X-ray flux is coming from free–free transitions. Since the current generation of PoWR models is limited to spherical symmetry, the X-rays are assumed to arise from an optically-thin spherical shell around the star. The X-ray emission is specified by three free parameters, which are the fiducial temperature of the X-ray emitting plasma TX, the onset radius of the X-ray emission R0 (R0 > R*), and a filling factor Xfill, describing the ratio of shocked to non-shocked plasma. For our HMXBs, the onset radius is set to the orbital distance between the donor star and the NS companion. The temperature of the X-ray emitting plasma are obtained from fits of the observed X-ray spectra (see Sect. 3.3). The X-ray filling factor is adjusted such that the wavelength integrated X-ray flux from the observationsis reproduced by the model.
The effects of the X-ray field on the emergent spectra are illustrated in Fig. 1. While the photospheric absorption lines are not affected at all, certain wind lines change significantly. Whether the lines become stronger or weaker depends on the individual combination of the wind density at the position of the NS, the ionization balance in the wind, and the hardness and intensity of the X-rays injected. There is some parameter degeneracy as, for some models, nearly identical line profiles are obtained when reducing Ṁ and instead increasing the X-ray filling factor. Fortunately, this ambiguity can be avoided in the analysis of most of our targets because the X-ray field is constrained from observations (see Sect. 3.3). The injected X-ray radiation is often needed to reproduce the wind lines in the UV and, hence, to measure the terminal wind velocity and mass-loss rate.
Complex model atoms of H, He, C, N, O, Mg, Si, P, and S (see Table A.4 for details) are considered in the non-LTE calculations. The multitude of levels and line transitions inherent to the iron group elements (Sc, Ti, V, Cr, Mn, Fe, Co, and Ni) are treated in a superlevel approach (see Gräfener et al. 2002).
4.2 Applicability of the models
One of the main assumption of the PoWR models as well as all other stellar atmosphere codes, with the exception of the PHOENIX/3D code (Hauschildt & Baron 2014), is spherical symmetry. In HMXBs, however, the spherical symmetry isbroken by the presence of the compact object. On the other hand, the X-ray luminosities are often quite modest in HMXBs with NS companions. This is also the case for the systems studied in this work, as illustrated by the values given in Table 3. For all but one sources, the X-ray luminosities are below log LX = 35 [erg s−1].
For those X-ray luminosities, we expect that the disruptive effect of the X-rays emitted by the NS on the donor star wind is relatively limited. The only exception might be HD 153919 (4U 1700-37) that exhibited an X-ray luminosity of log LX = 36.03 [erg s−1] during our HST observation. The HST spectrum of this source was taken during the end of an X-ray outburst described in Martinez-Chicharro et al. (2018). However, only minor variations are present in the HST spectrum compared to earlier observations with the IUE satellite. This is illustrated in Fig. 2, where we compare our HST spectrum with an averaged IUE spectrum constructed from observations in the high resolution mode that were taken between 1978 and 1989 with the large aperture. We used all available data sets with the exception of one exposure (Data ID: SWP36947) that exhibits a significantly lower flux compared to all other observations. The wind of HD 153919 does not show any sign of inhibition, suggesting that the volume significantly affected by the X-ray emission of the NS is rather small. This is consistent with the findings by van Loon et al. (2001).
This gives us confidence that the winds of the donor stars in the studied systems are not disrupted by the X-ray emission of the NSs andthat the applied models are valid within their limitations. However, for the individual objects, observational time series are necessary to confirm this.
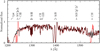 |
Fig. 1 Comparison between two model spectra calculated for BD+60 73 to illustrate the effect of the X-rays (red: with X-rays, black: without X-rays). |
4.3 Spectral analysis
An in-depthspectral analysis of a massive star with non-LTE model spectra is an iterative process. Our goal is to achieve a overall best model fit to the observed data, while weighting the diagnostics according to their sensibility to the stellar parameters as describedbelow. Starting from an estimate of the stellar parameters based on the spectral type of the target, a first stellar atmosphere model is calculated and its emergent spectrum is compared to the observations. This and the subsequent comparisons are performed “by eye” without any automatic minimization procedures. Based on the outcome of the initial comparison, the model parameters are adjusted, and a new atmosphere model is calculated. This procedure is repeated until satisfactory fits of the observations with the normalized line spectrum and the spectral energy distribution (SED) is achieved. As an example, the final fit of the normalized line spectrum of HD 306414 is presented in Fig. 3.
For those objects in our sample with T* > 30 kK, the stellar temperature is primarily derived from the equivalent-width ratio between He I and He II lines, such as He I λλ 4026, 4144, 4388, 4713, 4922, 5015, 6678 and He IIλλ 4200, 4542, 5412, 6683. For stars with lower stellar temperatures, we additionally used the line ratios of Si III to Si IV (Si III λλ 4553, 4568, 4575, 5740 and Si IV λλ 4089, 4116) and N II to N III (N II λλ 4237, 4242, 5667, 5676, 5680, 5686, and N IIIλλ 4035, 4097).
The surface gravity log ggrav is derived from the pressure broadened wings of the Balmer lines, focusing on the Hγ and Hδ line, since Hβ and Hα are often affected by emission lines from the stellar wind.
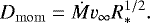
The luminosities of all our targets together with the color excess EB−V and the extinction-law parameter RV for the individual lines of sight are obtained from a fit of the corresponding model SED to photometry and flux calibrated spectra. For this purpose, different reddening laws are applied to the synthetic SEDs. The finally adopted reddening prescriptions are given in Table 4. Moreover, the model flux is scaled to the distance of the corresponding star, using the values compiled in Table 1. For example, the SED fit of HD 306414 is shown in Fig. 4.
The projected rotational velocity and the microturbulence velocity in the photosphere are derived from the line profiles and the equivalent width of metal lines, such as Si IV λλ 4089, 4116; Si III λλ 4553, 4568, 4575; Mg II 4481 λ; and C IV λλ 5801, 5812. Macroturbulence is not considered in this approach, and thus the v sin i values reported in Table 4 must be considered as upper limits. With the iacob-broad tool (Simón-Díaz & Herrero 2014), which separately determines a possible macroturbulent contribution to the line broadening, we obtained similar v sin i values within their error margins. The terminal wind velocity and the radial dependence of the microturbulence velocity are simultaneously estimated from the extend and shape of the P Cygni absorption troughs of the UV resonance lines. The β parameter of the velocity law is adjusted such that the synthetic spectrum can reproduce the profiles of the UV resonance lines and the full-width at half-maximum (FWHM) of the Hα emission. For the objects presented in this work, a double-β law with a second β exponent in the range of 1.2–3.0 result in slightly better spectral fits compared to the canonical β-law with β = 0.8 for O-type stars (Kudritzki et al. 1989; Puls et al. 1996). Note that the mass-loss rate derived from a spectral fit also slightly depend on the used β value.
The mass-loss rate and the clumping parameters are derived by fitting the wind lines in the UV and the optical. The main diagnostics for determining the mass-loss rates are the UV resonance lines exhibiting P Cygni line profiles, namely, C IV λλ 1548, 1551 and Si IV λλ 1394, 1403. The clumping factor and the onset of the clumping are adjusted such that a consistent fit of unsaturated UV lines and Hα could be achieved, utilizing the different dependency of those lines on density (linearly for the resonance lines and quadratic for recombination lines, such as Hα).
The abundances of the individual elements are adjusted such that the observed strength of the spectral lines belonging to the corresponding element are reproduced best by the model.
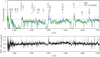 |
Fig. 2 HD 153919: comparison between our HST spectrum and an averaged IUE spectrum constructed from data taken between 1978 and 1989.Upper panel: HST spectrum (blue dotted line) and IUE spectrum (green continuous line); lower panel: difference between the HST spectrum and the averaged IUE spectrum. |
5 Stellar and wind parameters
The stellar and wind parameters of the investigated donor stars are listed in Table 4 together with the corresponding error margins. For those physical quantities that are directly obtained from the spectral fit (T*, log g, log L, v∞, β, Ṁ, EB−V, RV, v sin i, abundances), the corresponding errors are estimated by fixing all parameters but one and varying this parameter until the fit becomes significantly worse. For those quantities that follow from the fit parameters, the errors are estimated by linear error propagation. We do not account for uncertainties in the orbital parameters, since they are often not known. Moreover, the quoted errors do not account for systematic uncertainties, e.g., because of the simplifying assumptions of the models such as spherical symmetry.
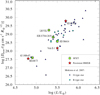 |
Fig. 3 Normalized line spectrum of HD 306414. The upper panel depicts a part of the UV spectrum, while the lower panel showsa section of the optical spectrum. The observation is shown in blue. The best fitting synthetic spectrum is overplotted by a dashed red line. |
5.1 Comparison with single OB-type stars
The winds of massive stars are characterized by a number of quantities, such as Ṁ, v∞, or D. Since only a low number of donor-star winds have been analyzed by means of sophisticated atmosphere models, it is statistically unfavorable to pursue comparisons for individual wind parameters. Therefore, we use the so-called modified wind momentum Dmom to evaluate thewinds of the donor stars. The modified wind momentum is defined as
 (3)
(3)
In Fig. 5, we plot Dmom over the luminosity. A tight linear relation between the luminosity and the modified wind momentum is predicted by the line-driven wind theory (Kudritzki et al. 1995, 1999; Puls et al. 1996). This so-called wind-momentum luminosity relation (WLR) is observationally confirmed for a variety of massive stars (e.g., Kudritzki et al. 1999; Kudritzki 2002; Massey et al. 2005; Mokiem et al. 2007). Exceptions are certain categories of objects such as the so-called weak-wind stars (Bouret et al. 2003; Martins et al. 2005; Marcolino et al. 2009; Shenar et al. 2017), where most of the wind mass-loss might be hidden from spectral analyses based on optical and UV data (see e.g., Oskinova et al. 2011; Huenemoerder et al. 2012). In addition to the stars analyzed in this work, we also plot in Fig. 5 the results obtained by Giménez-García et al. (2016) and Martínez-Núñez et al. (2015) for the donor stars in one SFXT (IGR J17544-2619) and two persistent HMXBs (Vela X-1 and U9 1909+07) as well as the values compiled by Mokiem et al. (2007) for Galactic O and B-type stars.
The donor stars in the investigated HMXBs fall in the same parameter regime as observed for other Galactic OB-type stars. Moreover, Fig. 5 shows that these donors also follow the same WLRs as other massive stars in the Galaxy, indicating that the fundamental wind properties of the donor stars in wind-fed HMXBs are well within the range of what is expected and observed for these kind of massive stars.
5.2 Wind parameters of SFXTs versus those of HMXBs
A comparison between the wind parameters of the donor stars in SFXTs with those in persistent HMXBs reveals that there is no general distinction (see Table 4). For example, HD 153919 and LM Vel both have winds with a high terminal velocity of 1900 km s−1, but the former is a persistent HMXB, while the latter is a SFXT. Moreover, we find SFXTs with quite different wind properties: while LM Vel exhibits a fast stellar wind and a relatively high mass-loss rate, HD 306414 has a significantly slower wind (v∞= 800 km s−1) and a low mass-loss rate. In fact, the parameters of HD 306414 are quite similar to those of Vela X-1 (Giménez-García et al. 2016), while Vela X-1 is a persistent source in contrast to HD 306414.
The wind properties are important for characterizing the donor stars. However, the accretion onto the compact object and, consequently, the X-ray properties of a system depend on the wind conditions at the position of the compact object. Based on the orbital parameters (Table 2), we determine the wind velocity at the apastron and periastron positions of the NS (see Table 4). As described in Sect. 4.1, we assume a double-β law (with the second β exponent given in Table 4) for the wind velocity in the supersonic regime. However, the double-β law as well as the single β-law might not be a perfect representation of the wind structure in some HMXBs (Sander et al. 2018). Moreover, the wind velocity in the direction to the NS might be reduced because of the influence of the X-rays on the wind structure (Krtička et al. 2015; Sander et al. 2018). Thus, the real wind velocity could be slightly lower than what we constrain here. However, we do not expect that this effect is significant for the objects in our sample because of the relatively low X-ray luminosities of the NSs (see Table 3). A more detailed investigation will be presented in a forthcoming publication using hydrodynamic atmosphere models.
From Table 4, we clearly see that the velocities of the donor star winds at the position of the NSs (vwind,peri & vwind,apa) are significantly lower than the corresponding terminal wind velocities (v∞). We note that the value of the β velocity-law derived in this work defines the wind structure and as such has an influence on the wind velocity determined for the position of the NS. Low β values result in higher velocities compared to high β values. For the extreme case of HD 304614, the uncertainty from the spectral fit is ± 1 for the second exponent of the double-β law. This uncertainty results in an error of less than 5% for the wind velocity at the position of the NS during apastron, while it is about 30% during periastron. These errors are significantly smaller than the those resulting from the orbital configuration, which are the main source for the errors quoted in Table 4.
The wind velocities at the position of the NSs are modulated with the orbital configurations of the systems. An intriguing example is LM Vel: while the wind velocity at apastron is 1400 km s−1, it is as low as 30 km s−1 at periastron. In contrast, the system harboring HD 153919 (4U 1700-37), the only truly persistent source in our sample, exhibits a negligible eccentricity and, therefore, a stable wind velocity at the position of the NS. This velocity is about 20% of its terminal value, while the wind velocity at apastron in the SFXTs is > 70% of v∞. In general, it seems that in SFXTs, the velocity of the donor star winds at the periastron position of the NSs is lower than in the persistent sources. During apastron passage this situation appears to be reversed. Hence, we can conclude that the wind velocities at the position of the NS are significantly modulated by the orbital configuration in the SFXTs. This suggests that the orbits might play an important role in the dichotomy of wind-fed HMXBs as already proposed by Negueruela et al. (2006). In general, this dichotomy likely reflects a complex interplay between the donor-star parameters, the orbital configuration, and the NS properties.
Inferred stellar and wind parameters.
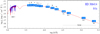 |
Fig. 4 Spectral energy distribution (SED) of HD 306414, composed of the flux calibrated HST spectrum (blue continuous line) and photometry (blue boxes, labeled with the corresponding magnitudes). The best fitting model SED is depicted by a dashedred line. The model flux is corrected for interstellar extinction and the geometric dilution according to the distance to HD 306414 (6.5 kpc). |
 |
Fig. 5 Modified wind momentum over the luminosity. The SFXTs and the persistent HMXBs are shown by green and red asterisks, respectively. In addition to the objects investigated in this work, we also show the results obtained by Martínez-Núñez et al. (2015) and Giménez-García et al. (2016). The dark blue triangles and light blue squares depict the analyses compiled by Mokiem et al. (2007) for O and B-type stars, respectively. |
5.3 Relative velocities and constraints on the formation of temporary accretion disks
Another interesting discovery is that the donor star wind velocity at periastron in all studied systems is within the uncertainties statistically indiscernible from the NSs orbital velocity. According to Wang (1981) these conditions are favorable for the formation of an accretion disk around the NS. Such a disk would act as a reservoir and might allow for X-ray outbursts peaking after periastron passage, and should also modify the X-ray light curve (see e.g., Motch et al. 1991). The formation of accretion disks regularly during periastron could potentially also influence the evolution of the spin period of the neutron star.
To check whether an accretion disk can form, we adopt the prescription from Wang (1981) in the formulation given by Waters et al. (1989). According to these studies, an accretion disk can form if
![Mathematical equation: \begin{eqnarray*}v_{\mathrm{rel}} &\leq& 304\,\eta^{1/4} \left(\frac{P_{\mathrm{orb}}}{10\,\mathrm{d}} \right)^{-1/4} \left(\frac{M_{\mathrm{NS}}}{M_{\odot}} \right)^{5/14} \left(\frac{R_{\mathrm{NS}}}{10^6\,\mathrm{cm}} \right)^{-5/28}\nonumber\\[4pt] && \times \left(\frac{B_0}{10^{12}\,\mathrm{G}} \right)^{-1/14} \left(\frac{L_{\mathrm{X}}}{10^{36}\,\mathrm{erg\,s^{-1}}} \right)^{1/28}\,\mathrm{km}\,\mathrm{s}^{-1}, \end{eqnarray*}](/articles/aa/full_html/2020/02/aa35498-19/aa35498-19-eq8.png) (4)
(4)
where Porb is the orbital period in days and η describes the efficiency of the angular momentum capture. The NS properties enter with the magnetic flux density B0, the X-ray luminosity LX, the NS mass MNS, and radius RNS.
With the help of Eq. (4), we can thus estimate whether an accretion disk around the NSs in our target systems would form. For RNS, we assume 1.1 × 106 cm based on the estimates by Özel & Freire (2016). We assume a magnetic flux density of B0 = 1012 G for all NSs in our sample. The only exception is BD+53 2790, where Torrejón et al. (2018) constrain the magnetic field of the NS to B0 > 2 × 10¹³ G. We also assume the canonical NS mass MNS = 1.4 M⊙ (Thorsett & Chakrabarty 1999). The only exception is the NS companion of HD 153919, for which Falanga et al. (2015) derive a mass of 1.96 M⊙. Moreover, we set the efficiency factor to η = 1, as expected in the presence of an accretion disk (Waters et al. 1989). Based on these assumptions, we find that no disks are predicted to form in any of our target systems. Note that Eq. (4) is strictly valid only for circular systems. Moreover, if the X-ray luminosity of the SFXTs is higher during an outburst than during our Swift observations, we might obtain a different result. However, even for LX = 1038 erg s−1 no accretion disks are predicted to form.
Recent detailed studies of wind dynamics in the vicinity of an accreting NS have been performed by El Mellah et al. (2019a). Their 3D simulations show that when orbital effects are dynamically important, the wind dramatically departs from a radial outflow in the NS vicinity and the net angular momentum of the accreted flow could be sufficient to form a persistent disk-like structure. On the other hand, the 3D hydrodynamic models by Xu & Stone (2019) show that in flows that are prone to instability, such as stellar winds, the disks are not likely to form. In support of this, observations do not indicate presence of stable accretion disks in HMXBs with NS components (e.g., Bozzo et al. 2008). Thus, the question of persistent disk formation remains open. Our spectral models, which rely on spherical symmetry, are capable of reproducing the line shapes formed in the stellar wind (e.g., lines with P Cygni profiles); this argues in the favor of the models where the wind flow is strongly bent only in a limited volume close to the NS.
We highlight that the orbital velocity cannot be neglected, since it is comparable to the wind velocity at the position of the NS. Thus, itneeds to be accounted for when estimating the mass accretion rate from the donor-star wind according to the Bondi-Hoyle-Lyttleton mechanism. Consequently, the orbital velocity is important for predicting the X-ray luminosity (see also Sects. 1 and 7).
5.4 Abundances
In Table 4, we also list the chemical abundances for our program stars. Abundances that are derived from the spectral fits are given with the estimated errors. For those elements where only insufficient diagnostics are available, the abundances are fixed to the solar values, and the corresponding entries in Table 4 are given without errors.
Two thirds of our sample (HD 153919, BD+60 73, HD 306414, and LM Vel) shows a significant depletion of hydrogen compared to the primordial abundance. For BD+53 2790 and HD 100199 no deviation from this value could be detected. Nitrogen is enriched with respectto the solar value (Asplund et al. 2009) in all investigated wind-fed HMXBs. HD 153919 and LM Vel exhibit a carbon abundance that is approximately solar, while carbon is subsolar in all other objects. The same applies to oxygen, which is depleted in all investigated objects with the exception of HD 306414 and LM Vel, which shows an oxygen abundance of about XO = XO,⊙ and 1.1 XO,⊙, respectively.
Crowther et al. (2006) determine CNO abundances for 25 Galactic OB-type supergiants. They constrain mean [N/C], [N/O], and [C/O] logarithmic number ratios (relative to solar) of +1.10, +0.79, and −0.31, respectively. Only BD+60 73 appears to be fully consistent with these results, while the other objects in our sample exhibit conspicuous abundance patterns. The [C/O] ratio of HD 153919 and LM Vel (0.31 and 0.01) is significantly higher than the average values derived by Crowther et al. (2006), while it is substantially lower for HD 306414 ([C/O] = −1.0).
In general, silicon and magnesium seems to be depleted in our program stars, with the exception of HD 306414 and BD+60 73. The former shows a supersolar silicon abundance, while the latter exhibits a slightly supersolar magnesium abundance. However, we note that the uncertainties for these abundance measurements are quite high. Hence, the results have to be interpreted with caution. In the next section, we will discuss these abundance patterns in an evolutionary context.
6 Stellar evolutionary status
The detailed investigation of HMXBs offers the possibility to constrain open questions of massive star evolution, SN kicks, and common envelope (CE) phases.
6.1 Common envelope evolution and NS natal kicks
The formation of a HMXB is a complex process. In the standard scenario, a massive binary system initiates RLOF from the primary to the secondary. This mass transfer becomes dynamically unstable, if the secondary cannot accrete all of the material. This often results in a CE phase that either leads to a merger or to the ejection of the primary’s envelope, entailing a significant shrinkage of the binary orbit (e.g., Paczyński 1967; Taam & Sandquist 2000; Taam & Ricker 2010; Ivanova et al. 2013, and references therein). In the latter case, the stripped primary will undergo a core collapse forming a compact object, which can accrete matter from the rejuvenated secondary. These systems then emerge as HMXB.
If the mass transfer is stable, or in the case of large initial orbital separations, a CE phase can be avoided. To form a HMXB, however, this evolutionary path requires fortuitous SN kicks to reduce the orbital separation to the small values observed for the majority of these systems (Walter et al. 2015).
With the exception of HD 306414, all investigated wind-fed HMXBs have tight orbits with periods of less than 16 d and semi-major axes of less than 64 R⊙. These separations are significantly smaller than the maximum extension of the NS progenitor. Therefore, each of these systems could indeed have already passed through a CE phase. Alternatively, the core collapse that leads to the formation of the NS was asymmetric and imparted a natal kick on the new-born NS. This reduced the orbital separations and hardened the system. A third possibility, in principle, is that the binary was in a close configuration from the beginning, and this has not changed because the components evolved quasi-homogeneously (e.g., Maeder 1987; Langer 1992; Heger & Langer 2000; Yoon & Langer 2005; Woosley & Heger 2006). This prevents a significant expansion of the stars, so that the system never entered a CE phase.However, there is no reason to suspect quasi homogeneous evolution (QHE) in our studied donor stars.
No significant eccentricity is expected for post CE systems, which is in strong contrast to most HMXBs in our sample. Yet, the current eccentricity of these systems might be a result of the core-collapse event, suggesting that relatively large natal kicks are associated with the formation of NSs. This appears to be consistent with the results presented by Tauris et al. (2017), who find evidence that the kicks of the first SN in binaries evolving towards double neutron stars (DNSs) are on average larger than those of the second SN. In our sample, only HD 153919 does not show any substantial eccentricity. This is either a result of tidal circularization after the first SN, which appears plausible considering the advanced evolutionary status of HD 153919, or of a CE phase, which however implies that the SN kick was negligible in this case. Although the presence of a NS in this system is strongly favored (Martinez-Chicharro et al. 2018), a BH cannot be excluded. Thus, a third possibility exists for HD 153919. Since the formation of a BH is not necessary associated with a SN and a corresponding kick, the virtual circular orbit of HD 153919 might be a result of a CE phase.
6.2 Abundance pattern
The atmospheric abundance pattern of evolved massive stars, such as OB-type supergiants, is often affected by CNO burning products. Those are mixed to the surface due to processes, such as rotational induced mixing (Heger & Langer 2000). Accordingly, it is expected that the oxygen and carbon abundance decrease in favor of the nitrogen abundance in the course of the evolution. As stated in Sect. 5, most of our program stars are not compatible with this scenario. On the one hand, HD 153919, LM Vel, HD 306414, and BD+60 73 show hydrogen depletion and nitrogen enrichment, which point to an advanced evolution state. On the other hand, HD 153919 and LM Vel haveabout solar carbon abundance, and HD 306414 has a supersolar oxygen abundance. Only for BD+60 73 the hydrogen and the CNO abundances are consistent with an advanced evolution state according to single-star evolution.
For HD 153919, Clark et al. (2002) point out that its carbon overabundance has to be a result of accretion from the NS progenitor during its Wolf-Rayet (WR) stage, more precisely during the carbon sequence WR (WC) phase. This can also serve as an explanation for the high carbon and oxygen abundances of LM Vel and HD 306414, respectively. In the latter case, the NS progenitor had to reach the oxygen rich WR (WO) phase before exploding as SN. For this scenario to work, the masses of the corresponding WC and WO stars had to be below a certain limit to form NSs at the end. Woosley (2019) estimate that most stars with final masses up to 6 M⊙, corresponding to 9 M⊙ helium core masses or 30 M⊙ on the ZAMS, will leave neutron star remnants. This constraint is compatible with a few Galactic WC stars (Sander et al. 2019). If this scenario is true, it proves that the low mass WC/WO stars indeed explode as Type Ibc SN, instead of directly collapsing to a BH.
Alternatively, the high carbon and oxygen abundances might be explained by pollution of material ejected during the SN explosion. In this case, significant enrichment by other elements such as silicon and magnesium is expected as well, based on calculation of nucleosynthesis yields from core-collapse SNe (e.g., Rauscher et al. 2002; Nomoto et al. 2006, 2013; Woosley & Heger 2007). This is in contradiction to what is derived in our spectral analyses such as the low silicon abundances in the atmospheres of HD 153919 as well as the slightly subsolar magnesium abundance in LM Vel and HD 306414. However, we note the supersolar magnesium abundance of HD 306414 and BD+60 73.
6.3 Angular momentum transfer and projected rotational velocities
Interacting binary stars do not only exchange mass but also angular momentum. Mass transfer due to RLOF often spins up the accreting star until this mass gainer rotates nearly critical (Packet 1981; de Mink et al. 2013). As mentioned earlier, the orbital parameters of all objects in our sample suggest that mass transfer has occurred in these systems in the past. However, in subsequent phases (especially the presented HMXB stage) the remaining OB-type star could loose angular momentum by its wind. It is therefore interesting to check if the donor stars exhibit rapid rotation.
We derive projected rotational velocities in the range from 60 to 230 km s−1. Interestingly, the smallest v sin i is found for HD 306414, which might has avoided strong binary interactions in the past. The two OBe stars in our sample exhibit the larges projected rotational velocities (200 and 230 km s−1). Nonetheless,we can rule out very rapid rotation for all donor stars in our sample. Using a rough approximation for the critical velocity  (neglecting for example effects due to oblateness) and adopting the mean statistical inclination of 57°, all donor stars are found to rotate far below critical.
The v sin i distribution of Galactic OB-type stars has been investigated in many studies (e.g., Dufton et al. 2006; Fraser et al. 2010; Bragança et al. 2012; Simón-Díaz 2010; Simón-Díaz & Herrero 2014; Garmany et al. 2015). These studies often find evidence of a bimodal distribution, showing a low v sin i peak and a group of fast rotators that extends to very high v sin i (e.g., Ramírez-Agudelo et al. 2013; Simón-Díaz & Herrero 2014; Garmany et al. 2015). A similar result is obtained by Ramachandran et al. (2018) for >200 OB-type stars in the Large Magellanic Cloud (LMC). de Mink et al. (2013) predict that the high v sin i peak predominately results from massive stars that were spun up because of binary interactions, while the low-velocity peak consists of single stars and binary systems that have not interacted yet.
Based on a study of about 200 northern Galactic OB-type stars, which also accounts for the effects of macroturbulence and microturbulence, Simón-Díaz & Herrero (2014) find that the v sin i distribution for O and B-type supergiants peaks at 70 and 50 km s−1, respectively.Comparing this with the projected rotational velocities of our sample, it appears that our program stars rotate on average more rapidly than single OB-type stars. This is in accordance with mass accretion in the past. The only exception might be HD 306414.
For the O-type components in six Galactic WR + O binaries, Shara et al. (2017) derive rotational velocities. Those are expected to be nearly critical, since the O-type stars are spun up by RLOF from the WR progenitor. However, Shara et al. (2017) find that these stars spin with a mean rotational velocity of 350 km s−1, which is about 65% of their critical value. They argue that a significant spin-down even on the short timescales of the WR-phase (a few hundred thousand years) must have taken place. The rotational velocities derived for our donor stars are substantially lower than those of the O-type components in the WR binaries. Compared to these objects, the evolution time scales of our stars are significantly larger (a few million years). Thus, our donor stars might had more time to spin down, which would be consistent with their lower rotational velocities. In this picture, our results and those by Shara et al. (2017) coincide nicely.
6.4 Mass-luminosity relation
In binary systems it is expected that the mass gainer is internally mixed because of angular momentum transfer. Therefore, the mass gainer should be overluminous compared to single stars of the same mass (e.g., Vanbeveren & De Loore 1994). To investigate whether this is the case for our program stars, we compare the spectroscopic masses constrained in this work with masses from stellar-evolution tracks. The latter are obtained with the BONNSAI Bayesian statistics tool (Schneider et al. 2014). Using stellar and wind parameters (T*, log L, log g, v sin i, XH, Ṁ) and their corresponding errors as input, the BONNSAI tool interpolates between evolutionary tracks calculated by Brott et al. (2011). Based on this set of single star evolution tracks, the tool predicts the current mass that an object with these parameters would have, if it has evolved like a single star. The correlated parameters are listed and compared in Table A.5.
For BD+60 73 and HD 306414, evolution masses could not be derived in this way, since the parameters of these stars are not reproduced by any of the underlying stellar evolution models. BD+53 2790 exhibits a spectroscopic mass that is 35% larger than its evolution mass. HD 153919 and LM Vel seem to be overluminous for their current mass.
6.5 Future evolution
Unfortunately, binary evolution tracks that would be applicable to the HMXBs investigated in this work are not available. Nevertheless, the future evolution of our targets can be discussed based on their current orbital configuration and the stellar properties of the donor stars. All investigated systems are compact enough that the donor stars, in the course of their further evolution, will expand sufficiently to eventually fill their Roche lobe, initiating direct mass transfer to their NS companions. Whether or not this mass transfer is stable will significantly influence the further evolution and the final fate of these HMXBs.
The stability of the mass-transfer in such systems has recently received increased attention. van den Heuvel et al. (2017) study whether this mass-transfer would lead to a (second) CE phase and whether this would result in a merger. They conclude that the mass-transfer is indeed unstable for a broad parameter range, and that the vast majority of the known HMXBs, consisting of supergiants with NS companions (>95%) would not survive the spiral-in within a CE phase. Applying their findings to our results, and assuming a NS mass of 1.4 M⊙, suggests that also all systems investigated in this work will enter a CE phase that leads to a merger. The same can be concluded from a comparison of the stellar and orbital parameters of our HMXBs with the CE-ejection solutions calculated by Kruckow et al. (2016) for massive binary systems. For all our objects, the minimal orbital separation is significantly lower than 100 R⊙, while the spectroscopic masses are higher than 8 M⊙. Comparing these constraints with the solutions presented by Kruckow et al. (2016, see their Fig. 2) suggests that the systems studied in this work are not able to eject the CE in the upcoming CE phase. These findings are consistent with conclusions by previous studies (e.g., Podsiadlowski 1994; van den Heuvel et al. 2017; Tauris et al. 2017).
If the systems studied in this work merge, they will form so-called Thorne–Żytkow objects (TŻO, Thorne & Zytkow 1975, 1977). Cannon et al. (1992) already discuss HMXBs as a potential source of TŻOs, identifying this as one of two possible channels. Podsiadlowski et al. (1995) estimate the number of TŻOs in the Galaxy to be 20–200. Thorne–Żytkow objects will likely appear as red supergiants (RSGs) (Biehle 1991; Cannon 1993), which are only distinguishable from normal RSGs by means of specific abundance patterns. These abundances are a result of the extremely hot non-equilibrium burning processes, that allow for interrupted rapid proton addition (Thorne & Zytkow 1977; Cannon 1993). The first promising candidate for a TŻO is identified by Levesque et al. (2014). According to Tauris et al. (2017), a few to ten percent of the luminous red supergiants (L ≥ 105 L⊙) in the Galaxy are expected to harbor a NS in their core.
Alternatively, TŻOs might appear as WN8 stars. This is suggested by Foellmi & Moffat (2002) because of the peculiar properties of these class of objects, such as the low binary fraction, strong variability, and the high percentage of runaways. Recently, this has been proposed to be a valid scenario for WR 124 (Toalá et al. 2018). Based on population synthesis models, already De Donder et al. (1997) have proposed that WR stars with compact objects at their center should exist. They denote these objects as “weird” WR stars. In view of the above results, we are inclined to conclude that the binaries examined in this work will presumably form some kind of TŻOs in the future.
However, a certain fraction of the HMXB population obviously survives, since we see compact DNS systems. If the HMXBs can avoid a merger in the imminent CE phase, they will likely undergo an additional phase of mass transfer according to the Case BB scenario (Tauris et al. 2015, 2017). This will lead to an ultra stripped star, which will explode as a Type Ib/Ic SN, leaving a NS. Since the associated kick will likely be small (Tauris et al. 2017), the binary system will presumably stay intact, forming a DNS.
Independent of the future evolution of the HMXBs investigated in this study, we highlight that HMXBs and their properties offer the possibility to falsify stellar evolution scenarios and population synthesis models predicting event rates of double degenerate mergers. These simulations often also include some kind of HMXB evolution phase. Thus, the properties of the HMXB population can be used to constrain these models. Therefore, further studies analyzing a large fraction of the HMXB population are imperative.
7 Efficiency of the accretion mechanism
The X-ray luminosity LX of the accreting NS in our HMXBs is related to the accretion rate Saccr via the accretion efficiency parameter ɛ:
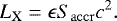 (5)
(5)
The actual value of the accretion efficiency depends on the detailed physics of the accretion mechanism. Comparing the X-ray luminosities measured with Swift during our HST observation (see Table 3) with theoretical expectations, we are able to put observational constraints on ɛ in some of the systems in our sample.
In the Bondi–Hoyle–Lyttleton formalism (e.g., Davidson & Ostriker 1973; Martínez-Núñez et al. 2017), the stellar wind accretion rate, Saccr, can be estimated as
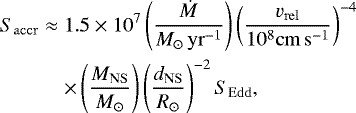 (6)
(6)
where dNS is the orbital separation and SEdd is the Eddington accretion rate, which is defined as
 (7)
(7)
with LEdd being the Eddington luminosity. For a fully ionized plasma that only consists of helium and hydrogen, LEdd can be approximated as
 (8)
(8)
The hydrogen mass fraction XH of the accreted material is obtained from our spectral analyses. The orbital separation between the donor star and the NS as well as the relative velocity of the matter passing by the NS are phase dependent. To allow for a meaningful comparison between the observed and the predicted X-ray flux, these parameters need to be calculated for the specific phase of our simultaneous HST and Swift observation. This is possible for only two systems in our sample (BD+60 73 and LM Vel) because an estimate of the inclination i is prerequisite for these calculations.To derive i, we make use of the mass function
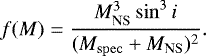 (9)
(9)
For BD+60 73 a mass function of f(M) = 0.0069 M⊙ is derived by González-Galán et al. (2014), while Gamen et al. (2015) determine f(M) = 0.004 M⊙ for LM Vel. Using the spectroscopic mass of the donor stars as derived from our spectral analyses, we are able to estimate the inclination to about 38° and 50° for BD+60 73 and LM Vel, respectively.
With the inclination at hand and the orbital period as well as the eccentricity from Table 2, we solve the Kepler equation numerically. This allows us to derive the phase dependent distance between the NS and the donor star dNS. The wind velocity at the position of the NSs during our HST and Swift observations can then be derived from the atmosphere models.
With these properties, we are able to derive the accretion efficiencies using Eqs. (5)–(8). For BD+60 73, we obtain ɛ = 1.1 × 10⁻³, while it is approximately a factor of two higher for LM Vel (ɛ = 2.1 × 10⁻³). Although all stellar and wind parameters of the donor stars are constrained well, these results must be treated with some caution because of the discrepancies of the spectral fits described in Appendix B. Shakura et al. (2014) suggest that at low-luminosity states, SFXTs can be at the stage of quasi-spherical settling accretion when the accretion rate on to the NS is suppressed by a factor of ~ 30 relative to the Bondi–Hoyle–Lyttleton value. This might be sufficient to explain the low accretion efficiency deduced for LM Vel and BD+60 73. Alternatively, Grebenev & Sunyaev (2007) and Bozzo et al. (2008) suggest that a magnetic gating or a propeller mechanism could strongly inhibit the accretion in SFXTs.
8 Wind accretion vs. Roche–lobe overflow
All HMXBs in our sample are thought to accrete matter only from the donor star wind or from its decretion disk. This perception is called into question by our analyses. For a subset of our sample RLOF during periastron passage seems plausible.
The Roche–lobe radii of the donor stars in our sample are estimated using a generalization of the fitting formula by Eggleton (1983) for nonsynchronous, eccentric binary systems provided by Sepinsky et al. (2007). For BD+60 73 and LM Vel, the Roche–lobe radius at periastron, Rrl,peri, is smaller than the stellar radius (see in Table 4). During this orbital phase, matter can be directly transferred to the NS via the inner Lagrangian point. We note that this finding has no influence on the estimates performed in the previous section since the HST and corresponding Swift observations of these sources were performed during a quiescent X-ray phase.
Interestingly, both of these sources are classified as X-ray transients. For BD+60 73, the X-ray light curve folded with the orbital phase peaks around ϕ ≈ 0.2, corresponding to 3–4 d after periastron (González-Galán et al. 2014). This behavior is usually attributed to an increased wind accretion-rate during periastron passage because of the lower wind velocity and higher wind density during this phase. However, for BD+60 73, the reason could be direct overflow of matter, which follows the gravitational potential. The delay between periastron passage and outburst might be due to inhibition of direct accretion onto the NS because of magnetic and centrifugal gating mechanisms (Illarionov & Sunyaev 1975; Grebenev & Sunyaev 2007; Bozzo et al. 2008).
For LM Vel, the X-ray outbursts cluster around periastron as well (Gamen et al. 2015). In contrast to BD+60 73, however, the outbursts are also observed prior to periastron passage (ϕ = 0.84 − 0.07), suggesting that in this case a combination of donor-wind capture and RLOF might feed the accretion.
For these two systems, the amount of mass transfer via RLOF needs to be relatively limited, since otherwise these systems are expected to quickly enter a CE phase. Moreover, we note that our estimates of the Roche-lobe radius should be treated with caution, since some of the orbital parameters of our binary systems, such as the inclination, are not well constrained.
Hydrodynamical simulations (Mohamed & Podsiadlowski 2007) suggest that a further mode of mass transfer plays a role in certain binary systems. This so-called wind Roche-lobe overflow (WRLOF) invokes a focusing of the primary stellar-wind towards the secondary. Recently, El Mellah et al. (2019b) have suggested that this mechanism is chiefly responsible for the formation ofso-called ultra-luminous X-ray sources (ULXs), and that it also plays a role in certain HMXBs. Wind Roche-lobe overflow gets important when the radius were the wind is accelerated beyond the escape velocity is comparable to the Roche-lobe radius (Mohamed & Podsiadlowski 2007; Abate et al. 2013). This condition is fulfilled for all wind-fed HMXBs in our sample (HD 153919, HD 306414, BD+60 73, and LM Vel). However, the detailed calculations by El Mellah et al. (2019b) suggest that this might be a too crude criterion. Their scenario for NSs is roughly applicable to HD 306414. For this object, their model predicts WRLOF for periastron, but not for apastron.
WRLOF seems to be a possible mass-transfer mechanism in wind-fed HMXBs, but presumably not during all orbital phases. Mass-transfer in these systems can be significantly higher compared to the classical Bondi–Hoyle–Lyttleton mechanism (Podsiadlowski & Mohamed 2007). However, this is not directly reflected in the X-ray luminosities of these objects, which are moderate (see e.g., Table 3). So, an effective gating mechanism seems to be at work in these systems that hampers the accretion of the transferred material (see also discussion in El Mellah et al. 2019b on Vela X-1).
9 Summary and conclusions
For this study, we observed six HMXBs with the HST STIS and secured high S/N, high resolution UV spectra. Simultaneously to these HST observations, we obtained Swift X-ray data to characterize the X-ray emission of the NSs. These data sets were used to determine the wind and stellar parameters of the donor stars in these HMXBs by means of state of the art model atmospheres, accounting for the influence of the X-rays on the donor-star atmosphere. The wind parameters of these objects were deduced for the first time. Based on these analyses, we draw the following conclusions:
The donor stars occupy the same parameter space as the putatively single OB-type stars from the Galaxy. Thus, the winds of these stars do not appear to be peculiar, in contrast to earlier suggestions.
There is no systematic difference between the wind parameters of the donor stars in SFXTs compared to persistent HMXBs.
All SFXTs in our sample are characterized by high orbital eccentricities. Thus, the wind velocities at the position of the NS and, consequently, the accretion rates are strongly phase dependent. This leads us to conclude that the orbital eccentricity is decisive for the distinction between SFXTs and persistent HMXBs.
In all investigated systems, the orbital velocities of the NSs are comparable to the wind velocity at their position. Therefore, the orbital velocity is important and can not be neglected in modeling the accretion or in estimating the accretion rate.
Since all systems in our study have very tight orbits, the donor-star wind has not yet reached its terminal velocity when passing the position of the NS. While this has been reported earlier, it is in strong contrast to what is often implicitly assumed in the wider literature.
For BD+60 73 and LM Vel, RLOF potentially occurs during periastron passage. Moreover, WRLOF seems plausible in a variety of HMXBs.
The donor stars of HD 153919, BD+60 73, and LM Vel are in advanced evolutionary stages, as indicated by their abundance patterns. They are on the way to become red supergiants and will thus engulf their NS companion soon.
The carbon and oxygen abundances of HD 153919, LM Vel, and HD 306414 suggest that their atmospheres were polluted by material accreted from the wind of the NS progenitor or SN ejecta.
The donor star of HD 153919 and LM Vel are overluminous for their current mass.
Statistically, the donor stars in our sample rotate faster than single OB-type stars typically do, suggesting mass accretion because of RLOF in the past. This is consistent with the orbital parameters of these systems.
Most likely, the donor stars and the NSs of the HMXBs studied in this work will merge in an upcoming CE phase, forming some kind of Thorne–Żytkow objects.
The accretion efficiency parameters ɛ of the NS inour sample are quite low, suggesting that either spherical settling accretion or a gated accretion mechanism was at work duringour observations.
Acknowledgements
We thank the anonymous referee for their constructive comments. The first author of this work (R.H.) is supported by the Deutsche Forschungsgemeinschaft (DFG) under grant HA 1455/28-1. L.M.O. acknowledges support from the Verbundforschung grant 50 OR 1809. J.M.T. acknowledges the research grant ESP2017-85691-P. A.A.C.S. is supported by the Deutsche Forschungsgemeinschaft (DFG) under grant HA 1455/26. F.F., K.S., and A.B. are grateful for support from STScI Grant HST-GO-13703.002-A. T.S. acknowledges support from the European Research Council (ERC) under the European Union’s DLV-772225-MULTIPLES Horizon 2020 research and innovation programme. Some/all of the data presented in this paper were obtained from the Mikulski Archive for Space Telescopes (MAST). STScI is operated by the Association of Universities for Research in Astronomy, Inc., under NASA contract NAS5-26555. Support for MAST for non-HST data is provided by the NASA Office of Space Science via grant NNX09AF08G and by other grants and contracts. This research has made use of the VizieR catalogue access tool, Strasbourg, France. The original description of the VizieR service was published in A&AS 143, 23.
Note added in proof. In a recently published study, Ducci et al. (2019) analyze the LM Vel system (IGR J08408-4503) using archival and newly acquired X-ray data. The authors discuss in detail the possibility of RLOF and the formation of an accretion disc around the NS, leading to conclusions that are similar to ours.
Appendix A Additional tables
Spectroscopic data.
Photometry.
X-ray measurements at times close to the UV observations.
Atomic model used in the stellar atmosphere calculations.
Empirical stellar parameters, compared to the best-fitting single-star evolution model as interpolated with the BONNSAI tool.
Atmospheric structure of the model used to fit HD 153919.
Same as Table A.6, BD+53 2790.
Same as Table A.6, HD 100199.
Appendix B Comments on the individual stars
HD 153919 (4U 1700-37)
The donor star in this persistent HMXB has the earliest spectral-type in our sample, exhibiting prominent emission lines in its spectrum. Based on our spectra and our spectral analysis we would classify this donor star as O6 If/WN9, in contrast to the O6 Iafpe classification assigned by Sota et al. (2014). We would assign this different spectral type, since from our perspective this object is actually evolving from an Of to a WN star, in contrast to what is discussed by Sota et al. (2014) for the O6 Iafpe classification. In this sense, the O6 If/WN9 category would be an extension of the Of/WN class to cooler temperatures in reminiscence of the old “cool slash” category. From our perspective, an O6 If/WN9 classification would be more suitable also in representation of the wind parameters of this object, which point to an object that is on its way to the WR stage. The derived mass-loss rate is compatible with that of other Of/WN stars (Hainich et al. 2014).
The basic stellar parameters derived in this work are in good agreement with the previous results obtained by Clark et al. (2002). The mass-loss rate derived by means of our models accounting for wind inhomogeneities is almost a factor of four lower than the value obtained by Clark et al. (2002) with unclumped models. The latter authors already have noted that moderate wind clumping would reduce their derived mass-loss rate. Taking into account the uncertainties of the individual studies, this brings the two works into agreement. We note that the terminal velocity determined from our HST spectrum is slightly higher (by 150 km s−1) than obtained by Clark et al. (2002).
Interestingly, the hydrogen abundance deduced from our spectral fit coincides (within the uncertainties) with the value assumed by Clark et al. (2002). While we also derived a supersolar nitrogen abundance, it is a factor of three lower compared to the value determined by Clark et al. (2002). The carbon and oxygen abundances are in a better agreement. Like Clark et al. (2002), we determine a solar carbon abundance and a oxygen abundance of about 0.5 XO,⊙.
BD+60 73 (IGR J00370+6122)
According to González-Galán et al. (2014), this system is intermediate between a persistent HMXB and an “intermediate” SFXT because of its exceptional X-ray properties. In contrast to almost all other donor stars in our sample, a micro turbulence velocity of  is required to achieve a satisfying fit. Most of the stellar parameters we deduce for BD+60 73 agree very well with the results by González-Galán et al. (2014). While these authors assume a wind-strength Q-parameter of log Q = −13.0, our detailed wind analysis results in a value that almost a factor of three higher. Also the derived abundances partly differ. The carbon and nitrogen abundances are a factor of about 1.5 higher in our study than the results presented by González-Galán et al. (2014), while our oxygen abundance is lower by the same factor. The deviation is the highest for the magnesium abundances, which is twice as high in our study compared to their value. The derived silicon abundances are approximately compatible. The same holds for the hydrogen abundance, which is only a few percent lower in this work.
In the fit shown in Fig. C.2, the model obviously falls short to reproduce the resonance doublets of N V λλ 1239, 1243 and C IV λλ 5801, 5812 with the observed strength. This model has been calculated with an X-ray irradiation that is consistent with the Swift observation. However, if we adopt an approximately 70 times higher X-ray irradiation, those resonance doublets perfectly match the observation, as demonstrated in Fig. C.3. Obviously, the stronger X-ray field causes sufficient photo- and Auger ionization to populate the N V and C IV ground states.
At this point, we have to realize that the X-ray measurement with Swift was not strictly simultaneous to our HST exposure, but was taken 4.5 h later for technical reasons. Thus, given the X-ray variability of this target, we conclude that at the exact time of the HST observation the X-ray irradiation was somewhat enhanced due to some kind of flare.
LM Vel (IGR J08408-4503)
To our knowledge, the spectral analysis presented here is the first one for LM Vel. Although the overall spectral fit represents the observed spectrum very well, we are not able to achieve a satisfactory fit of the C III line at 1245 Å, whichis stronger in the model compared to the observation. This might be a result of the neglection of macro clumping in our analysis, which in turn might imply an underestimation of the mass-loss rate (Oskinova et al. 2007).
Similar to BD+60 73, the model that has been calculated with an X-ray irradiation, which is consistent with the Swift data, falls short to reproduce the N Vλλ 1239, 1243 doublet (see Fig. C.4). Those models that are able to reproduce this doublet to a satisfactory level (see Fig. C.5) require an X-ray flux that is roughly 300 times higher than measured by the Swift observations. For technical reasons, the Swift data was taken 6.2 h earlier than the HST data. Thus, this X-ray transient might experienced an X-ray outburst during our HST observations.
As for HD 153919, we find that this donor star is hydrogen and oxygen depleted, while the carbon abundance is solar and the nitrogen abundance is supersolar.
BD+53 2790 (4U 2206+54)
Unfortunately, we only have low resolution optical spectra with a low S/N at hand for this object, which is one reason for the relatively large error margins for some of the stellar parameters listed in Table 4. Nevertheless, these spectra clearly show a double peaked Hα emission line, as typical for the decretion disks of Be- and Oe-type stars. The same spectral characteristic is posed by the hydrogen lines in the H- and K-band spectra shown in Fig. C.7. However, Blay et al. (2006, see also Negueruela & Reig 2001) argue that this star does not fulfill all criteria of a classical Be-type star, but is rather a peculiar O9.5 V star. While the donor star in this system is analyzed in this work, it is not considered in the discussion section of this paper because of its unclear HMXB type.
Since our atmosphere models are restricted to spherical symmetry, we cannot account for asymmetries caused by the high rotational velocities of Be- and Oe-type stars, such as oblateness or decretion disks. Nevertheless, an adequate spectral fit can be achieved for most parts of the observed spectrum, with the exception of the hydrogen lines that are filled by the emission from the decretion disks. We also note that the width of the emission peaks of the resonance lines of C IV and N V in the UV cannot be reproduced completely by our model, most likely because of asymmetries in the wind of this star. Since the Hα line is dominated by emission from the decretion disk, this line cannot be used to constrain the clumping within the donor star atmosphere and wind. Therefore, we assume a clumping factor of D = 10.
HD 306414 (IGR J11215-5952)
This system is one of the SFXTs in our sample. Since it was not detected in our Swift observations, we had to assume a certain X-ray flux to proceed with the atmosphere model fits.
Massive stars are inherent X-ray sources because of their winds that exhibit an intrinsic instability. This so-called line-driven wind instability (Lucy & Solomon 1970) gives rise to wind inhomogeneities as well as shocks that can produce X-rays (e.g., Feldmeier et al. 1997; Runacres & Owocki 2002). The intrinsic X-ray flux of massive stars is proportional to their stellar luminosity with LX ∕ L ≈ 10−7 (Pallavicini et al. 1981).
In the atmosphere model for this source, we therefore approximated the X-ray flux by two components. For the first one, we used a relatively soft X-ray continuum corresponding to an X-ray temperature of TX = 3 × 10⁶ K. This component was inserted at a radius of 1.5 R*, while the corresponding filling factor was adjusted such that LX ≈ 10−7 L is produced. To model the contribution of the NS to the X-ray emission, a second X-ray continuum with an X-ray temperature of TX = 3 × 10⁷ K was injected at the position of the NS. The filling factor for this component was chosen such that the UV observations are reproduced best by the model, while ensuring that the total X-ray flux is below the detection limit of Swift.
The donor star has previously been analyzed by Lorenzo et al. (2014). While we obtain a slightly higher stellar temperature and surface gravity as the latter authors, the luminosity derived in our analysis is 0.2 dex lower even after accounting for the difference in the assumed distance. The reason for this discrepancy might be the different reddening estimates. While in our case the reddening is derived from an SED fit spanning from UV to infrared data, the estimate conducted by Lorenzo et al. (2014) is solely based on optical and IR photometry, leading to a significantly higher RV value of 4.2 and a slightly lower EB−V = 0.7. Assuming these values for our model SED does not result in a satisfactory fit, providing confidence to our solution. The lower luminosity obtained from our analysis in comparison to that derived by Lorenzo et al. (2014) also entails a spectroscopic mass that is about 30% lower.
Our spectral analysis based on UV and optical data also results in a significantly lower mass-loss rate than determined by Lorenzo et al. (2014) solely on the basis of optical spectra. This discrepancy in the derived mass-loss rate can be in large part attributed to the neglect of wind inhomogeneities in the spectral analysis by Lorenzo et al. (2014). If we scale the mass-loss rate determined by Lorenzo et al. (2014) according to the clumping factor (D = 20) derived in this work, the discrepancy nearly vanishes.
The hydrogen, oxygen, and magnesium abundances determine by our analysis agree very well with the ones obtained by Lorenzo et al. (2014). The carbon abundances coincide on a 20% level, while the nitrogen and silicon abundance are higher by 30 and 40%, respectively, in our study compared to those derived by Lorenzo et al. (2014). These deviations might be a result of different micro turbulence velocities assumed in the spectral analyses. Unfortunately, Lorenzo et al. (2014) do not specify the micro turbulence velocity they assume. However, a value slightly different to the  required by our analysis might explain the differences in the abundance measurements.
HD 100199 (IGR J11305-6256)
In this work we present the first spectral analysis of this Be X-ray binary. The same restrictions as outlined for BD+53 2790 apply to thespectral modeling of HD 100199. Overall, an excellent fit quality could be achieved with the exception of the line cores of the hydrogen lines in the optical. As for BD+53 2790, we are not able to constrain the clumping and assume D = 10.
Appendix C Spectral fits
 |
Fig. C.1 Spectral fit of HD 153919. The observations are shown as blue continuous lines (spectra) and blue boxes (photometry). The best fitting model is overplotted by a dashed red line. Note that the observed far UV spectrum (FUSE) is heavily contaminated by interstellar abortion lines, mostly originating from H2. |
 |
Fig. C.1 continued. |
 |
Fig. C.3 BD+60 73: alternative UV-line fit (cf. Fig. C.2, second panel). For the model shown here, an approximately 70 times higher X-ray irradiation has been adopted, which brings the resonance doublets of N V λλ 1239, 1243 and C IVλλ 5801, 5812 to the observed strength (see text in Appendix B). |
 |
Fig. C.4 continued. |
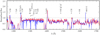 |
Fig. C.5 LM Vel: alternative UV-line fit (cf. Fig. C.4, second panel). For the model shown here, a roughly 300 times higher X-ray irradiation has been adopted, which brings the resonance doublet of N V λλ 1239, 1243 almost to the observed strength (see text in Appendix B). The remaining discrepancy is because of the C III line at 1245 Å (see Appendix B for details). |
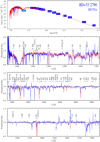 |
Fig. C.7 Same as Fig. C.1, but for BD+53 2790. The IR spectrum is clearly dominated by emission from the decretion disk. |
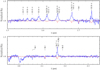 |
Fig. C.7 continued. |
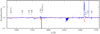 |
Fig. C.8 continued. |
References
- Abate, C., Pols, O. R., Izzard, R. G., Mohamed, S. S., & de Mink S. E. 2013, A&A, 552, A26 [NASA ADS] [CrossRef] [EDP Sciences] [Google Scholar]
- Anderson, E., & Francis, C. 2012, Astron. Lett., 38, 331 [NASA ADS] [CrossRef] [Google Scholar]
- Appenzeller, I., Fricke, K., Fürtig, W., et al. 1998, The Messenger, 94, 1 [NASA ADS] [Google Scholar]
- Asplund, M., Grevesse, N., Sauval, A. J., & Scott, P. 2009, ARA&A, 47, 481 [NASA ADS] [CrossRef] [Google Scholar]
- Bailer-Jones, C. A. L., Rybizki, J., Fouesneau, M., Mantelet, G., & Andrae, R. 2018, AJ, 156, 58 [NASA ADS] [CrossRef] [Google Scholar]
- Baum, E., Hamann, W.-R., Koesterke, L., & Wessolowski, U. 1992, A&A, 266, 402 [NASA ADS] [Google Scholar]
- Biehle, G. T. 1991, ApJ, 380, 167 [NASA ADS] [CrossRef] [Google Scholar]
- Blay, P., Negueruela, I., Reig, P., et al. 2006, A&A, 446, 1095 [NASA ADS] [CrossRef] [EDP Sciences] [Google Scholar]
- Blondin, J. M. 1994, ApJ, 435, 756 [NASA ADS] [CrossRef] [EDP Sciences] [Google Scholar]
- Blondin, J. M., Kallman, T. R., Fryxell, B. A., & Taam, R. E. 1990, ApJ, 356, 591 [NASA ADS] [CrossRef] [Google Scholar]
- Bondi, H., & Hoyle, F. 1944, MNRAS, 104, 273 [NASA ADS] [CrossRef] [Google Scholar]
- Bouret, J.-C., Lanz, T., Hillier, D. J., et al. 2003, ApJ, 595, 1182 [NASA ADS] [CrossRef] [Google Scholar]
- Bozzo, E., Falanga, M., & Stella, L. 2008, ApJ, 683, 1031 [NASA ADS] [CrossRef] [Google Scholar]
- Bragança, G. A., Daflon, S., Cunha, K., et al. 2012, AJ, 144, 130 [NASA ADS] [CrossRef] [Google Scholar]
- Brott, I., de Mink, S. E., Cantiello, M., et al. 2011, A&A, 530, A115 [NASA ADS] [CrossRef] [EDP Sciences] [Google Scholar]
- Burrows, D. N., Hill, J. E., Nousek, J. A., et al. 2005, Space Sci. Rev., 120, 165 [NASA ADS] [CrossRef] [Google Scholar]
- Cannon, R. C. 1993, MNRAS, 263, 817 [NASA ADS] [CrossRef] [Google Scholar]
- Cannon, R. C., Eggleton, P. P., Zytkow, A. N., & Podsiadlowski, P. 1992, ApJ, 386, 206 [NASA ADS] [CrossRef] [Google Scholar]
- Cardelli, J. A., Clayton, G. C., & Mathis, J. S. 1989, ApJ, 345, 245 [NASA ADS] [CrossRef] [Google Scholar]
- Cash, W. 1979, ApJ, 228, 939 [NASA ADS] [CrossRef] [Google Scholar]
- Castor, J. I., & Lamers, H. J. G. L. M. 1979, ApJS, 39, 481 [NASA ADS] [CrossRef] [Google Scholar]
- Chaty, S. 2008, Chin. J. Astron.d Astrophys. Suppl., 8, 197 [NASA ADS] [Google Scholar]
- Clark, J. S., Goodwin, S. P., Crowther, P. A., et al. 2002, A&A, 392, 909 [NASA ADS] [CrossRef] [EDP Sciences] [Google Scholar]
- Corbet, R. H. D., & Peele, A. G. 2001, ApJ, 562, 936 [NASA ADS] [CrossRef] [Google Scholar]
- Crowther, P. A., Lennon, D. J., & Walborn, N. R. 2006, A&A, 446, 279 [NASA ADS] [CrossRef] [EDP Sciences] [Google Scholar]
- Cutri, R. M., Skrutskie, M. F., van Dyk, S., et al. 2003, VizieR Online Data Catalog: II/246 [Google Scholar]
- Cutri, R. M., Wright, E. L., Conrow, T., et al. 2012, VizieR Online Data Catalog: II/311 [Google Scholar]
- Davidson, K., & Ostriker, J. P. 1973, ApJ, 179, 585 [NASA ADS] [CrossRef] [Google Scholar]
- De Donder, E., Vanbeveren, D., & van Bever, J. 1997, A&A, 318, 812 [NASA ADS] [Google Scholar]
- de Mink, S. E., Langer, N., Izzard, R. G., Sana, H., & de Koter, A. 2013, ApJ, 764, 166 [NASA ADS] [CrossRef] [Google Scholar]
- DENIS Consortium 2005, VizieR Online Data Catalog: II/263 [Google Scholar]
- Ducci L., Ramano P., Ji L., Santangelo A. 2019, A&A, 631, A135 [NASA ADS] [CrossRef] [EDP Sciences] [Google Scholar]
- Dufton, P. L., Smartt, S. J., Lee, J. K., et al. 2006, A&A, 457, 265 [NASA ADS] [CrossRef] [EDP Sciences] [Google Scholar]
- Egan, M. P., Price, S. D., Kraemer, K. E., et al. 2003, VizieR Online Data Catalog: V/114 [Google Scholar]
- Eggleton, P. P. 1983, ApJ, 268, 368 [NASA ADS] [CrossRef] [Google Scholar]
- El Mellah, I., Sander, A. A. C., Sundqvist, J. O., & Keppens, R. 2019a, A&A, 622, A189 [NASA ADS] [CrossRef] [EDP Sciences] [Google Scholar]
- El Mellah, I., Sundqvist, J. O., & Keppens, R. 2019b, A&A, 622, L3 [NASA ADS] [CrossRef] [EDP Sciences] [Google Scholar]
- Falanga, M., Bozzo, E., Lutovinov, A., et al. 2015, A&A, 577, A130 [NASA ADS] [CrossRef] [EDP Sciences] [Google Scholar]
- Feldmeier, A., Puls, J., & Pauldrach, A. W. A. 1997, A&A, 322, 878 [NASA ADS] [Google Scholar]
- Foellmi, C., & Moffat, A. F. J. 2002, ASP Conf. Ser., 263, 123 [NASA ADS] [Google Scholar]
- Fraser, M., Dufton, P. L., Hunter, I., & Ryans, R. S. I. 2010, MNRAS, 404, 1306 [NASA ADS] [Google Scholar]
- Gaia Collaboration 2016, VizieR Online Data Catalog: I/337 [Google Scholar]
- Gaia Collaboration (Brown, A. G. A., et al.) 2018, A&A, 616, A1 [NASA ADS] [CrossRef] [EDP Sciences] [Google Scholar]
- Gamen, R., Barbà, R. H., Walborn, N. R., et al. 2015, A&A, 583, L4 [NASA ADS] [CrossRef] [EDP Sciences] [Google Scholar]
- Garmany, C. D., Glaspey, J. W., Bragança, G. A., et al. 2015, AJ, 150, 41 [NASA ADS] [CrossRef] [Google Scholar]
- Garrison, R. F., Hiltner, W. A., & Schild, R. E. 1977, ApJS, 35, 111 [NASA ADS] [CrossRef] [Google Scholar]
- Gehrels, N., Chincarini, G., Giommi, P., et al. 2004, ApJ, 611, 1005 [NASA ADS] [CrossRef] [Google Scholar]
- Giménez-García, A., Shenar, T., Torrejón, J. M., et al. 2016, A&A, 591, A26 [Google Scholar]
- González-Galán, A., Negueruela, I., Castro, N., et al. 2014, A&A, 566, A131 [NASA ADS] [CrossRef] [EDP Sciences] [Google Scholar]
- Gräfener, G.,& Hamann, W.-R. 2005, A&A, 432, 633 [NASA ADS] [CrossRef] [EDP Sciences] [Google Scholar]
- Gräfener, G., Koesterke, L., & Hamann, W.-R. 2002, A&A, 387, 244 [NASA ADS] [CrossRef] [EDP Sciences] [Google Scholar]
- Grebenev, S. A., & Sunyaev, R. A. 2007, Astron. Lett., 33, 149 [NASA ADS] [CrossRef] [Google Scholar]
- Hainich, R., Rühling, U., Todt, H., et al. 2014, A&A, 565, A27 [NASA ADS] [CrossRef] [EDP Sciences] [Google Scholar]
- Hamann, W.-R., & Gräfener, G. 2003, A&A, 410, 993 [NASA ADS] [CrossRef] [EDP Sciences] [Google Scholar]
- Hamann, W.-R., & Koesterke, L. 1998, A&A, 335, 1003 [NASA ADS] [Google Scholar]
- Hammerschlag-Hensberge, G., van Kerkwijk, M. H., & Kaper, L. 2003, A&A, 407, 685 [NASA ADS] [CrossRef] [EDP Sciences] [Google Scholar]
- Hatchett, S., & McCray, R. 1977, ApJ, 211, 552 [NASA ADS] [CrossRef] [Google Scholar]
- Hauschildt, P. H., & Baron, E. 2014, A&A, 566, A89 [NASA ADS] [CrossRef] [EDP Sciences] [Google Scholar]
- Heger, A., & Langer, N. 2000, ApJ, 544, 1016 [NASA ADS] [CrossRef] [Google Scholar]
- Hillier, D. J. 1991, A&A, 247, 455 [NASA ADS] [Google Scholar]
- Hillier, D. J., & Miller, D. L. 1999, ApJ, 519, 354 [NASA ADS] [CrossRef] [Google Scholar]
- Hoyle, F., & Lyttleton, R. A. 1939, Proc. Camb. Philos. Soc., 35, 405 [Google Scholar]
- Huenemoerder, D. P., Oskinova, L. M., Ignace, R., et al. 2012, ApJ, 756, L34 [NASA ADS] [CrossRef] [Google Scholar]
- Illarionov, A. F., & Sunyaev, R. A. 1975, A&A, 39, 185 [NASA ADS] [Google Scholar]
- in’t Zand, J. J. M., Kuiper, L., den Hartog, P. R., Hermsen, W., & Corbet, R. H. D. 2007, A&A, 469, 1063 [NASA ADS] [CrossRef] [EDP Sciences] [Google Scholar]
- Islam, N., & Paul, B. 2016, MNRAS, 461, 816 [NASA ADS] [CrossRef] [Google Scholar]
- Ivanova, N., Justham, S., Chen, X., et al. 2013, A&ARv, 21, 59 [Google Scholar]
- Kaufer, A., Stahl, O., Tubbesing, S., et al. 1999, The Messenger, 95, 8 [Google Scholar]
- Kimble, R. A., Woodgate, B. E., Bowers, C. W., et al. 1998, ApJ, 492, L83 [NASA ADS] [CrossRef] [Google Scholar]
- Krtička, J., Kubát, J., & Krtičková, I. 2015, A&A, 579, A111 [NASA ADS] [CrossRef] [EDP Sciences] [Google Scholar]
- Kruckow, M. U., Tauris, T. M., Langer, N., et al. 2016, A&A, 596, A58 [NASA ADS] [CrossRef] [EDP Sciences] [Google Scholar]
- Kudritzki, R. P. 2002, ApJ, 577, 389 [NASA ADS] [CrossRef] [Google Scholar]
- Kudritzki, R. P., Pauldrach, A., Puls, J., & Abbott, D. C. 1989, A&A, 219, 205 [NASA ADS] [Google Scholar]
- Kudritzki, R.-P., Lennon, D. J., & Puls, J. 1995, in Science with the VLT, eds. J. R. Walsh, & I. J. Danziger (Heidelberg: Springer), 246 [Google Scholar]
- Kudritzki, R. P., Puls, J., Lennon, D. J., et al. 1999, A&A, 350, 970 [Google Scholar]
- Langer, N. 1992, A&A, 265, L17 [NASA ADS] [Google Scholar]
- Levesque, E. M., Massey, P., Żytkow, A. N., & Morrell, N. 2014, MNRAS, 443, L94 [Google Scholar]
- Lorenzo, J., Negueruela, I., Castro, N., et al. 2014, A&A, 562, A18 [NASA ADS] [CrossRef] [EDP Sciences] [Google Scholar]
- Lucy, L. B., & Solomon, P. M. 1970, ApJ, 159, 879 [NASA ADS] [CrossRef] [Google Scholar]
- Maeder, A. 1987, A&A, 178, 159 [NASA ADS] [Google Scholar]
- Marcolino, W. L. F., Bouret, J.-C., Martins, F., et al. 2009, A&A, 498, 837 [NASA ADS] [CrossRef] [EDP Sciences] [Google Scholar]
- Martinez-Chicharro, M., Torrejón, J. M., Oskinova, L., et al. 2018, MNRAS, 473, L74 [NASA ADS] [CrossRef] [Google Scholar]
- Martínez-Núñez, S., Sander, A., Gímenez-García, A., et al. 2015, A&A, 578, A107 [NASA ADS] [CrossRef] [EDP Sciences] [Google Scholar]
- Martínez-Núñez, S., Kretschmar, P., Bozzo, E., et al. 2017, Space Sci. Rev., 212, 59 [NASA ADS] [CrossRef] [Google Scholar]
- Martins, F., Schaerer, D., Hillier, D. J., et al. 2005, A&A, 441, 735 [NASA ADS] [CrossRef] [EDP Sciences] [Google Scholar]
- Martins, F., Hillier, D. J., Bouret, J. C., et al. 2009, A&A, 495, 257 [NASA ADS] [CrossRef] [EDP Sciences] [Google Scholar]
- Massey, P., Puls, J., Pauldrach, A. W. A., et al. 2005, ApJ, 627, 477 [NASA ADS] [CrossRef] [Google Scholar]
- Mermilliod, J. C. 2006, VizieR Online Data Catalog: II/168 [Google Scholar]
- Mohamed, S., & Podsiadlowski, P. 2007, ASP Conf. Ser., 372, 397 [Google Scholar]
- Mokiem, M. R., de Koter, A., Vink, J. S., et al. 2007, A&A, 473, 603 [NASA ADS] [CrossRef] [EDP Sciences] [Google Scholar]
- Monet, D. G., Levine, S. E., Canzian, B., et al. 2003, AJ, 125, 984 [NASA ADS] [CrossRef] [Google Scholar]
- Moos, H. W., Cash, W. C., Cowie, L. L., et al. 2000, ApJ, 538, L1 [NASA ADS] [CrossRef] [Google Scholar]
- Morel, M., & Magnenat, P. 1978, A&AS, 34, 477 [NASA ADS] [Google Scholar]
- Motch, C., Stella, L., Janot-Pacheco, E., & Mouchet, M. 1991, ApJ, 369, 490 [NASA ADS] [CrossRef] [Google Scholar]
- Munari, U., & Zwitter, T. 2002, A&A, 383, 188 [NASA ADS] [CrossRef] [EDP Sciences] [Google Scholar]
- Negueruela, I., & Reig, P. 2001, A&A, 371, 1056 [NASA ADS] [CrossRef] [EDP Sciences] [Google Scholar]
- Negueruela, I., Smith, D. M., Reig, P., Chaty, S., & Torrejón, J. M. 2006, ESA SP, 604, 165 [NASA ADS] [Google Scholar]
- Nomoto, K., Tominaga, N., Umeda, H., Kobayashi, C., & Maeda, K. 2006, Nucl. Phys. A, 777, 424 [NASA ADS] [CrossRef] [Google Scholar]
- Nomoto, K., Kobayashi, C., & Tominaga, N. 2013, ARA&A, 51, 457 [NASA ADS] [CrossRef] [Google Scholar]
- Oskinova, L. M., Hamann, W.-R., & Feldmeier, A. 2007, A&A, 476, 1331 [NASA ADS] [CrossRef] [EDP Sciences] [Google Scholar]
- Oskinova, L. M., Todt, H., Ignace, R., et al. 2011, MNRAS, 416, 1456 [NASA ADS] [CrossRef] [Google Scholar]
- Oskinova, L. M., Feldmeier, A., & Kretschmar, P. 2012, MNRAS, 421, 2820 [NASA ADS] [CrossRef] [Google Scholar]
- Ostriker, J. P., & Davidson, K. 1973, IAU Symp., 55, 143 [NASA ADS] [Google Scholar]
- Özel, F., & Freire, P. 2016, ARA&A, 54, 401 [Google Scholar]
- Packet, W. 1981, A&A, 102, 17 [NASA ADS] [Google Scholar]
- Paczyński, B. 1967, Acta Astron., 17, 355 [NASA ADS] [Google Scholar]
- Pallavicini, R., Golub, L., Rosner, R., et al. 1981, ApJ, 248, 279 [NASA ADS] [CrossRef] [Google Scholar]
- Pauldrach, A., Puls, J., & Kudritzki, R. P. 1986, A&A, 164, 86 [NASA ADS] [Google Scholar]
- Podsiadlowski, P. 1994, Mem. Soc. Astron. It., 65, 359 [NASA ADS] [Google Scholar]
- Podsiadlowski, P., & Mohamed, S. 2007, Balt. Astron., 16, 26 [NASA ADS] [Google Scholar]
- Podsiadlowski, P., Cannon, R. C., & Rees, M. J. 1995, MNRAS, 274, 485 [NASA ADS] [CrossRef] [EDP Sciences] [Google Scholar]
- Prinja, R. K. 1989, MNRAS, 241, 721 [NASA ADS] [CrossRef] [Google Scholar]
- Puls, J., Kudritzki, R.-P., Herrero, A., et al. 1996, A&A, 305, 171 [NASA ADS] [Google Scholar]
- Ramachandran, V., Hamann, W.-R., Hainich, R., et al. 2018, A&A, 615, A40 [NASA ADS] [CrossRef] [EDP Sciences] [Google Scholar]
- Ramírez-Agudelo, O. H., Simón-Díaz, S., Sana, H., et al. 2013, A&A, 560, A29 [NASA ADS] [CrossRef] [EDP Sciences] [Google Scholar]
- Rauscher, T., Heger, A., Hoffman, R. D., & Woosley, S. E. 2002, ApJ, 576, 323 [NASA ADS] [CrossRef] [Google Scholar]
- Reig, P., & Fabregat, J. 2015, A&A, 574, A33 [NASA ADS] [CrossRef] [EDP Sciences] [Google Scholar]
- Reig, P., Torrejón, J. M., Negueruela, I., et al. 2009, A&A, 494, 1073 [NASA ADS] [CrossRef] [EDP Sciences] [Google Scholar]
- Ribó, M., Negueruela, I., Blay, P., Torrejón, J. M., & Reig, P. 2006, A&A, 449, 687 [NASA ADS] [CrossRef] [EDP Sciences] [Google Scholar]
- Rodes-Roca, J. J., Bernabeu, G., Magazzù, A., Torrejón, J. M., & Solano, E. 2018, MNRAS, 476, 2110 [NASA ADS] [Google Scholar]
- Romano, P., Sidoli, L., Cusumano, G., et al. 2009, ApJ, 696, 2068 [NASA ADS] [CrossRef] [Google Scholar]
- Runacres, M. C., & Owocki, S. P. 2002, A&A, 381, 1015 [NASA ADS] [CrossRef] [EDP Sciences] [Google Scholar]
- Sander, A. A. C. 2019, IAU Symp., 346, 17 [NASA ADS] [Google Scholar]
- Sander, A., Shenar, T., Hainich, R., et al. 2015, A&A, 577, A13 [NASA ADS] [CrossRef] [EDP Sciences] [Google Scholar]
- Sander, A. A. C., Fürst, F., Kretschmar, P., et al. 2018, A&A, 610, A60 [NASA ADS] [CrossRef] [EDP Sciences] [Google Scholar]
- Sander, A. A. C., Hamann, W.-R., Todt, H., et al. 2019, A&A, 621, A92 [NASA ADS] [CrossRef] [EDP Sciences] [Google Scholar]
- Schneider, F. R. N., Langer, N., de Koter, A., et al. 2014, A&A, 570, A66 [NASA ADS] [CrossRef] [EDP Sciences] [Google Scholar]
- Seaton, M. J. 1979, MNRAS, 187, 73P [NASA ADS] [CrossRef] [Google Scholar]
- Sepinsky, J. F., Willems, B., & Kalogera, V. 2007, ApJ, 660, 1624 [NASA ADS] [CrossRef] [Google Scholar]
- Shakura, N., Postnov, K., Sidoli, L., & Paizis, A. 2014, MNRAS, 442, 2325 [NASA ADS] [CrossRef] [Google Scholar]
- Shara, M. M., Crawford, S. M., Vanbeveren, D., et al. 2017, MNRAS, 464, 2066 [NASA ADS] [CrossRef] [Google Scholar]
- Shenar, T., Oskinova, L. M., Järvinen, S. P., et al. 2017, A&A, 606, A91 [NASA ADS] [CrossRef] [EDP Sciences] [Google Scholar]
- Sidoli, L., & Paizis, A. 2018, MNRAS, 481, 2779 [NASA ADS] [CrossRef] [Google Scholar]
- Simón-Díaz, S. 2010, A&A, 510, A22 [NASA ADS] [CrossRef] [EDP Sciences] [Google Scholar]
- Simón-Díaz, S., & Herrero, A. 2014, A&A, 562, A135 [NASA ADS] [CrossRef] [EDP Sciences] [Google Scholar]
- Sota, A., Maíz Apellániz, J., Morrell, N. I., et al. 2014, ApJS, 211, 10 [NASA ADS] [CrossRef] [Google Scholar]
- Stoyanov, K. A., Zamanov, R. K., Latev, G. Y., Abedin, A. Y., & Tomov, N. A. 2014, Astron. Nachr., 335, 1060 [NASA ADS] [CrossRef] [Google Scholar]
- Sundqvist, J. O., Owocki, S. P., & Puls, J. 2018, A&A, 611, A17 [NASA ADS] [CrossRef] [EDP Sciences] [Google Scholar]
- Swank, J. H., Smith, D. M., & Markwardt, C. B. 2007, ATel, 999 [Google Scholar]
- Taam, R. E., & Ricker, P. M. 2010, New Astron. Rev., 54, 65 [NASA ADS] [CrossRef] [Google Scholar]
- Taam, R. E., & Sandquist, E. L. 2000, ARA&A, 38, 113 [NASA ADS] [CrossRef] [Google Scholar]
- Tauris, T. M., Langer, N., & Podsiadlowski, P. 2015, MNRAS, 451, 2123 [NASA ADS] [CrossRef] [Google Scholar]
- Tauris, T. M., Kramer, M., Freire, P. C. C., et al. 2017, ApJ, 846, 170 [NASA ADS] [CrossRef] [Google Scholar]
- Telting, J. H., Avila, G., Buchhave, L., et al. 2014, Astron. Nachr., 335, 41 [NASA ADS] [CrossRef] [Google Scholar]
- Thorne, K. S., & Zytkow, A. N. 1975, ApJ, 199, L19 [NASA ADS] [CrossRef] [Google Scholar]
- Thorne, K. S., & Zytkow, A. N. 1977, ApJ, 212, 832 [NASA ADS] [CrossRef] [EDP Sciences] [Google Scholar]
- Thorsett, S. E., & Chakrabarty, D. 1999, ApJ, 512, 288 [NASA ADS] [CrossRef] [Google Scholar]
- Toalá, J. A., Oskinova, L. M., Hamann, W.-R., et al. 2018, ApJ, 869, L11 [NASA ADS] [CrossRef] [Google Scholar]
- Todt, H., Sander, A., Hainich, R., et al. 2015, A&A, 579, A75 [NASA ADS] [CrossRef] [EDP Sciences] [Google Scholar]
- Torrejón, J. M., Reig, P., Fürst, F., et al. 2018, MNRAS, 479, 3366 [NASA ADS] [CrossRef] [Google Scholar]
- Vanbeveren, D., & De Loore, C. 1994, A&A, 290, 129 [NASA ADS] [Google Scholar]
- van den Heuvel, E. P. J., Portegies Zwart, S. F., & de Mink, S. E. 2017, MNRAS, 471, 4256 [NASA ADS] [CrossRef] [Google Scholar]
- van Loon, J. T., Kaper, L., & Hammerschlag-Hensberge, G. 2001, A&A, 375, 498 [NASA ADS] [CrossRef] [EDP Sciences] [Google Scholar]
- Verner, D. A., Ferland, G. J., Korista, K. T., & Yakovlev, D. G. 1996, ApJ, 465, 487 [NASA ADS] [CrossRef] [Google Scholar]
- Walter, R., Lutovinov, A. A., Bozzo, E., & Tsygankov, S. S. 2015, A&ARv, 23, 2 [NASA ADS] [CrossRef] [Google Scholar]
- Wang, Y.-M. 1981, A&A, 102, 36 [NASA ADS] [Google Scholar]
- Waters, L. B. F. M., de Martino, D., Habets, G. M. H. J., & Taylor, A. R. 1989, A&A, 223, 207 [NASA ADS] [Google Scholar]
- Wilms, J., Allen, A., & McCray, R. 2000, ApJ, 542, 914 [NASA ADS] [CrossRef] [Google Scholar]
- Woodgate, B. E., Kimble, R. A., Bowers, C. W., et al. 1998, PASP, 110, 1183 [NASA ADS] [CrossRef] [Google Scholar]
- Woosley, S. E. 2019, ApJ, 878, 49 [NASA ADS] [CrossRef] [Google Scholar]
- Woosley, S. E., & Heger, A. 2006, ApJ, 637, 914 [NASA ADS] [CrossRef] [Google Scholar]
- Woosley, S. E., & Heger, A. 2007, Phys. Rep., 442, 269 [NASA ADS] [CrossRef] [Google Scholar]
- Xu, W., & Stone, J. M. 2019, MNRAS, 488, 5162 [NASA ADS] [CrossRef] [Google Scholar]
- Yoon, S.-C., & Langer, N. 2005, A&A, 443, 643 [NASA ADS] [CrossRef] [EDP Sciences] [Google Scholar]
- Zacharias, N., Monet, D. G., Levine, S. E., et al. 2004, BAAS, 36, 1418 [Google Scholar]
All Tables
X-ray luminosities measured at times close to the HST observations (see text for details).
Empirical stellar parameters, compared to the best-fitting single-star evolution model as interpolated with the BONNSAI tool.
All Figures
|
Fig. 1 Comparison between two model spectra calculated for BD+60 73 to illustrate the effect of the X-rays (red: with X-rays, black: without X-rays). |
| In the text | |
|
Fig. 2 HD 153919: comparison between our HST spectrum and an averaged IUE spectrum constructed from data taken between 1978 and 1989.Upper panel: HST spectrum (blue dotted line) and IUE spectrum (green continuous line); lower panel: difference between the HST spectrum and the averaged IUE spectrum. |
| In the text | |
|
Fig. 3 Normalized line spectrum of HD 306414. The upper panel depicts a part of the UV spectrum, while the lower panel showsa section of the optical spectrum. The observation is shown in blue. The best fitting synthetic spectrum is overplotted by a dashed red line. |
| In the text | |
|
Fig. 4 Spectral energy distribution (SED) of HD 306414, composed of the flux calibrated HST spectrum (blue continuous line) and photometry (blue boxes, labeled with the corresponding magnitudes). The best fitting model SED is depicted by a dashedred line. The model flux is corrected for interstellar extinction and the geometric dilution according to the distance to HD 306414 (6.5 kpc). |
| In the text | |
|
Fig. 5 Modified wind momentum over the luminosity. The SFXTs and the persistent HMXBs are shown by green and red asterisks, respectively. In addition to the objects investigated in this work, we also show the results obtained by Martínez-Núñez et al. (2015) and Giménez-García et al. (2016). The dark blue triangles and light blue squares depict the analyses compiled by Mokiem et al. (2007) for O and B-type stars, respectively. |
| In the text | |
|
Fig. C.1 Spectral fit of HD 153919. The observations are shown as blue continuous lines (spectra) and blue boxes (photometry). The best fitting model is overplotted by a dashed red line. Note that the observed far UV spectrum (FUSE) is heavily contaminated by interstellar abortion lines, mostly originating from H2. |
| In the text | |
|
Fig. C.1 continued. |
| In the text | |
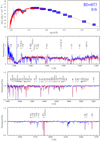 |
Fig. C.2 Same as Fig. C.1, but for BD+60 73. |
| In the text | |
|
Fig. C.3 BD+60 73: alternative UV-line fit (cf. Fig. C.2, second panel). For the model shown here, an approximately 70 times higher X-ray irradiation has been adopted, which brings the resonance doublets of N V λλ 1239, 1243 and C IVλλ 5801, 5812 to the observed strength (see text in Appendix B). |
| In the text | |
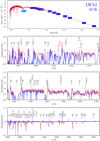 |
Fig. C.4 Same as Fig. C.1, but for LM Vel. |
| In the text | |
|
Fig. C.4 continued. |
| In the text | |
|
Fig. C.5 LM Vel: alternative UV-line fit (cf. Fig. C.4, second panel). For the model shown here, a roughly 300 times higher X-ray irradiation has been adopted, which brings the resonance doublet of N V λλ 1239, 1243 almost to the observed strength (see text in Appendix B). The remaining discrepancy is because of the C III line at 1245 Å (see Appendix B for details). |
| In the text | |
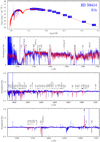 |
Fig. C.6 Same as Fig. C.1, but for HD 306414. |
| In the text | |
|
Fig. C.7 Same as Fig. C.1, but for BD+53 2790. The IR spectrum is clearly dominated by emission from the decretion disk. |
| In the text | |
|
Fig. C.7 continued. |
| In the text | |
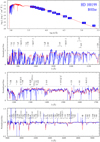 |
Fig. C.8 Same as Fig. C.1, but for HD 100199. |
| In the text | |
|
Fig. C.8 continued. |
| In the text | |
Current usage metrics show cumulative count of Article Views (full-text article views including HTML views, PDF and ePub downloads, according to the available data) and Abstracts Views on Vision4Press platform.
Data correspond to usage on the plateform after 2015. The current usage metrics is available 48-96 hours after online publication and is updated daily on week days.
Initial download of the metrics may take a while.