Free Access
Fig. C.1
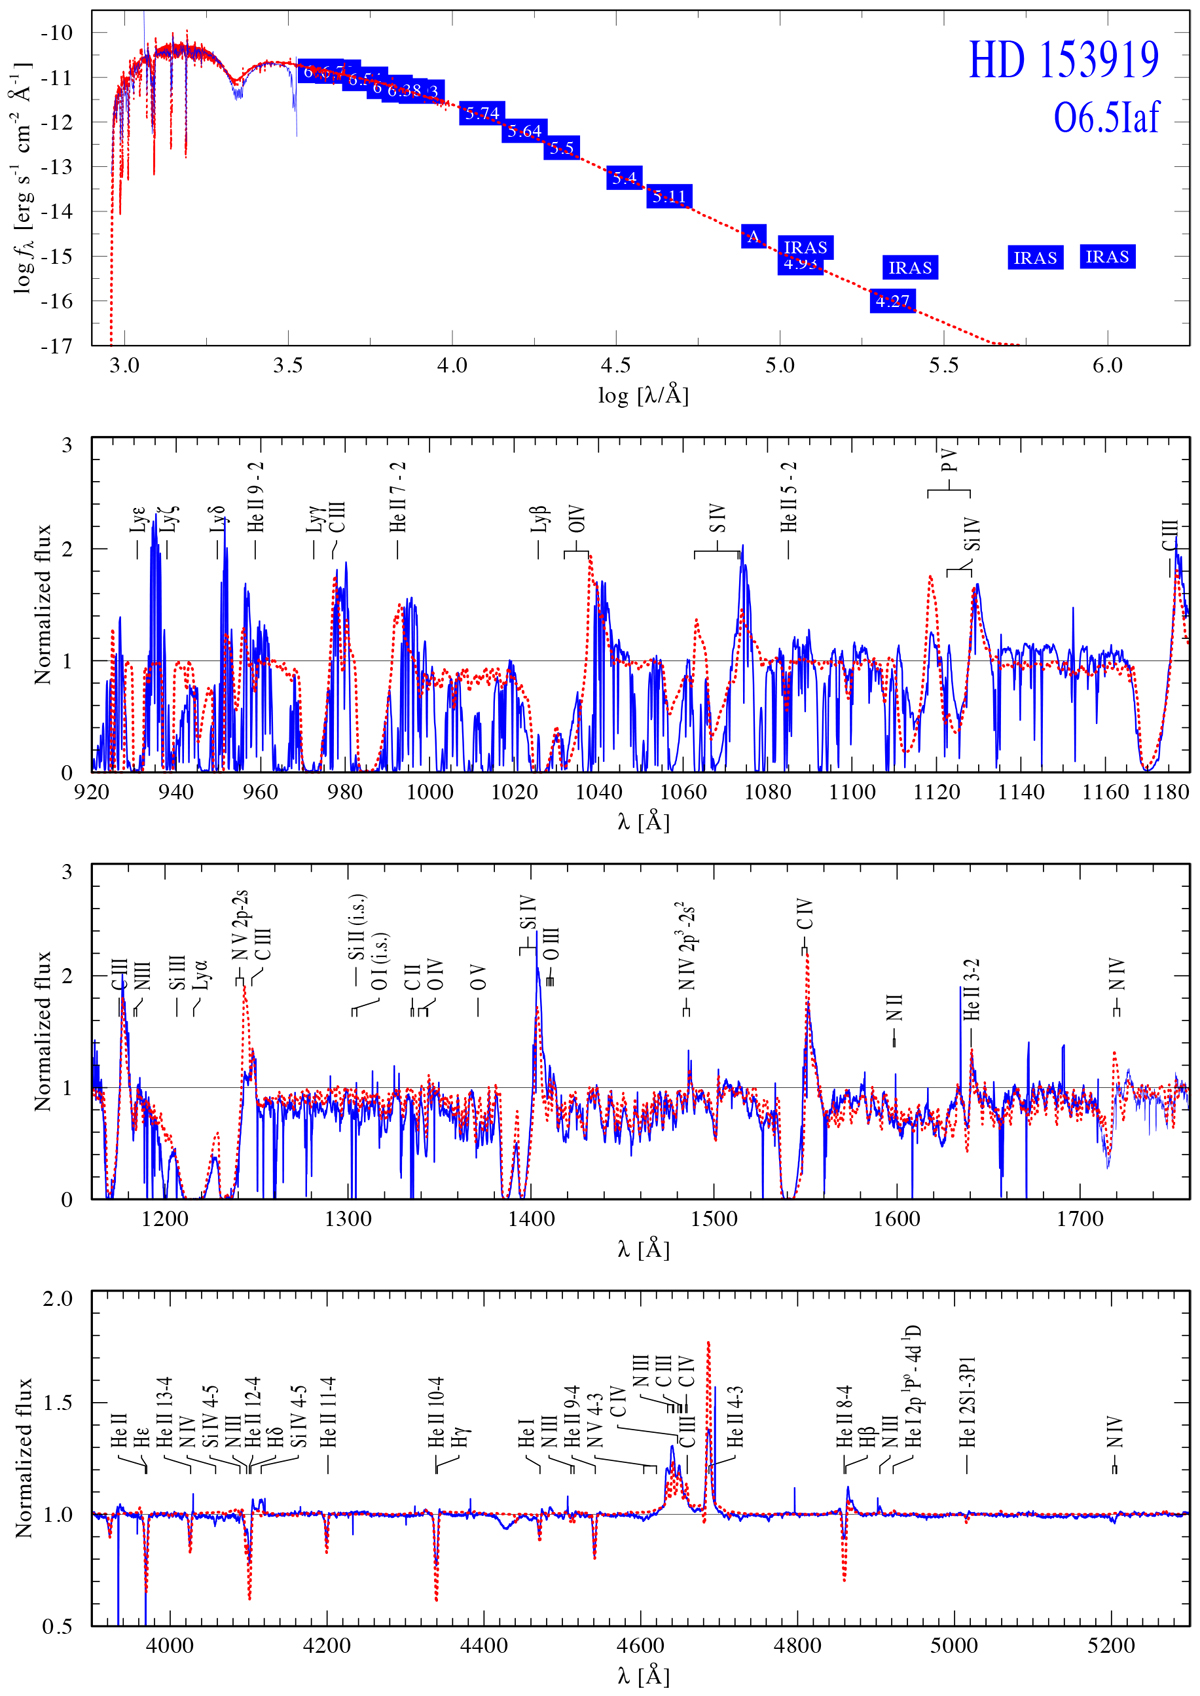
Spectral fit of HD 153919. The observations are shown as blue continuous lines (spectra) and blue boxes (photometry). The best fitting model is overplotted by a dashed red line. Note that the observed far UV spectrum (FUSE) is heavily contaminated by interstellar abortion lines, mostly originating from H2.
Current usage metrics show cumulative count of Article Views (full-text article views including HTML views, PDF and ePub downloads, according to the available data) and Abstracts Views on Vision4Press platform.
Data correspond to usage on the plateform after 2015. The current usage metrics is available 48-96 hours after online publication and is updated daily on week days.
Initial download of the metrics may take a while.