| Issue |
A&A
Volume 630, October 2019
Rosetta mission full comet phase results
|
|
|---|---|---|
| Article Number | A25 | |
| Number of page(s) | 13 | |
| Section | Planets and planetary systems | |
| DOI | https://doi.org/10.1051/0004-6361/201834912 | |
| Published online | 20 September 2019 | |
GIADA microbalance measurements on board Rosetta: submicrometer- to micrometer-sized dust particle flux in the coma of comet 67P/Churyumov-Gerasimenko
1
Institute of Astrophysics and Planetology (IAPS), INAF, via del Fosso del Cavaliere,
100, 00133 Roma, Italy
e-mail: vincenzo.dellacorte@iaps.inaf.it
2
Department of Sciences and Technologies, University of Naples Parthenope, CDN,
IC4, 80143 Napoli, Italy
3
Osservatorio Astronomico di Trieste, INAF,
via Tiepolo 11, 34143 Trieste, Italy
4
Italian Space Agency, ASI, via del Politecnico Roma, Italy
Received:
16
December
2018
Accepted:
14
June
2019
Context. From August 2014 to September 2016, Rosetta escorted comet 67P/Churyumov-Gerasimenko (67P) during its journey around the Sun. One of the aims of Rosetta was to characterize cometary activity and the consequent formation of dust flux structures in cometary comae.
Aims. We characterize and quantify the submicrometer- to micrometer-sized dust flux that may be shaped in privileged directions within the coma of 67P inbound to and outbound from perihelion.
Methods. The in situ dust-measuring instrument GIADA, part of the Rosetta/ESA payload, consisted of three subsystems, one of which was the Micro Balance Subsystem (MBS), composed of five quartz crystal microbalances. From May 2014 to September 2016, MBS measured the submicrometer- to micrometer-sized deposited dust mass every 5 min.
Results. We characterized the submicrometer- to micrometer-sized dust mass flux in the coma of 67P. The anti-sunward and the radial direction are preferred, and the flux is higher in the anti-sunward direction. The measured cumulative dust mass in the anti-sunward direction is 2.38 ± 0.04 × 10⁻⁷ kg, and in the radial direction, it is 1.18 ± 0.02 × 10⁻⁷ kg. We explain the anti-sunward dust flux as the effect of nonuniform gas emission between the night- and dayside of the nucleus, which acts in combination with the solar radiation pressure. We compared the cumulated dust mass of particles ≤5 μm with particles ≥100 μm. The retrieved ratio of ≈2% implies a differential size distribution index of ≈−3.0, which confirms that particles of size ≥0.1 mm dominate the dust coma cross-section of 67P during the entire orbit.
Conclusions. Submicrometer- to micrometer-sized dust mass flux measurements were made for the first time from the arising of cometary activity until its extinction. They indicate that these particles do not provide a substantial optical scattering in the coma of 67P with respect to the scattering caused by millimeter-sized particles. In addition, MBS data reveal that the measured dust flux is highly anisotropic: anti-sunward plus radial.
Key words: comets: individual: 67P/Churyumov Gerasimenko / methods: data analysis / space vehicles: instruments / comets: general / instrumentation: detectors
© ESO 2019
1 Introduction
After a ten-year cruise, the ESA/Rosetta spacecraft (S/C) reached comet 67P/Churyumov-Gerasimenko (hereafter 67P). Rosetta had the unique opportunity of following 67P for 2.5 yr, monitoring the increase in cometary activity toward perihelion, and the decrase after perihelion. The dust in the coma of 67P was measured by three in situ dust instruments: Cometary Secondary Ion Mass Analyser (COSIMA; Kissel et al. 2007; Merouane et al. 2016), Grain Impact Analyzer and Dust Accumulator (GIADA; Della Corte et al. 2014; Colangeli et al. 2007) and Micro-Imaging Dust Analysis System (MIDAS; Riedler et al. 2007; Bentley et al. 2016) as well as by other Rosetta instruments even if they were not specifically designed to study cometary dust (Blum et al. 2017). Of the three dust-measuring instruments, only MIDAS and one of the three GIADA subsystems, the Micro-Balance System (MBS; Palomba et al. 2002)were designed to study submicrometer- and micrometer-sized dust particles. MIDAS imaged dust particles, which in accordance with 81P/Wild2 particles that were collected by the Stardust/NASA probe (e.g., Rotundi et al. 2008, 2014) were found to be aggregates of micrometer-sized and submicrometer units (Bentley et al. 2016; Mannel et al. 2016). Only a few single component particles have been observed by MIDAS in this size range. Throughout the whole Rosetta mission, submicrometer grains seem to be underrepresented with respect to what was extrapolated from the dust size distribution determined by modeling applied to astronomical observations, limited to sizes >1 μm (Fulle et al. 2010). The only in situ measurements supporting the presence of submicrometer particles in comets are two data points provided by the Particulate Impact Analyzer (PIA) experiment at 1P/Halley flyby (McDonnell et al. 1991). Rotundi et al. (2015) found at the very beginning of the Rosetta mission that optical scattering of the dust of 67P is dominated by 0.1 mm to millimeter-sized grains, not by micrometer-sized ones. The analysis of thermal spectra of the 67P coma acquired by Visible and Infrared Thermal Imaging Spectrometer (VIRTIS) on board Rosetta constrained the minimum particle radius to be 10 μm (Bockelée-Morvan et al. 2017a,b). The analysis of a large ground-based image data set by Monte Carlo dust-tail modeling (Moreno et al. 2017) found a minimum particle size of 10 μm. Moreno et al. (2018) showed that the dust phase function determined from Optical, Spectrocopic and Infrared Remote Imaging System (OSIRIS) observations (Bertini et al. 2019) can be fit assuming that the main scatterers are ≥ 10 μm. MIDAS imaged the smallest particles, which provided high-resolution information on their morphology, but it did not provide quantitative information on the dust flux of submicrometer- to micrometer-sized particles. One of the three GIADA subsystems, MBS, was designed to measure the cumulative flux of particles smaller than 5 μm to complement cross-section, momentum, and speed measurements performed on individual particles of 60–800 μm that were made by the Grain Detection System (GDS; Epifani et al. 2002) and the Impact Sensor (IS; Esposito et al. 2002).
The MBS (Fig. 1) is a set of five quartz crystal microbalances (QCMs) pointing in different directions to characterize the dust flux in the half-space surrounding the +Z Rosetta spacecraft axis (nadir direction). Each QCM has an acceptance angle with a field of view (FOV) of about 40° and consists of a matched pair of quartz crystals that resonate at ~15 MHz. Each QCM is equipped with an external heater to (1) determine the dependence of frequency versus temperature, (2) perform thermo-gravimetric measurements on the accumulated dust at temperatures <100°C, and (3) remove the volatile component from the sensitive surface. The MBS was in measurement mode (frequency read every 300 s) for the entire scientific phase of the Rosetta mission (May 2014–September 2016), allowing a continuous monitoring of the submicrometer- to micrometer-sized dust particle flux. We here describe MBS measurements that were performed when Rosetta orbited the nucleus of 67P inbound to and outbound from perihelion. These direct in situ measurements allowed us to characterize the submicrometer- to micrometer-sized dust particle flux for the first time. Past cometary space missions were all in fast-flyby configurations, therefore they were unable to distinguish direct particles (particles coming radially from the nucleus) from those reflected back by solar radiation pressure, for instance (Fulle et al. 1995, 2000), which prevented them from defining a possible submicrometer-dust flux anisotropy.
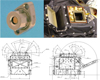 |
Fig. 1 MBS subsystem: one QCM-Research-MK21 sensor (top left); MBS subsystem mounted on GIADA integrated on board Rosetta (top right). Mechanical MBS configuration on GIADA. The QCMs FOV, 40° (bottom left), and the unobstructed FOV, 68° (bottom right) are highlighted. |
2 MBS geometry and QCM thermal behavior
The MBS subsystem was designed to monitor the submicrometer- to micrometer-sized dust flux in the half-space surroundingthe nadir-pointing direction. It consisted of five different QCMs pointing in five different directions (Glassmeier et al. 2007): QCM1 and QCM3 pointed in a direction parallel to the XZ spacecraft plane and had inclinations of +20° and +160°, respectively,from the +X spacecraft axis; QCM2 and QCM4 pointed parallel to the YZ spacecraft plane and had inclinations of +20° and +160°, respectively,from the +Y axis; and QCM5 pointed parallel to the +Z spacecraft axis (nadir direction). A small tube was mounted in front of each QCM that acted as a baffle and constrained the FOV to 40°. When Rosetta orbited in the terminator plane, that is, with a 90° orbit phase angle (Rosetta-comet-Sun), QCM1 collected dust with a relevant anti-sunward velocity component, that is, coming from the direction of the Sun. In the case of orbits with high phase angles, that is, >90°, QCM5 collected dust coming radially from the nucleus (direct) and from the direction of the Sun (reflected particles).
When we compare the different panels reported in Fig. 2, it is evident that each QCM had its own peculiar trend of the frequency readout with respect to temperature. This is due to the QCM working principle: the frequency readout is the difference between the main vibrating frequencies of the two quartz crystals constituting each QCM. As the main frequency of each crystal has its own specific thermal drift, the difference between the two main frequencies (QCM readout) does not show monotone trends with respect to the temperature. The temperature-frequency coupling can be minimized by (1) employing special crystal cuts, for example, the AT-cut; or (2) foreseeing a QCM temperature stabilization, which for GIADA/MBS was not foreseen. We therefore calibrated the QCM temperature drifts with a specific procedure: we used MBS active heatings that were telecommanded from ground, which sequentially heated each QCM up to about 70 °C (the exact value of the final temperature depended on the starting temperature). We analyzed the MBS data taking the QCM frequency versus temperature trends into account to distinguish the thermal drift from the dust accumulation. In addition to the thermal drift, we also took thermal hysteresis into account. Hysteresis is defined as the difference between the frequency versus temperature up-cycle and down-cycle, and it is quantified by the maximum difference determined over at least one complete quasi-static temperature cycle (Filler 1990). The trends of frequency versus temperature of crystal oscillator vary for different temperature cycles (Kusters & Vig 1990; Battaglia et al. 2004). In Fig. 2 we plot the frequency versus temperature for the five QCMs, and as an example, a QCM5 thermal hysteresis cycle. The data shown in the plot were obtained by a MBS active heating tele-commanded from ground, followed by a spontaneous cooling. Figure 2 shows that when the temperature returned to the initial value, the frequency read was different from its starting value. MBS thermal drift and thermal hysteresis are induced by (1) MBS active heating and (2) GIADA temperature fluctuations induced by the S/C attitude variations. We specify here that GIADA/QCMs wide thermal excursions experienced during the Rosetta scientific phase are not due to direct sunlight exposure, which was always prevented by payload safety rules: S/C pointing was limited to avoid direct sunlight in the GIADA FOV. Thermal excursions due to S/C attitude variations were limited to few °C (Fig. 3 bottom right panel).
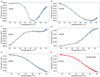 |
Fig. 2 Panels a–e: frequency vs. temperature correlation plots for the five QCMs, retrieved during a commanded MBS active heatings. Panel f: QCM5 thermal cycle reported as an example of the thermal hysteresis. Red dots correspond to the frequency vs. temperature data measured for QCM5 during the MBS active heating; blue dots are the data corresponding to the subsequent QCM5 passive cooling. Comparing the different panels it is evident that QCMs do not have monotonic trends and that each QCM has a specific behavior with respect to temperature variations. |
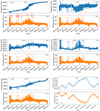 |
Fig. 3 MBS data, frequencies, and temperatures for each QCM, collected during the entire Rosetta mission, 6 August 2014–30 September 2016. QCM1 and QCM5 show a significant frequency increase. MBS active heatings are highlighted as an example for QCM1 raw data by red arrows (upper left panel). These telecommanded temperature variations can also be easily recognized in the other plots. In the bottom right panel we report the thermal behavior of QCM1 over 24 h in response to the variable S/C pointing, which induces temperature variations of only a few degrees. |
3 MBS data sets
The MBS continuously monitored the mass accumulation of submicrometer- to micrometer-sized dust particles from May 2014 until the end of the Rosetta mission (30 September 2016), with readouts every 300 s. During the first four months (from May to August 2014), the five QCMs composing the MBS did not measure any frequency shift, that is, dust mass deposition. This was in line with the expectations because of the large distance from the comet and the low cometary activity. Significant frequency variations started after Rosetta S/C insertion in 67P orbit, that is, after August 2014. In order to monitor how the submicrometer- to micrometer-sized dust flux varies inbound to and outbound from perihelion and to identify the main parameters that influence the fine dust coma environment, we analyzed the QCM frequency trends during the entire Rosetta scientific phase (Fig. 3).
The frequency variation is proportional to the dust mass accumulated on the QCM by a factor linked to its sensitive area and to the natural vibrating frequency of its two quartz crystals. For the GIADA/MBS QCMs, this factor is 5.09 × 10⁸ (Hz∕gm)cm2 and the sensitive area is 0.1 cm2. The value of the QCM starting frequencies (unloaded quartz crystals) depends on the small difference in the proper vibrating frequency of their crystals. To overcome QCM thermal issues (thermal hysteresis and thermal drift), we filtered the data for each QCM by selecting the readouts performed within a small temperature range around the most frequent temperature (Table 1). This procedure restricted the analysis to the “isotherm data” subset. The procedure we applied to retrieve isotherm data for each QCM over the entire Rosetta mission is the following: (1) we generated temperature-reading histograms; (2) we determined the most frequent temperature, that is, the most populated temperature bin of the histogram; and (3) we selected isotherm data, that is, the frequency readouts obtained within a temperature range with a maximum deviation of 0.75 °C from the most frequent temperature. While thermal drift is almost completely removed by this procedure, thermal hysteresis is still present because filtering does not take into account the thermal history of the QCMs. We interpolated isotherm data (Fig. 4) with the two-fold aim to mitigate thermal hysteresis and to obtain measurements of the time derivative, which is directly connected to the cometary dust flux. In order to estimate the dust mass and flux trends, a spline fit was applied to the isotherm data. This fitting method allowed us to evaluate the effects on dust accumulation of the operational observing parameters such as comet-S/C distance and orbit phase angle, notwithstanding the large temporal intervals (months). The spline-fitting algorithm uses a least-squares regression method that imposes an overall error limit that prevents data overfitting. The overall sum of the residuals squared is 2 × 10⁻¹³ kg for a total mass increase of 2.5 × 10⁻⁷ kg. We performed the isotherm analysis to obtain the complete frame of dust mass deposition from different directions over the entire data set (2014–2016), determining a most frequent temperature for each of the five QCMs. This analysis showed that only QCM1 and QCM5 registered a significant increase in deposited mass (Fig. 4). We thus focused on QCM1 and QCM5 data for a more accurate analysis. Considering isotherm data relative to the entire Rosetta scientific phase, it is not possible to unambiguously infer how dust flux changes along the comet orbit and determine the parameters that have the greates effect on it (Fig. 4). The QCM temperatures slightly varied during the scientific phase also because the thermal conditions of the spacecraft varied (Fig. 3). To take into account temperature variations and maximize the number of isotherm data, we divided the whole data set into six mission periods. These are the same periods as were defined by Della Corte et al. (2016) and Fulle et al. (2016) for investigating dust spatial distribution and production rate of particles >100 micrometers. These periods are characterized by homogeneous observation conditions, for instance, comet-S/C distance and heliocentric distance, hence homogeneous S/C and MBS temperatures. For each of these periods we determined six different most frequent temperatures (one for each of the six periods), then we applied the filtering procedure on the raw data so as to identify isotherm data subsets (Table 2).
Most frequently registered temperatures of the QCMs.
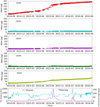 |
Fig. 4 Cumulated mass deposited on the QCMs retrieved after the isotherm filtering, i.e., on selected data points that were acquired when the QCM is at its most frequent temperature +/−0.75 °C. Cumulated masses are fitted by continuous spline curves. The curves show a relevant mass deposition increase on QCM1 and QCM5, in particular around perihelion of 67P (13 August 2015). No dust mass increase is detected byQCM2 and QCM4, while a slight increase in QCM3 is limited to perihelion. In the bottom panel we report the variation of the S/C distance from the comet and the phase angle (spacecraft-comet-Sun) that could influence the dust flux. No clear correlation is visible. A dust flux increase is visible for QCM5 at the end of the mission, which is associated with the outburst that occurred on 5 September 2016, when the S/C was at about 5 km from the nucleus surface of 67P. |
Rosetta mission reference periods for the detailed data analysis of the QCMs.
4 Results and discussion
To determine a possible correlation between submicrometer- to micrometer-sized and >100 μm particle dust mass flux, we compared cumulated mass plots of QCM1 and QCM5 (starting from the top, they are shown in the first two panels in Fig. 5) with the GDS-only cumulative detections (third panel from the top in Fig. 5) and the cumulated dust mass of the particles detected by the GDS-IS (bottom panel in Fig. 5). The comparison suggests that the submicrometer- to micrometer-sized particle fluxes are not correlated in time with the flux of particles >100 μm. Only duringthe outburst on 5 September 2016 did GIADA observe a very good correlation among all the particle sizes and types coming from nadir direction (the QCM5 and GDS-IS FOVs and lines of sight are similar). The step in GDS-IS cumulated mass and GDS-only counts, highlighted with a blue circle in Fig. 5, corresponds to a QCM5 mass increase, indicating a radial dust flux from the nucleus for all particle sizes. This single-point correlation can be due to the very small detection distance from the comet surface (about 5 km, which is closer than ever reached before during the Rosetta mission): particles of various sizes after ejection from the same nucleus area start moving with similar trajectories, and with the increase in S/C-comet distance, they then deviate from the radial trajectory. This is probably the case for the other two outbursts, which are indicated by black and red arrows in Fig. 5, which occurred at larger S/C-comet distances (Grün et al. 2016; Agarwal et al. 2017). In order to extend the size distribution found by Rotundi et al. (2015) and Fulle et al. (2016) to submicrometer- and micrometer-sized particles, we compared the cumulated mass measured by QCM5 (particles ≤ 5 μm) and by GDS-IS (particles ≥ 100 μm), taking the different sensitive areas of the devices into account (Fig. 5). The ratio between the total rescaled QCM5 and GDS-IS dust masses is about 2%, implying a differential size distribution with an index of ≈−3.0. This value is in good agreement with the particle size distribution observed when 67P was at 3.6 au by Rotundi et al. (2015). It is shallower than the index −3.6, on the other hand, which was observed at sizes ≥0.1 mm when 67P was between 2.2 and 1.3 au (perihelion) (Fulle et al. 2016), suggesting that the dust coma of 67P is always dominated in cross section by dust ≥ 0.1 mm.
For each of the six selected periods reported in Table 2, the submicrometer and micrometer cumulated dust mass and fluxes measured by QCM1 and QCM5 are reported in Figs. 6–8 together with the S/C-nucleus center distance and the phase angle. During prelanding and bound orbits, when Rosetta flew along terminator orbits at distances of 100–10 km from the nucleus, the dust mass flux of QCM1 was strongly correlated with the phase angle (Fig. 6). In this flying configuration, QCM1 pointed toward the Sun and measured an almost constant mass flux since September 2014, regardless of the S/C-nucleus distance. On QCM5 dust deposited with a lower rate. Only after October 2014 was a significant dust flux increase registered. The correlation between the flux measured by QCM1 and the phase angle is quite evident during the flybys period: after a short time at a phase angle of about 90°, Rosetta flew at small phase angles when QCM1, not pointing in the sunward direction, measured a flux decrease (Fig. 6). At the end of this period, the phase angle again increased up to 90° and the mass flux measured by QCM1 increased accordingly. For QCM5 (pointing nadir), the dust flux seems to be anticorrelated with respectto the distance from the nucleus, but the flux variation is small and probably linked to the specific areas of the nucleus thatwas flown over by Rosetta. As shown by Della Corte et al. (2016) and Longobardo et al. (2019), during this period, dust ejection was connected to specific areas in the nucleus northern hemisphere. The correlation between the QCM1 dust mass flux and theorbit phase angle also continues in the following period, that is, April–May (post 2015 equinox) when the S/C-nucleusdistance was much larger and QCM1 and QCM5 measured a lower dust flux (Fig. 7) even though 67P approached perihelion. The QCM5 dust flux remained almost constant and was influenced only by the S/C-nucleusdistance. During April–May 2015, Rosetta flew over both hemispheres of 67P, and while the dust flux of particles >100 μm moved fromthe northern to the southern hemisphere (Della Corte et al. 2016), no submicrometer- to micrometer-sized dust flux variation was registered by the QCMs. During the perihelion period, the dust flux on QCM5 and QCM1 increased even thought the S/C-comet distance increased, and for QCM1, a correlation with the phase angle is still evident (Fig. 7). During the dayside far excursion, performed at the end of the perihelion period, QCM5 registered a null dust flux, whereas QCM1, after a dust flux decrease due mostly to phase angle decrease, observed a flux increase at the end of the period. During perihelion, the S/C-nucleus distance was always >200 km, and because of the large FOV, QCM5 collected dust that did not necessarily come from the radial direction: at high phase angle (≥100°), QCM5 could collect dust that may also have come from the sunward direction. During the post-perihelion period, MBS did not change its response: the link between the orbit phase angle and the dust flux on QCM1 is evident (Fig. 8). Even if the S/C-nucleus distance decreased, QCM5 did not register any significant dust flux increase. During the end-of-mission period (Fig. 8), after the far excursion in the nightside, Rosetta rapidly approached the nucleus os 67P at small distances, orbiting down to about 2 km from the surface. GIADA continuously monitored the dust environment until Rosetta landed on the nucleus, on 30 September 2016. In this period, even though the S/C-nucleus distance drastically changed, that is, from hundreds of kilometers to ≤10 km, the flux did not increase (Fig. 8). This is a sign of the dropping in cometary activity, except for a final snap dust event. On 5 September 2016, when the S/C was at less than 10 km from the surface of 67P, a very intense dust event occurred that was also detected by other Rosetta instruments (e.g., OSIRIS) and by the star tracker. This peculiar event induced a strong discontinuity in the QCM5 dust mass measurement, reflecting the impulsive nature of the dust flux increase, which cannot be fit by spline interpolation. When we focus on short periods, specific dust flux trends with respect to observation parameters that are normally hidden in the global MBS plot (Fig. 4) become visible. The parameter that mostly influences the dust flux is the S/C-nucleus distance.
During the scientific phase (2014–2016), Rosetta flew mainly along terminator orbits (phase angle about 90°, see Fig. 4) pointing nadir. This implies that the MBS sensors had for most of the time the following observation configuration: QCM5 pointing nadir, QCM1 pointing roughly sunward, QCM2 pointing roughly to the nightside of the 67P nucleus, and QCM3 and QCM4 pointing in the S/C speed direction (RAM and anti-RAM). Because of the low S/C speed (less than 2 m s−1), we did not expect in the described observation geometry a dust accumulation on QCM3 and QCM4: the angle between theradial dust speed and the lines of sight of these QCMs is larger than their FOV. QCM2 pointed mainly toward the nightside where no dust flux was expected. A dust-flux measurement was only expected from QCM5 (direct dust trajectories from the nucleus) and QCM1 (solar radiation pressure deflecting back toward the S/C submicrometer- and micrometer-sized dust ejected from the illuminated portion of the nucleus). Using the simple approximation of the dusty-gas coma (see Zakharov et al. 2018), we can estimate the apex for the trajectories of the dust ejected toward the Sun. The submicrometer particles have these characteristic parameters for 67P: Iv ~ 10−2, Fu ~10−7, and Ro ~10−4 (their definition is given in Zakharov et al. 2018), which means that the turning point is at about one hundred nucleus radii.
In addition to solar radiation pressure, two other possible processes can contribute to the dust deviation from the radial direction: the gas pressure nonuniformity between the nightside and dayside of the nucleus, and electrostaticeffects induced by the S/C. We first note that for the nonuniformity, only perfectly spherical gas expansion has purely radial velocity vectors. In a cometary atmosphere, the gas production on the day- and nightside (Qday and Qnight) is different because the sides are illuminated differently by the Sun. The gas production (and consequently, the gas pressure) on the dayside is stronger than on the nightside, therefore a portion of the dayside gas flow deviates from the radial direction to the nightside. The strength of this process depends on the night- to dayside gas production ratio Qnight∕Qday and increases when this ratio decreases. Figure 9 shows the example of two cases of nightside activity. In case of a strongly active nightside, the gas flow-lines and the trajectories of the dust entrained by it are close to radial (Fig. 9, left panel). In case of low nightside activity, the gas produced on the dayside rapidly turns to the nightside (Fig. 9, right panel). Figure 9 shows that the dust ejected over 70° (counted counterclockwise) crosses the terminator plane, that is, has a notable anti-sunward velocity component. When dust particles increase the distance from the comet, their trajectories tend to the radial direction (assuming the influence of solar radiation pressure as negligible). The examples presented in Fig. 9 are similar (we adapted the size and production rate) to the cases studied by Lukyanov et al. (2006) and Crifo et al. (2005). With regard to possible electrostatic processes influencing the submicrometer dust-flux direction, we simulated the dust particles motion in the Rosetta S/C electrostatic field, assuming a very simplified geometry (the parameters of our simulations are reported in Table 3). Figure 10 shows that the electrostaticfield may change the particle trajectories considerably, but only for a very narrow range of particle parameters (size, mass, incoming velocity, and charge). The ratio of the particle charge to its kinetic energy entering in the electrostatic field, q∕Ek, shows that if q∕Ek > 2.45 C J−1, then the particle will not reach the S/C (it would be repulsed), and if q∕Ek < 2.25 C J−1, then the trajectories are practically rectilinear (at collision with the S/C). The transition from rectilinear to repulsed trajectories occurs for a q∕Ek variation within 10%. However, electrostatic forces cannot be responsible for the higher dust accumulation on QCM1 as particles undergoing electric repulsion are decelerated, but they maintain their original incoming direction. The two most plausible processes inducing a dust speed anti-sunward component are the solar radiation pressure and the gas pressure nonuniformity. These two processes probably act simultaneously in different proportions depending on the comet distance. As a future step of our work, we will apply 3D+t models, under development within the GIADA team, to evaluate the weights of the identified processes inducing the anti-sunward dust-mass flux measured by MBS. 3D+t modeling will also help in understanding the enhanced anti-sunward dust flux with respectto the radial dust flux. As a possible preliminary explanation, we consider that the dust flux coming from the radial direction, composed of dust ejected from the areas that were flown over, was likely measured in nearly real time by QCM5. In contrast, the dust-mass flux measured by QCM1 includes particles that were deflected to the anti-sunward direction that are ejected at different times and from different areas of the nucleus.
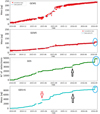 |
Fig. 5 From top: submicrometer- and micrometer-sized cumulated mass measured by QCM1 and QCM5 (first two panels; GIADA/GDS-only cumulative detections of particles >100 μm (third panel); cumulated mass of particles > 100 micrometers, measured by the GDS and IS GIADA subsystems (bottom panel). We highlight the dust event on 5 September 2016 with blue circles. This event was registered by all the GIADAsensors pointing nadir, i.e., QCM5, GDS, and IS, because the S/C-nucleus distance was short (about 5 km). Conversely, the outburst on 19 February 2016 (Grün et al. 2016) was registered only by GDS and IS (see black arrows in the two bottom panels), but not by QCM5 because the S/C was at 30 km from the nucleus, i.e., submicrometer- and micrometer-sized particles were already dispersed with respect to those >100 μm. In thebottom panel another outburst is visible (red arrow). This occurred on 3 July 2015 (Agarwal et al. 2017). In this case, the S/C-comet distance was about 200 km, thus QCM5 did not detect a contemporaneous dust mass increase for submicrometer- and micrometer-sized particles. The cumulative mass of particles >100 μm (bottom panel) is rescaled to the QCM sensitive area. |
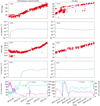 |
Fig. 6 Submicrometer- and micrometer-sized cumulated dust mass and fluxes measured by QCM1 and QCM5 during pre-landing (left column) and flyby (right column). The sparse isolated data points are due to the thermal history of the QCMs (hysteresis). The fitting algorithm assigns a low weight to these stragglers. |
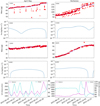 |
Fig. 7 Submicrometer- and micrometer-sized cumulated dust mass and fluxes measured by QCM1 and QCM5 during April-May 2015 (left column) and perihelion (right column). The sparse isolated data points are due to the thermal history of the QCMs (hysteresis). The fitting algorithm assigns a low weight to these stragglers. |
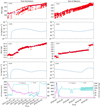 |
Fig. 8 Submicrometer- and micrometer-sized cumulated dust mass and fluxes measured by QCM1 and QCM5 during post perihelion (left column) and end of mission (right column). The sparse isolated data points are due to the thermal history of the QCMs (hysteresis). The fitting algorithm assigns a low weight to these stragglers. |
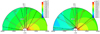 |
Fig. 9 Examples of gas density distribution and dust particle trajectories for two cases of nightside activity: high (left) and weak (right). The gas flow-lines are shown in black, the trajectories of the 9.1 μm and 62 nm dust particles are shown by red solid and magenta dash-dot lines, respectively. The trajectory origins are indicated by the angles. |
Transition from dust particle collision to repulsion.
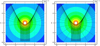 |
Fig. 10 Example of dust trajectories (particle size 0.1 μm, specific density 103 kg m−3, entrance velocity 93.0 m s−1) in the electrostatic field of the Rosetta spacecraft. Left panel: case q∕Ek = 0.230 C J−1 (the particle charge is q = 4.172e–15 C). Right panel: case q∕Ek = 0.246 C J−1 (the particle charge is q = 4.450e–15 C). |
5 Conclusions
One of the three GIADA subsystems, the MBS continuously monitored the dust fluxes of submicrometer- to micrometer-sized particles from May 2014 until the end of September 2016, when the Rosetta spacecraft landed on 67P nucleus. The results of these in situ measurements lead us to conclude that the dust flux of the submicrometer- to micrometer-sized particles are:
- 1.
follows a size distribution with a differential index of −3.
- 2.
is higherin the anti-sunward than in the radial direction.
The first result confirms a conclusion that was also drawn based on data collected by other Rosetta instruments, such as MIDAS, OSIRIS, and VIRTIS. The second result extends GIADA results that were obtained at the very beginning of the Rosetta mission (Della Corte et al. 2015) to the entire active period of 67P inbound to and outbound from perihelion. Three possible explanations have been considered for the anti-sunward component of the dust flux.
-
Electrostatic interactions between the charged S/C and dust particles.
-
Gas drag driven by a different gas pressure on the dayside and nightside at terminator, induced by temperature excursion.
-
Solar radiation pressure reflecting the ejected particles in the anti-sunward direction, possibly also at different times, from theilluminated regions of the nucleus.
After first-order simulations and analysis of the processes considered above, we conclude the following:
- 1.
The transition from radial to electrically repulsed trajectories occurs only for a very narrow range of particle parameters (variation within 10% of the ratio of the particle charge over its kinetic energy). In addition, charged dust was simply deflected away from the S/C, or decelerated before impacting GIADA, maintaining its original direction. Hence the Rosetta electrostatic field cannot be responsible for the broad dust flux in the anti-sunward direction.
- 2.
The combination of two processes, that is, solar radiation pressure and gas drag at terminator, could be responsible for an anti-sunward dust flux. They would act in different proportions, depending on the distance from the nucleus. This would explain the anti-sunward dust flux close to and far from 67P nucleus.
- 3.
From 2014 to 2016, Rosetta escorted comet 67P mainly on terminator orbits. The anti-sunward dust flux measured by GIADA/MBS is higher than the radial flux. The anti-sunward dust flux probably results from particles that were ejected at different times from well-illuminated regions. Conversely, the radial flux could correspond to dust ejected specifically from less active terminator areas in real time during the passage of the spacecraft.
The next step of this work will couple GIADA/MBS measurements with the 3D+t coma model that is being developed within the GIADA team.
Acknowledgements
GIADA was built by a consortium led by the Universitá degli Studi di Napoli “Parthenope” and INAF – Osservatorio Astronomico di Capodimonte, in collaboration with the Instituto de Astrofisica de Andalucia, Selex-ES, FI, and SENER. GIADA is presently managed and operated by Istituto di Astrofisica e Planetologia Spaziali – INAF, Italy. GIADA was funded and managed by the Agenzia Spaziale Italiana, with the support of the Spanish Ministry of Education and Science Ministerio de Educacion y Ciencias (MEC). GIADA was developed from a Principal Investigator proposal from the University of Kent; science and technology contributions were provided by CISAS, Italy; Laboratoire d’Astrophysique Spatiale, France, and institutions from the UK, Italy, France, Germany, and the USA. Science support was provided by NASA through the US Rosetta Project managed by the Jet Propulsion Laboratory/California Institute of Technology. We would like to thank A. Coradini for her contribution as a GIADA Co-Investigator. GIADA calibrated data will be available through ESA’s Planetary Science Archive (PSA) Web site (www.rssd.esa.int/index.php?project=PSA&page=index). All data presented here are available on request before archival in the PSA. This work was also supported by PNRA16-00029 and PRIN2015-20158W4JZ7. The authors thank the referee for very constructive comments that contributed to improve our paper.
References
- Agarwal, J., Della Corte, V., Feldman, P. D., et al. 2017, MNRAS, 469, s606 [NASA ADS] [CrossRef] [Google Scholar]
- Battaglia, R., Palomba, E., Palumbo, P., Colangeli, L., & Corte, V. D. 2004, Adv. Space Res., 33, 2258 [NASA ADS] [CrossRef] [Google Scholar]
- Bentley, M. S., Schmied, R., Mannel, T., et al. 2016, Nature, 537, 73 [NASA ADS] [CrossRef] [Google Scholar]
- Bertini, I., La Forgia, F., Fulle, M., et al. 2019, MNRAS, 482, 2924 [Google Scholar]
- Blum, J., Gundlach, B., Krause, M., et al. 2017, MNRAS, 469, S755 [CrossRef] [Google Scholar]
- Bockelée-Morvan, D., Rinaldi, G., Erard, S., et al. 2017a, MNRAS, 469, S842 [CrossRef] [Google Scholar]
- Bockelée-Morvan, D., Rinaldi, G., Erard, S., et al. 2017b, MNRAS, 469, S443 [CrossRef] [Google Scholar]
- Colangeli, L., Lopez-Moreno, J. J., Palumbo, P., et al. 2007, Space Sci. Rev., 128, 803 [NASA ADS] [CrossRef] [Google Scholar]
- Crifo, J. F., Loukianov, G. A., Rodionov, A. V., & Zakharov, V. V. 2005, Icarus, 176, 192 [NASA ADS] [CrossRef] [Google Scholar]
- Della Corte, V., Rotundi, A., Accolla, M., et al. 2014, J. Astron. Instrum., 3, 1350011 [NASA ADS] [CrossRef] [Google Scholar]
- Della Corte, V., Rotundi, A., Fulle, M., et al. 2015, A&A, 583, A13 [NASA ADS] [CrossRef] [EDP Sciences] [Google Scholar]
- Della Corte, V., Rotundi, A., Fulle, M., et al. 2016, MNRAS, 462, S210 [CrossRef] [Google Scholar]
- Epifani, E. M., Bussoletti, E., Colangeli, L., et al. 2002, Adv. Space Res., 29, 1165 [NASA ADS] [CrossRef] [Google Scholar]
- Esposito, F., Colangeli, L., Della Corte, V., & Palumbo, P. 2002, Adv. Space Res., 29, 1159 [NASA ADS] [CrossRef] [Google Scholar]
- Filler, R. 1990, in Proc. the 44th Annual Symp. on Frequency Control, 176 [CrossRef] [Google Scholar]
- Fulle, M., Colangeli, L., Mennella, V., Rotundi, A., & Bussoletti, E. 1995, A&A, 304, 622 [NASA ADS] [Google Scholar]
- Fulle, M., Levasseur-Regourd, A. C., McBride, N., & Hadamcik, E. 2000, AJ, 119, 1968 [Google Scholar]
- Fulle, M., Colangeli, L., Agarwal, J., et al. 2010, A&A, 522, A63 [NASA ADS] [CrossRef] [EDP Sciences] [Google Scholar]
- Fulle, M., Marzari, F., Della Corte, V., et al. 2016, ApJ, 821, 19 [NASA ADS] [CrossRef] [Google Scholar]
- Glassmeier, K.-H., Boehnhardt, H., Koschny, D., Kührt, E., & Richter, I. 2007, Space Sci. Rev., 128, 1 [NASA ADS] [CrossRef] [Google Scholar]
- Grün, E., Agarwal, J., Altobelli, N., et al. 2016, MNRAS, 462, S220 [CrossRef] [Google Scholar]
- Kissel, J., Altwegg, K., Clark, B. C., et al. 2007, Space Sci. Rev., 128, 823 [NASA ADS] [CrossRef] [Google Scholar]
- Kusters, J., & Vig, J. 1990, in Proc. the 44th Annual Symp. on Frequency Control, 165 [CrossRef] [Google Scholar]
- Longobardo, A., Della Corte, V., Ivanovski, S., et al. 2019, MNRAS, 483, 2165 [NASA ADS] [CrossRef] [Google Scholar]
- Lukyanov, G. A., Crifo, J. F., Zakharov, V. V., & Rodionov, A. V. 2006, Adv. Space Res., 38, 1976 [NASA ADS] [CrossRef] [Google Scholar]
- Mannel, T., Bentley, M. S., Schmied, R., et al. 2016, MNRAS, 462, S304 [NASA ADS] [CrossRef] [Google Scholar]
- McDonnell, J. A. M., Lamy, P. L., & Pankiewicz, G. S. 1991, Astrophys. Space Sci. Lib., 167, 1043 [NASA ADS] [Google Scholar]
- Merouane, S., Zaprudin, B., Stenzel, O., et al. 2016, A&A, 596, A87 [NASA ADS] [CrossRef] [EDP Sciences] [Google Scholar]
- Moreno, F., Muñoz, O., Gutiérrez, P. J., et al. 2017, MNRAS, 469, S186 [CrossRef] [Google Scholar]
- Moreno, F., Guirado, D., Muñoz, O., et al. 2018, AJ, 156, 237 [NASA ADS] [CrossRef] [Google Scholar]
- Palomba, E., Colangeli, E. L., Palumbo, P., et al. 2002, Adv. Space Res., 29, 1155 [NASA ADS] [CrossRef] [Google Scholar]
- Riedler, W., Torkar, K., Jeszenszky, H., et al. 2007, Space Sci. Rev., 128, 869 [NASA ADS] [CrossRef] [Google Scholar]
- Rotundi, A., Baratta, G. A., Borg, J., et al. 2008, Meteorit. Planet. Sci., 43, 367 [Google Scholar]
- Rotundi, A., Rietmeijer, F. J. M., Ferrari, M., et al. 2014, Meteorit. Planet. Sci., 49, 550 [NASA ADS] [CrossRef] [Google Scholar]
- Rotundi, A., Sierks, H., Della Corte, V., et al. 2015, Science, 347, 3905 [Google Scholar]
- Zakharov, V. V., Ivanovski, S. L., Crifo, J.-F., et al. 2018, Icarus, 312, 121 [NASA ADS] [CrossRef] [Google Scholar]
All Tables
All Figures
|
Fig. 1 MBS subsystem: one QCM-Research-MK21 sensor (top left); MBS subsystem mounted on GIADA integrated on board Rosetta (top right). Mechanical MBS configuration on GIADA. The QCMs FOV, 40° (bottom left), and the unobstructed FOV, 68° (bottom right) are highlighted. |
| In the text | |
|
Fig. 2 Panels a–e: frequency vs. temperature correlation plots for the five QCMs, retrieved during a commanded MBS active heatings. Panel f: QCM5 thermal cycle reported as an example of the thermal hysteresis. Red dots correspond to the frequency vs. temperature data measured for QCM5 during the MBS active heating; blue dots are the data corresponding to the subsequent QCM5 passive cooling. Comparing the different panels it is evident that QCMs do not have monotonic trends and that each QCM has a specific behavior with respect to temperature variations. |
| In the text | |
|
Fig. 3 MBS data, frequencies, and temperatures for each QCM, collected during the entire Rosetta mission, 6 August 2014–30 September 2016. QCM1 and QCM5 show a significant frequency increase. MBS active heatings are highlighted as an example for QCM1 raw data by red arrows (upper left panel). These telecommanded temperature variations can also be easily recognized in the other plots. In the bottom right panel we report the thermal behavior of QCM1 over 24 h in response to the variable S/C pointing, which induces temperature variations of only a few degrees. |
| In the text | |
|
Fig. 4 Cumulated mass deposited on the QCMs retrieved after the isotherm filtering, i.e., on selected data points that were acquired when the QCM is at its most frequent temperature +/−0.75 °C. Cumulated masses are fitted by continuous spline curves. The curves show a relevant mass deposition increase on QCM1 and QCM5, in particular around perihelion of 67P (13 August 2015). No dust mass increase is detected byQCM2 and QCM4, while a slight increase in QCM3 is limited to perihelion. In the bottom panel we report the variation of the S/C distance from the comet and the phase angle (spacecraft-comet-Sun) that could influence the dust flux. No clear correlation is visible. A dust flux increase is visible for QCM5 at the end of the mission, which is associated with the outburst that occurred on 5 September 2016, when the S/C was at about 5 km from the nucleus surface of 67P. |
| In the text | |
|
Fig. 5 From top: submicrometer- and micrometer-sized cumulated mass measured by QCM1 and QCM5 (first two panels; GIADA/GDS-only cumulative detections of particles >100 μm (third panel); cumulated mass of particles > 100 micrometers, measured by the GDS and IS GIADA subsystems (bottom panel). We highlight the dust event on 5 September 2016 with blue circles. This event was registered by all the GIADAsensors pointing nadir, i.e., QCM5, GDS, and IS, because the S/C-nucleus distance was short (about 5 km). Conversely, the outburst on 19 February 2016 (Grün et al. 2016) was registered only by GDS and IS (see black arrows in the two bottom panels), but not by QCM5 because the S/C was at 30 km from the nucleus, i.e., submicrometer- and micrometer-sized particles were already dispersed with respect to those >100 μm. In thebottom panel another outburst is visible (red arrow). This occurred on 3 July 2015 (Agarwal et al. 2017). In this case, the S/C-comet distance was about 200 km, thus QCM5 did not detect a contemporaneous dust mass increase for submicrometer- and micrometer-sized particles. The cumulative mass of particles >100 μm (bottom panel) is rescaled to the QCM sensitive area. |
| In the text | |
|
Fig. 6 Submicrometer- and micrometer-sized cumulated dust mass and fluxes measured by QCM1 and QCM5 during pre-landing (left column) and flyby (right column). The sparse isolated data points are due to the thermal history of the QCMs (hysteresis). The fitting algorithm assigns a low weight to these stragglers. |
| In the text | |
|
Fig. 7 Submicrometer- and micrometer-sized cumulated dust mass and fluxes measured by QCM1 and QCM5 during April-May 2015 (left column) and perihelion (right column). The sparse isolated data points are due to the thermal history of the QCMs (hysteresis). The fitting algorithm assigns a low weight to these stragglers. |
| In the text | |
|
Fig. 8 Submicrometer- and micrometer-sized cumulated dust mass and fluxes measured by QCM1 and QCM5 during post perihelion (left column) and end of mission (right column). The sparse isolated data points are due to the thermal history of the QCMs (hysteresis). The fitting algorithm assigns a low weight to these stragglers. |
| In the text | |
|
Fig. 9 Examples of gas density distribution and dust particle trajectories for two cases of nightside activity: high (left) and weak (right). The gas flow-lines are shown in black, the trajectories of the 9.1 μm and 62 nm dust particles are shown by red solid and magenta dash-dot lines, respectively. The trajectory origins are indicated by the angles. |
| In the text | |
|
Fig. 10 Example of dust trajectories (particle size 0.1 μm, specific density 103 kg m−3, entrance velocity 93.0 m s−1) in the electrostatic field of the Rosetta spacecraft. Left panel: case q∕Ek = 0.230 C J−1 (the particle charge is q = 4.172e–15 C). Right panel: case q∕Ek = 0.246 C J−1 (the particle charge is q = 4.450e–15 C). |
| In the text | |
Current usage metrics show cumulative count of Article Views (full-text article views including HTML views, PDF and ePub downloads, according to the available data) and Abstracts Views on Vision4Press platform.
Data correspond to usage on the plateform after 2015. The current usage metrics is available 48-96 hours after online publication and is updated daily on week days.
Initial download of the metrics may take a while.