| Issue |
A&A
Volume 583, November 2015
Rosetta mission results pre-perihelion
|
|
|---|---|---|
| Article Number | A13 | |
| Number of page(s) | 10 | |
| Section | Planets and planetary systems | |
| DOI | https://doi.org/10.1051/0004-6361/201526208 | |
| Published online | 30 October 2015 | |
GIADA: shining a light on the monitoring of the comet dust production from the nucleus of 67P/Churyumov-Gerasimenko
1 Institute for Space Astrophysics and Planetology (IAPS), National Institute for AstroPhysics (INAF), via Fosso del Cavaliere 100, 00133 Roma, Italy
e-mail: This email address is being protected from spambots. You need JavaScript enabled to view it.
2 Università degli Studi di Napoli “Parthenope”, Dipartimento di Scienze e Tecnologie, CDN IC4, 80143 Naples, Italy
3 Osservatorio Astronomico di Trieste, INAF, via Tiepolo 11, 34143 Trieste, Italy
4 Max-Planck-Institut fuer Kernphysik, Saupfercheckweg 1, 69117 Heidelberg, Germany
5 Planetary Science Section, Jet Propulsion Laboratory, 4800 Oak Grove Drive, Pasadena, CA 91109, USA
6 Osservatorio Astronomico di Catania, INAF, via S. Sofia 78, 95123 Catania Italy
7 LESIA, Obs. de Paris, CNRS, Univ. Paris 06, Univ. Paris-Diderot, 5 place J. Janssen, 92195 Meudon, France
8 Osservatorio Astronomico di Capodimonte, INAF, Salita Moiariello 16, 80133 Naples, Italy
9 Osservatorio Astronomico di Roma, INAF, via di Frascati, 33, Monte Porzio Catone, Rome, Italy
10 Instituto de Astrofsica de Andalucia, Consejo Superior de Investigaciones Cientificas (CSIC), PO Box 3008, 18080 Granada, Spain
11 ESA, European Space Research and Technology Centre (ESTEC), Keplerlaan 1, 2201 AZ Noordwijk, The Netherlands
12 Laboratoire Atmosphères, Milieux, Observations Spatiales, CNRS/ Université de Versailles-Saint-Quentin-en-Yvelines/Institut Pierre-Simon Laplace, 11 boulevard d’Alembert, 78280 Guyancourt, France
13 Planetary and Space Sciences, Department of Physical Sciences, The Open University, Milton Keynes MK7 6AA, UK
14 Laboratoire d’Astrophysique de Marseille, UMR 7326, CNRS & Aix Marseille Université, 13388 Marseille Cedex 13, France
15 The University of Kent, Canterbury, Kent, CT2 7NZ, UK
16 UnispaceKent, Canterbury, Kent, CT2 8EF, UK
17 Departamento de Fisica Aplicada, Universidad de Granada, Facultad de Ciencias, Avda. Severo Ochoa, s/n, 18071, Granada, Spain
18 Observatoire de Haute Provence OSU Pythéas UMS 2244 CNRS-AMU, 04870 Saint-Michel l’Observatoire, France
19 Dept. of Earth and Planetary Science, MSC 03 2040, 1-University of New Mexico, Albuquerque, NM 87131-0001, USA
20 Centro de Astrobiologia (INTA-CSIC), 28691 Villanueva de la Canada, Madrid, Spain
21 International Space Science Institute, Hallerstrasse 6, 3012 Bern, Switzerland
22 Selex-ES, via A. Einstein, 35, 50013 − Campi Bisenzio (Firenze), Italy
23 Virginia Polytechnic Institute and State University, Blacksburg, VA 24061, USA
24 University of Florida, Gainesville, Florida, FL 32611, USA
25 ESA-ESAC, Camino Bajo del Castillo, s/n., Urb. Villafranca del Castillo, 28692 Villanueva de la Canada, Madrid, Spain
Received: 23 March 2015
Accepted: 23 July 2015
Abstract
Context. During the period between 15 September 2014 and 4 February 2015, the Rosetta spacecraft accomplished the circular orbit phase around the nucleus of comet 67P/Churyumov-Gerasimenko (67P). The Grain Impact Analyzer and Dust Accumulator (GIADA) onboard Rosetta monitored the 67P coma dust environment for the entire period.
Aims. We aim to describe the dust spatial distribution in the coma of comet 67P by means of in situ measurements. We determine dynamical and physical properties of cometary dust particles to support the study of the production process and dust environment modification.
Methods. We analyzed GIADA data with respect to the observation geometry and heliocentric distance to describe the coma dust spatial distribution of 67P, to monitor its activity, and to retrieve information on active areas present on its nucleus. We combined GIADA detection information with calibration activity to distinguish different types of particles that populate the coma of 67P: compact particles and fluffy porous aggregates. By means of particle dynamical parameters measured by GIADA, we studied the dust acceleration region.
Results. GIADA was able to distinguish different types of particles populating the coma of 67P: compact particles and fluffy porous aggregates. Most of the compact particle detections occurred at latitudes and longitudes where the spacecraft was in view of the comet’s neck region of the nucleus, the so-called Hapi region. This resulted in an oscillation of the compact particle abundance with respect to the spacecraft position and a global increase as the comet moved from 3.36 to 2.43 AU heliocentric distance. The speed of these particles, having masses from 10-10 to 10-7 kg, ranged from 0.3 to 12.2 m s-1. The variation of particle mass and speed distribution with respect to the distance from the nucleus gave indications of the dust acceleration region. The influence of solar radiation pressure on micron and submicron particles was studied. The integrated dust mass flux collected from the Sun direction, that is, particles reflected by solar radiation pressure, was three times higher than the flux coming directly from the comet nucleus. The awakening 67P comet shows a strong dust flux anisotropy, confirming what was suggested by on-ground dust coma observations performed in 2008.
Key words: comets: individual: 67P/Churyumov-Gerasimenko / methods: data analysis / space vehicles: instruments / comets: general / instrumentation: detectors
© ESO, 2015
 Open Access article, published by EDP Sciences, under the terms of the Creative Commons Attribution License (http://creativecommons.org/licenses/by/4.0),
which permits unrestricted use, distribution, and reproduction in any medium, provided the original work is properly cited.
Open Access article, published by EDP Sciences, under the terms of the Creative Commons Attribution License (http://creativecommons.org/licenses/by/4.0),
which permits unrestricted use, distribution, and reproduction in any medium, provided the original work is properly cited.
1. Introduction
Dust impact sensors collected data in the coma of 1P/Halley (McDonnell et al. 1990) and 26P/Grigg-Skjellerup (McDonnell et al. 1993) during the flybys of ESA’s Giotto spacecraft, 81P/Wild 2 (Green et al. 2004) by NASA’s Stardust probe, and 9P/Tempel 1 (Economou et al. 2013) by NASA’s Deep Impact spacecraft. These were all flybys with the spacecraft speed VSC ranging from 6 to 72 km s-1, that is, orders of magnitude higher than the dust speed in the coma. While it was possible to convert observed dust momenta into mass values, it was impossible to distinguish the dust particles coming directly from the nucleus (direct) with respect to those emitted toward the Sun and reflected back by solar radiation pressure (reflected). It was shown (Fulle et al. 1995, 2000) that in the case of a strong dust production anisotropy (much more dust emitted from the subsolar area than from terminator areas), the space density of direct and reflected particles might be similar. While direct particles are distributed over all size bins, the reflected ones tend to populate the largest size bins, building up an excess of millimeter and larger particles. The dust size distributions observed at the three above-mentioned comets during the flybys show the same large-particles excess. However, this might have no real counterpart in the dust size distribution produced at the nucleus surface, meaning that the large-particle excess may stem entirely from the reflected particles. Models of dust dynamics for cometary comae and tails predict a mm-sized excess for the size distribution of reflected dust particles, whereas no such excess is predicted in the size distribution of the direct particles.
ESA’s Rosetta comet rendezvous mission offers the first opportunity to overcome the problems described above. The spacecraft speed relative to the nucleus during most of the mission is slower than the dust speed. Thus 1) the dust speed can be directly measured by the Grain Impact Analyzer and Dust Accumulator (GIADA); and 2) GIADA pointing can distinguish between direct and reflected particles. Thanks to these capabilities, the dust flux per mass bin can be determined and provide the averaged dust mass distribution at the nucleus surface (Rotundi et al. 2015). The only limiting condition comes from the spacecraft orbit configuration: specific scientific objectives have to be achieved during specific trajectories. In the case of terminator orbits and a strong anisotropic dust emission, the received dust flux is not representative of the overall comet activity. The true dust mass-loss rate and size distributions can only be obtained by passing above the subsolar area. When the dust-loss rate ratio between subsolar and terminator areas remains roughly constant in time, it is possible to search for 1) high-rate dust emissions areas; 2) dust activity increases with decreasing heliocentric distances; and 3) the dust acceleration region. In this paper we show and discuss the results obtained by GIADA from mid-September 2014 to the beginning of February 2015.
2. GIADA instrument
GIADA onboard Rosetta was designed to determine the physical properties and the fluence of cometary dust (Della Corte et al. 2014; Colangeli et al. 2007). The information on single particles is derived by two subsystems mounted in cascade (Fig. 1): the Grain Detection System (GDS) and the Impact Sensor (IS). The GDS detects particles crossing a laser curtain 10 × 10 cm2 and 3 mm in thickness, starting a time of flight counter from the GDS to the IS, to retrieve the particle speed. The laser light scattered or reflected by the particle is detected by the photodiodes mounted at 90° with respect to the lasers, the amplitude of the signal is linked to the particle geometrical cross section (Mazzotta Epifani et al. 2002). The IS consists of a 0.5 mm thick aluminium square diaphragm (sensitive area of 100 cm2) equipped with five piezoelectric sensors (PZTs). When a particle impacts the sensing plate, the generated bending waves are detected by the PZTs, whose output is monotonically related to the particle momentum (Esposito et al. 2002). The coupled GDS + IS system, with a field of view of 37°, determines particle speed, momentum, and mass. In addition, GIADA data can constrain 1) the trajectory for each detected particle; 2) the particle size (equivalent diameter, i.e., the diameter of the circle with the same area as the particle geometrical cross-section); and 3) the particle density. The dust mass fluence is measured by the MicroBalance System (MBS), which is composed of five Quartz Crystal Microbalances (QCMs) mounted on the GIADA top plate around the entrance (Fig. 1). The QCMs, each with a field of view of 40°, characterize the dust flux within a solid angle of 180°. Each QCM is equipped with a pair of sensing quartz crystals. One crystal is exposed to dust deposition, while the second is used as a reference for the vibrating frequency. The addition or subtraction of small mass deposits on the exposed quartz crystal induces a change in the resonating frequency of the quartz crystal. The dust fluence is derived from the beat frequency of the two crystals: the output signal is proportional to the mass deposited on the QCM (Palomba et al. 2002). The sensitivities and the upper detection limits for each GIADA subsystem are reported in Fig. 1.
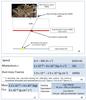 |
Fig. 1 GIADA working principle and measurable dust parameters. Panel a): block diagram displaying the GIADA subsystems and the path of the incoming dust particle. The bottom panels provide dust particle parameters directly measured by GIADA (panel b)), derived from the measurements (panel c)), and obtained after selecting specific calibration curves dependent on dust optical properties (panel d)). |
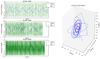 |
Fig. 2 Longitude and latitude covered along the bound orbits phase at 30, 20, and 10 km orbit radius (left panel) and Rosetta orbits reported in the 67P body-centered solar orbital (CSO) frame (right panel). The CSO frames for 67P are defined as follows: X-axis points from 67P to the Sun; the Y-axis is the component orthogonal to the X-axis of inertially referenced velocity of the Sun relative to 67P; the Z-axis is X cross Y, completing the right-handed reference frame. |
2.1. GIADA detections
GIADA detections, relying on the particle physical characteristics (tensile strength, size, and optical properties) occur with the following combinations: 1) only the GDS subsystem detects the particle (GDS-only detection); 2) only the IS subsystem detects the particle (IS-only detection); and 3) both GDS and IS subsystems detect the particle (GDS-IS detection). This subsystem response is well characterized on the GIADA proto-flight model (PFM) located in a clean room for calibration purposes (Della Corte et al. 2014). Calibration activity, performed with comet dust analogs ranging from mineral grains of selected sizes to minerals coated with amorphous carbon and porous low tensile strength particles (Ferrari et al. 2014), assessed that the specific detection type provides additional information on the physical properties of the particle. Particles with a momentum below the IS sensitivity and sizes >150 μm, if with optical properties similar to amorphous carbon, and >60 μm if with optical properties similar to silicates, lead to a GDS-only detection. In addition, highly porous and fluffy particles with impact contact times >10 μs are not detectable by IS even if the momentum is higher than the subsystem sensitivity (>10-10 kg m s-1). An example of this type of particles is described by Krueger et al. (2015). Dust modeling showed that GDS-only detections are associated with low-density (<1 kg m-3) porous aggregates of submicron grains (Fulle et al. 2015a). Particles with a momentum >10-10 kg m s-1 and sizes below the GDS sensitivity lead to IS-only detections. Particles with physical characteristics satisfying the detection limits of both subsystems lead to GDS-IS detections, providing the complete set of physical parameters (Fig. 1). IS-only and GDS-IS detections are associated with compact particles having densities comparable with (1.9 ± 1.1) × 103 kg m-3 (Rotundi et al. 2015). In the following we refer to GDS-only detections as fluffy particles and to IS-only and GDS-IS detections as compact particles. When a distinction between IS-only and GDS-IS detections is necessary, we refer to IS-only detections as small compact particles. To describe the spatial distribution of particle detections, we refer to the coordinate system by Preusker et al. (2015).
3. Results
From 15 September 2014 to 5 February 2015, Rosetta followed a series of bound circular terminator orbits at distances of 10 km, 20 km, and 30 km from the 67P nucleus center (Fig. 2). During this phase, GIADA detected a total of 1056 fluffy and 202 compact particles (Table 1, Fig. 3). The fluffy particles detections normally occurred as showers of numerous particles clustered in space and in time with durations of up to 30 s (Fulle et al. 2015a). In the following we describe the results we obtained and the information we were able to derive from all the detections.
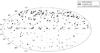 |
Fig. 3 Particle spatial distribution by type: fluffy, compact, and small compact detected during the bound-orbit phase. Fluffy particles, plotted as clusters, i.e., only the detection of each shower is reported, seem the more dispersed particles together with, although to a lesser extent, small compact particles. |
Number of particles by type detected by GIADA during the bound-orbit phase reported with their measured physical parameter ranges.
Enhancements in dust detection rate along the 10 km radius orbits: several compact particle detections close in time identifying higher dust density coma regions and suggesting active areas localized on the nucleus.
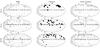 |
Fig. 4 2D histograms on a Mollweide projection showing particle detections divided by type (columns) and by orbit radius (rows). The symbol size is proportional to the number of impacts in the case of detections. |
3.1. Dust environment: dust spatial distribution
Operating in continuous monitoring mode during the bound-orbit phase, GIADA detected sufficient particles to allow a 3D dust spatial distribution reconstruction. To infer possible information on the emitting area at the nucleus surface from the detection positions and also information on how the particles disperse in the cometary coma, we plotted particle detections as a function of particle type and also by cometocentric distance (Fig. 4). Fluffy particles are strongly clustered in time but not over any preferred latitudes and/or longitudes for any cometocentric distance (Figs. 4a−c). The spatial dispersion of compact particles is much less pronounced. Along the 10 km orbit they are detected within a limited range of latitudes (45°÷ 65°) and longitudes (110°÷ 160° and −130°÷−170°), suggesting that they are produced in a specific common area linked to the neck region of the nucleus, that is, the Hapi region (Thomas et al. 2015, Figs. 4d, g). In Table 2 we report an example of compact particle detection event times, latitudes, and longitudes as they occurred along the 10 km orbit. Compact particles are more dispersed at distances of 20 km and 30 km from the nucleus, but a concentration at latitudes between 40° and 70° remains visible (Figs. 4e, f, h, i). The dispersion in latitude and longitude is probably due to a slight deviation of the particle trajectories from the radial direction. Different spatial distributions for the particle types suggest that emission processes and/or interactions with the coma depend on particle physical properties, such as charge, mass, and density.
3.1.1. Dust distribution versus illumination condition
To show the different spatial distributions with respect to illumination conditions, we plot the percentage of detections with respect to the angle Sun-67P-Rosetta, that is, the phase angle (Fig. 5). From the plot we derive a different behavior of the fluffy particles with respect to the compact particles. The number of fluffy particles does not vary significantly with respect to the phase angle: they are also detected in a non-negligible percentage on the nightside. In contrast, compact particles are strongly enhanced for phase angles from 30° to 40°.
3.1.2. Dust activity versus decreasing heliocentric distance
To explore the possibility of an increasing cometary activity at decreasing heliocentric distance, we monitored the dust production during the four months of bound orbits.
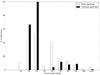 |
Fig. 5 Percentage of particles with respect to the phase angle at which they were detected. The particle numbers are doubly normalized: 1) the number of particles detected at each phase angle divided by the total number of particles of that specific type was calculated; and 2) the obtained ratio was normalized to the time spent by the spacecraft at specific phase angles. |
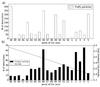 |
Fig. 6 a) Number of fluffy particles vs. week of the year, and b) number of compact particles vs. week of the year reported with decreasing heliocentric distance. Week 46 shows an enhancement in dust particle detections due to the low phase angle trajectory flown during landing operations. |
In Fig. 6 we group the number of particle detections per week rescaled to a single comet-centric distance. We note that the fluffy particles do not show a clear increase with respect to decreasing heliocentric distances (Fig. 6a). To study a possible increase of the compact particles emission, we recall that they do show a strong dependence on phase angle (Fig. 5). We thus focused on detections that occurred when the spacecraft was flying along the terminator, not including week 46 when the manoeuvre to allow the Philae landing brought the spacecraft to phase angles <60°. In addition, strong fluctuations are evident in the detection trend. These are due to the high anisotropy of compact particle emission with respect to latitude (Figs. 4d, g). To really compare coherent observations, that is, at similar phase angles and latitudes, detections that occurred during weeks 38 to 40 have to be compared to those that occurred during weeks 2 and 4 (Fig. 6b). A rough estimate of the dust production increases from 3.36 to 2.43 AU leads to a factor of about 6 (Fig. 6b).
3.1.3. Dust detection versus pointing off-nadir angle
An additional differentiation among the particle types is related to the GIADA pointing configuration. In Fig. 7 we report the number of particles divided per type vs. the off-nadir angle. The plot shows that while compact particles are detected when GIADA is pointing near nadir (given the wide GIADA field of view, nadir is up to 30° off-nadir pointing), some fluffy particles are detected at larger off-nadir angles. This can be explained by either assuming that fluffy particles move along trajectories that are quite different from the radial direction or because their trajectories are influenced by electrostatic interactions with the spacecraft (Fulle et al. 2015a). It is interesting to note two compact particle detections that occurred very close in time and when GIADA was pointing in the zenith direction. These are reflected particles, that is, particles that are falling back to the nucleus. They were detected by the IS with a momentum of about 2 × 10⁻⁸ kg m s-1. From the combination of two different IS calibration curves, that is, particle momentum vs. IS signal and particle kinetic energy vs. IS signal, we can make a rough estimate of the speeds of these two particles and thus derive their masses. The result is on the order of 10-8 kg, which is in the range of the highest masses detected by GIADA. This supports the hypothesis of reflected particles.
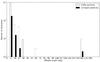 |
Fig. 7 Number of detections per particle type vs. GIADA off-nadir pointing. |
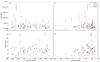 |
Fig. 8 Compact particle masses plotted vs. detection longitude (panel a)) and latitude (panel b)). Compact particle speeds plotted vs. detection longitude (panel c)) and latitude (panel d)). The data are divided per radius of the orbit along which they were acquired, 10, 20, and 30 km. |
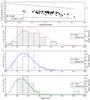 |
Fig. 9 a) Mass-dependent dust speed fitted to derive the power index γ = −0.32 ± 0.18; b)−d): dust speed histograms and Maxwellian fits for particles detected at 30, 20, and 10 km, respectively. The error of the speed measurement is 6%. |
3.2. Dust dynamical properties
The compact particle mass and speed distributions with respect to latitude and longitude at three cometocentric distances were analyzed (Fig. 8). The maximum spread in mass and velocity values is found at the coordinates we already highlighted to spot the most active areas (see Sect. 3.1). The particles detected below the equator have low speeds. In Fig. 9 we report the trend of the compact particle dust speeds with respect to their masses, v ∝ mγ. We derived the power-law index of the mass-dependent dust speed and its confidence interval by applying the boostrap statistical method to the data, from which we obtained γ = −0.32 ± 0.18, which is consistent with the expected values of −0.1667 (see Sect. 4). To infer preliminary information on the dust acceleration region, we studied a possible systematic increase of the dust speed with respect to the nucleus distance. We classified the dust speed data into three subgroups according to the cometocentric distance: up to 15 km (labeled as 10 km), from 15 to 25 km (labeled as 20 km) and from 25 to 35 km (labeled as 30 km). Each set of data was grouped into speed bins (Figs. 9b−d). We fitted the data with Maxwell distributions due to the data skewness. We determined the speed confidence intervals by means of the bootstrap method and obtained (2.5 ± 0.8) m s-1, (3.0 ± 1.0) m s-1, and (4.3 ± 0.9) m s-1 for 10, 20, and 30 km, respectively. These results suggest a possible speed increase between 10 and 30 km.
3.3. Dust flux measured by the microbalance system toward different directions
Since the first week of May 2014, the microbalance system (MBS) monitored the deposition of dust particles smaller than about 5 microns on the five quartz crystal microbalances (QCMs) pointing in five different, roughly orthogonal directions. During the first four months of measurement, the MBS did not register any mass accumulation. In September 2014, QCM1 and QCM5 began measuring dust accumulation (Fig. 10).
We stress here that QCMs are characterized by a residual thermal dependence: the two quartz crystals drift differently with respect to the environmental temperature (Palomba et al. 2002; Battaglia et al. 2004). To overcome the temperature-dependence problem, we performed isothermal readings. We selected for each QCM the temperature reference values, that is, the most frequent one reached during the whole bound-orbit phase. To confirm that the frequency shift trend obtained was really linked to a mass accumulation, we also checked the frequency trend using temperature readings other than most frequent ones.
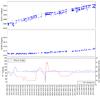 |
Fig. 10 Two out of five microbalances, QCM1 and QCM5 show an increase in frequency during the bound orbit phase (Sept. 2014−Feb. 2015) due to the dust mass accumulated on the quartz sensors. A strong anisotropy in the dust flux is inferred by comparing the much steeper frequency increase of QCM1, pointing toward the Sun (top panel) with respect to QCM5, pointing nadir (middle panel). The QCMs residual signal noise is due to the sensor thermal hysteresis. This effect is particularly evident for QCM1 for which the signal appears as a double line since GIADA commissioning after the Rosetta hibernation phase, giving a frequency error of 5 Hz, which is twice that of the other QCMs. The bottom panel shows the phase angle and the distance from the nucleus at which the data were acquired. |
To evaluate the dust mass accumulated on the QCMs, we rescaled the frequency readings to a fixed spacecraft nucleus distance of 10 km. We report in Table 3 the dust mass accumulated for each week of the bound-orbit phase. These results show a strong anisotropy in the dust flux. Thanks to the MBS configuration, QCMs measure the dust flux coming from roughly orthogonal directions. During the terminator orbits, that is, a phase angle of about 90°, QCM1 pointed roughly toward the Sun, measuring the dust flux coming from the subsolar point and reflected by the solar pressure. In this configuration, the QCM5, pointing nadir, measured the dust flux coming from areas in dusk or dawn. This observing geometry was maintained for most of the bound-orbit phase, resulting in a cumulated mass emitted from the subsolar areas and subsequently reflected by the solar pressure (QCM1) three times greater than the cumulated mass emitted from the terminator (QCM5), see Table 3. The flux of the submicron particles increases with decreasing heliocentric distances: weeks 15 to 20 (Table 3) show a generally increasing dust accumulation on both QCM1 and QCM5.
Dust mass accumulated weekly on QCM1 (pointing in the Sun direction) and on QCM5 (pointing in the nadir direction).
4. Discussion
Fluffy particles are porous aggregates of submicron grains produced from the nucleus. They range in size from 0.2 to 2.5 mm and their equivalent bulk density is up to 1 kg m-3. They are charged, fragmented, and decelerated by the spacecraft negative potential and enter GIADA in showers of fragments at speeds <1 m s-1 (Fulle et al., 2015a). We suggest that these fluffy particles resemble the 67P particles collected by COSIMA (Schulz et al. 2015) having a tensile strength such that they could break apart on impact. This behavior is consistent with fluffy particle fragmentation (Fulle et al. 2015a). Morphological analogs could be explored among collected extraterrestrial dust particles: 1) the chondritic porous aggregates, the ultrafine-grained matrix with occasional micron-sized iron-sulfide and/or Mg-rich olivine grains (Rietmeijer 2002); 2) cluster IDPs, a mixture of micron-sized grains and 5−20 micron sulfide and silicate minerals (Rietmeijer & Nuth 2004; Thomas et al. 1995); and 3) giant cluster IDPs (Messenger et al. 2015). GIADA fluffy low-density aggregates analogs among the Wild 2 particles could be the volatile-rich aggregates producing bulbous tracks (type C, Hörz et al. 2006), in the capturing aerogel, leaving organic IR features along the track and carbon-rich small fragments completely scattered throughout the track (Sandford et al. 2006; Rotundi et al. 2008). Compact GIADA particles can be associated with Wild 2 dense mineral grains, forming type A carrot-like thin trails (e.g., Hörz et al. 2006; Rotundi et al. 2014), and/or to cluster IDPs carving type B bulbous trails ending in stylus tracks (e.g., Hörz et al. 2006; Rotundi et al. 2008). Compact and dense particles with bulk density constrained in the range (1.9 ± 1.1) × 103 kg m-3 (Rotundi et al. 2015; Fulle et al. 2015b) and sizes (80 to 800 μm) that prevent their dynamics to be affected by coma and spacecraft potentials (Fulle et al. 2015a). Fluffy and compact particles detected by GIADA show a different detection spatial distributions. This different behavior might be associated with their physical properties, such as mass, size, morphology, and shape, or might be associated with a different driving factor of the emission process and/or with a different behavior toward the gas-dust interaction after emission. Fluffy particles are detected over a wide range of longitudes and latitudes (Figs. 4a−c), and thus it is difficult to infer information on a possible preferred emission area. The observed dispersion might suggest that their emission is associated with a driving factor present quite uniformly over the nucleus surface. For comet 103P/ Hartley 2, the presence of low-density dust aggregates is correlated with the presence of CO2 (Protopapa et al. 2014). Comet 67P shows a high CO2/H2O ratio at negative latitudes (Hässig et al. 2015), consistent with the spatial detections of fluffy particles. An oversimplified interpretation would lead to a connection between the fluffy aggregates and the CO2 emission. However, there are fluffy particle detections clustering at positive latitudes, especially along the 10 km orbit (Fig. 4a) that tend to shift toward negative latitudes at higher cometocentric distances (Figs. 4b, c). This can also be interpreted as a rapid dispersion in the coma of fluffy particles because of electrostatic forces acting on fluffy particles alone and a different level of coupling with the gas with respect to the compact ones (Figs. 4d to i).
We are inclined to associate the high-rate particle detections with the presence of H2O on the nucleus. Comet 67P showed a quite localized gas activity, especially when studying the water vapor emission. MIRO measurements confined a substantial portion of water outgassing to the comet neck region (Gulkis et al. 2015). ROSINA showed that H2O peaks are observed when the neck is in view of the spacecraft, and more in general, a higher H2O production is measured from regions at positive latitude and ± 90° longitudes (Hässig et al. 2015). These H2O-rich areas are consistent with the coordinates of compact particle detections constrained by GIADA, of course recalling that dust more than gas would deviate from the radial direction, resulting in different longitude values. VIRTIS onboard Rosetta describes the surface of 67P as coated by a complex mixture of organics that are generally dehydrated except for in active areas showing a small amount of water ice (Capaccioni et al. 2015). Ciarniello et al. (2015) attributed the slightly brighter aspect of the neck area with respect to the rest of the nucleus to enrichment in water ice. OSIRIS, the Rosetta camera, imaged meter-sized bright spots in the neck area, for example, that were interpreted as due to water ice exposure: dark mantle fragmentation exposes the icy material beneath it, which, triggered by insulation, might be responsible for the activation of new dust-emitting areas (Pommerol et al. 2015). This process might explain the GIADA compact particle detections that occurred only late in the bound-orbit phase at negative latitudes. An additional hint that compact particles are associated with the neck area can be found in the lack of compact particle detections for phase angles <30 (Fig. 5). In fact, although at small phase angles a higher compact particle detection rate was normally registered, in this case, compact particle detections are missing because the trajectory was not in view of the neck area. The connection of compact particle production to the comet water ejection rate needs a much more detailed study and modeling to implement a trace-back scenario. To this end, the spatial distribution of the dynamical properties of the particles is critical. This work is in progress; for the time being, we only note that the highest values for particle mass and speed are related to confirmed active areas. These dust particle dynamical parameters support a preliminary study of the acceleration region within the 67P coma. The analysis of the particle speeds for different cometocentric distances resulted in an increment of the speed from 10 km to 30 km. We consider the dust drag equation in a spherically symmetric coma (Wallis 1982) balancing the dust acceleration with the gas drag and the nucleus gravity forces: ![Mathematical equation: \begin{equation} v {{{\rm d}v} \over {{\rm d}r}} = C_{\rm D} ~GM_n \left[{{u - v} \over {\lambda ~u ~r}}\right]^{2} - {{GM_n} \over {r^{2}}}, \end{equation}](/articles/aa/full_html/2015/11/aa26208-15/aa26208-15-eq31.png) (1)where v is the dust velocity, r is the distance from the nucleus center, CD = 2 is the dust drag coefficient, GMn = 667 m3 s-2 is the gravitational constant times the 67P nucleus mass (Sierks et al. 2015), u is the gas speed, and
(1)where v is the dust velocity, r is the distance from the nucleus center, CD = 2 is the dust drag coefficient, GMn = 667 m3 s-2 is the gravitational constant times the 67P nucleus mass (Sierks et al. 2015), u is the gas speed, and  depends on the ratio between the dust diameter a and the diameter amax of the largest particle that can escape the nucleus surface. This equation can be easily integrated from the nucleus surface at r = R (where v = v0):
 ![Mathematical equation: \begin{equation} 1 - {R \over r}\! =\! {{\lambda ~R ~u^{2}} \over {2 \,GM_n}} \left[(1-\lambda) \ln {{(1\!-\!\lambda) u - v_0} \over {(1-\lambda) u - v}}\! +\! (1\!+\!\lambda) \ln {{(1+\lambda) u - v} \over {(1+\lambda) u - v_0}} \right]\!\cdot \end{equation}](/articles/aa/full_html/2015/11/aa26208-15/aa26208-15-eq44.png) (2)For all GIADA speeds, v ≪ u, so that a working approximation (error <0.1%) is the second-order Taylor expansion,
(2)For all GIADA speeds, v ≪ u, so that a working approximation (error <0.1%) is the second-order Taylor expansion, ![Mathematical equation: \begin{equation} v^{2} - v_0^{2} = (1 - R/r) [(a_{\max}/a) - 1] ~2GM_n/R , \end{equation}](/articles/aa/full_html/2015/11/aa26208-15/aa26208-15-eq47.png) (3)where amax = 17 mm (Rotundi et al. 2015). For a ≪ amax, Eq. (3) provides γ = −0.1667. Since 67P is very far from a spherical shape, R can be considered the distance from the nucleus center, where the spherical symmetry becomes a good approximation. About 90% of the dust speeds were measured by GIADA in the mass bin from 10-8 kg to 10-7 kg. Assuming a mean bulk density of 2 × 10³ kg m-3 consistent with Rotundi et al. (2015), this mass bin corresponds to a mean diameter a = 400μm. Assuming R = 4.7 km, Eq. (3) provides v = 2.5 m s-1 at r = 10 km, v = 3.0 m s-1 at r = 20 km, and v = 3.2 m s-1 at r = 30 km, in good agreement with the GIADA data. The significantly higher dust speed observed at 30 km (4.2 m s-1) may be due to some general trend of the dust speed versus heliocentric distance, or more probably to the strong approximation given by the assumed spherical symmetry. The data relative to the bound-orbit phase show quite a strong dependence of particle velocity as a function of particle mass as v ∝ m− 0.32 ± 0.18, that is, consistent with the gamma value obtained by Eq. (3). In Rotundi et al. (2015) this was not the case because of either the different heliocentric distances or the large distances of the spacecraft from the nucleus at which those measurements were obtained. Computations of the gas drag in the non-spherical gas coma linked to the real shape of 67P nucleus (Crifo et al. 2004) will allow more realistic comparisons between data and models. Modeling will also allow us to investigate the perturbations on the motion of submicron particles due to the solar radiation pressure. The integrated flux of submicron particles coming from the Sun direction is about three times higher than the flux coming directly from the nucleus. We can estimate the ratio of the mean dust ejected flux from subsolar areas versus terminator areas taking into account the different flight time of reflected versus direct particles. The field of view of the Sun-pointing QCM allows GIADA to collect particles produced from the nucleus at a Sun-zenith angle <50°. The flight time of these particles is a factor >cos(50°) longer than that of direct particles. Since the received dust flux scales according to the square of the dust flight time, we conclude that terminator areas emit a flux of submicron dust <15% than the flux of nucleus areas characterized by a Sun-zenith angle <50°.
(3)where amax = 17 mm (Rotundi et al. 2015). For a ≪ amax, Eq. (3) provides γ = −0.1667. Since 67P is very far from a spherical shape, R can be considered the distance from the nucleus center, where the spherical symmetry becomes a good approximation. About 90% of the dust speeds were measured by GIADA in the mass bin from 10-8 kg to 10-7 kg. Assuming a mean bulk density of 2 × 10³ kg m-3 consistent with Rotundi et al. (2015), this mass bin corresponds to a mean diameter a = 400μm. Assuming R = 4.7 km, Eq. (3) provides v = 2.5 m s-1 at r = 10 km, v = 3.0 m s-1 at r = 20 km, and v = 3.2 m s-1 at r = 30 km, in good agreement with the GIADA data. The significantly higher dust speed observed at 30 km (4.2 m s-1) may be due to some general trend of the dust speed versus heliocentric distance, or more probably to the strong approximation given by the assumed spherical symmetry. The data relative to the bound-orbit phase show quite a strong dependence of particle velocity as a function of particle mass as v ∝ m− 0.32 ± 0.18, that is, consistent with the gamma value obtained by Eq. (3). In Rotundi et al. (2015) this was not the case because of either the different heliocentric distances or the large distances of the spacecraft from the nucleus at which those measurements were obtained. Computations of the gas drag in the non-spherical gas coma linked to the real shape of 67P nucleus (Crifo et al. 2004) will allow more realistic comparisons between data and models. Modeling will also allow us to investigate the perturbations on the motion of submicron particles due to the solar radiation pressure. The integrated flux of submicron particles coming from the Sun direction is about three times higher than the flux coming directly from the nucleus. We can estimate the ratio of the mean dust ejected flux from subsolar areas versus terminator areas taking into account the different flight time of reflected versus direct particles. The field of view of the Sun-pointing QCM allows GIADA to collect particles produced from the nucleus at a Sun-zenith angle <50°. The flight time of these particles is a factor >cos(50°) longer than that of direct particles. Since the received dust flux scales according to the square of the dust flight time, we conclude that terminator areas emit a flux of submicron dust <15% than the flux of nucleus areas characterized by a Sun-zenith angle <50°.
5. Summary and conclusions
GIADA was able to characterize the 67P coma dust environment at heliocentric distances between 3.42 and 2.36 AU, inbound toward the Sun, during the bound-orbit phase of the Rosetta space mission.
-
We were able to describe the evolution of the 3D dust distributionwith respect to the distance from the comet and to identify thespatial distribution of different types of dust particles: fluffyparticles, that is, 0.2 to 2.5 mm porous aggregates of submicrongrains (equivalent bulk density<1 kg m-3) and compact particles, ranging in size from 80 to 800 microns.
-
For the fluffy particles it is difficult to confine a specific emitting area because of their diffused detections; the compact particles appear to be associated with the neck area.
-
The dust emission of fluffy and compact particle has been analyzed with respect to nucleus illumination conditions. We conclude that there is a stronger correlation with the solar illumination for compact than for fluffy particles.
-
Monitoring the coma terminator dust environment, we give a rough estimate of the dust activity increase at decreasing heliocentric distance of roughly a factor of about 6 from 3.36 to 2.43 AU.
-
The measured masses and speeds of compact particles are in the range from 10-10 to 3.9 × 10⁻⁷ kg and from 0.3 to 12.2 m s-1, respectively.
-
The analysis of compact particle speeds versus cometocentric distance shows that in the dust acceleration region, the dust speed increases from 2.5 ± 0.8 m s-1 at 10 km to 4.3 ± 0.9 m s-1 at 30 km.
-
The power-law index of the mass-dependent dust velocity is −0.32 ± 0.18.
-
The dust flux of submicron particles coming from the solar direction is three times higher than the one coming directly from the nucleus. The measured dust flux anisotropy confirms what was predicted by on-ground dust coma observations (Fulle et al. 2010).
GIADA is continuing to monitor the dust environment while 67P is increasing its activity as it approaches perihelion, which will occur on August 13, 2015. This will allow us to continue the 67P dust environment characterization and to contribute to re-evalulating the dust-to-gas ratio that was previously determined by Rotundi et al. (2015) when Rosetta was approaching 67P (heliocentric distances from 3.6 to 3.4 AU). We will also work on the challenging objective of modeling the trace-back problem to obtain more precise information on the emitting areas.
Acknowledgments
GIADA was built by a consortium led by the Universitá degli Studi di Napoli “Parthenope” and INAF − Osservatorio Astronomico di Capodimonte, in collaboration with the Instituto de Astrofisica de Andalucia, Selex-ES, FI, and SENER. GIADA is currently managed and operated by the Istituto di Astrofisica e Planetologia Spaziali-INAF, Italy. GIADA was funded and managed by the Agenzia Spaziale Italiana, with the support of the Spanish Ministry of Education and Science Ministerio de Educacion y Ciencias (MEC). GIADA was developed from a Principal Investigator proposal from the University of Kent; science and technology contributions were provided by CISAS, Italy; Laboratoire d’Astrophysique Spatiale, France, and institutions from the UK, Italy, France, Germany, and the USA. Science support was provided by NASA through the US Rosetta Project managed by the Jet Propulsion Laboratory/ California Institute of Technology. We would like to thank A. Coradini for her contribution as a GIADA Co-Investigator. GIADA calibrated data will be available through ESA’s Planetary Science Archive (PSA) website (www.rssd.esa.int/index.php? project=PSA&page=index). All data presented here are available on request before archival in the PSA. This research was supported by the Italian Space Agency (ASI) within the ASI-INAF agreements I/032/05/0 and I/024/12/0. The authors are grateful to the anonymous reviewers for very constructive suggestions that contributed to improve our paper.
References
- Battaglia, R., Palomba, E., Palumbo, P., Colangeli, L., & Della Corte, V. 2004, Adv. Space Res., 2258 [Google Scholar]
- Capaccioni, F., Coradini, A., Filacchione, G., et al. 2015, Science, 347, aaa0628 [Google Scholar]
- Ciarniello, M., Capaccioni, F., Filacchione, G., et al. 2015, A&A, 583, A31 [NASA ADS] [CrossRef] [EDP Sciences] [Google Scholar]
- Colangeli, L. J. J., Lopez Moreno, P., Palumbo, et al. 2007, Space Sci. Rev., 128, 803 [NASA ADS] [CrossRef] [Google Scholar]
- Crifo, J. F., Lukyanov, V., Zakharov, V., & Rodionov, V. 2004, in The New ROSETTA Targets, eds. L. Colangeli et al. (Kluwer Academic Publishers), 11931 [Google Scholar]
- Della Corte, V., Rotundi, A., Accolla, M., et al. 2014, J. Astron. Instrum., 1350011 [Google Scholar]
- Economou, T. E., Green, S. F., Brownlee, D. E., & Clark, B. C. 2013, Icarus, 222, 526 [Google Scholar]
- Esposito, F., Colangeli, L., Della Corte, V., & Palumbo, P. 2002, Adv. Space Res., 29, 1159 [NASA ADS] [CrossRef] [Google Scholar]
- Ferrari, M., Della Corte, V., Rotundi, A., & Rietmeijer, F. J. M. 2014, Planet. Space Sci., 101, 53 [NASA ADS] [CrossRef] [Google Scholar]
- Fulle, M., Colangeli, L., Mennella, V., Rotundi, A., Bussoletti, E. 1995, A&A, 304, 622 [NASA ADS] [Google Scholar]
- Fulle, M., Levasseur-Regourd, A. C., McBride, N., & Hadamcik, E. 2000, AJ, 119, 1968 [Google Scholar]
- Fulle, M., Colangeli, L., Agarwal, J., et al. 2010, A&A, 522, A63 [NASA ADS] [CrossRef] [EDP Sciences] [Google Scholar]
- Fulle, M., Della Corte, V., Rotundi, A., et al. 2015a, ApJ, 802, L12 [NASA ADS] [CrossRef] [Google Scholar]
- Fulle, M., Ivanovski, S. L., Bertini, I., et al. 2015b, A&A, 583, A14 [NASA ADS] [CrossRef] [EDP Sciences] [Google Scholar]
- Green, S. F., McDonnel, J. A. M., McBride, N., et al. 2004, J. Geophys. Res. 109, E12S04 [Google Scholar]
- Gulkis, S., Allen, M., von Allmen, P., et al. 2015, Science, 347, aa0709 [Google Scholar]
- Hässig, M., Altwegg, K., Balsiger, H., et al. 2015, Science, 347, aaa0276 [Google Scholar]
- Hörz, F., Bastien, R., Borg, J., et al. 2006, Science, 314, 1716 [NASA ADS] [CrossRef] [PubMed] [Google Scholar]
- Krüger, H. F., Seidensticker, K., Fischer, H.-H., et al. 2015, A&A, 583, A15 [Google Scholar]
- Mazzotta Epifani, E., Bussoletti, E., Colangeli, L., et al. 2002, Adv. Space Res., 29, 1165 [NASA ADS] [CrossRef] [Google Scholar]
- McDonnell, J. A. M., Pankiewiz, G. S., Birchley, N. W., Green, S. F., & Perry, H. 1990, in Proceedings of the 20th Lunar and Planet. Sci. Conf. (Lunar and Planetary Institute, Houston, TX), 373 [Google Scholar]
- McDonnell, J. A. M., McBride, N., Beard, R., et al. 1993, Nature, 362, 732 [NASA ADS] [CrossRef] [Google Scholar]
- Messenger, S., Brownlee, D. E., Joswiak, D. J., & Nguyen, A. N. 2015, 46th Lunar and Planet. Sci. Conf., #2603 [Google Scholar]
- Palomba, E., Colangeli, L., Palumbo, P., et al. 2002, Adv. Space Res., 29, 1155 [NASA ADS] [CrossRef] [Google Scholar]
- Pommerol, A., Thomas, N., El-Maarry, M. R., et al. 2015, A&A, 583, A25 [Google Scholar]
- Preusker, F., Scholten, F., Matz, K.-D., et al. 2015, A&A, 583, A33 [NASA ADS] [CrossRef] [EDP Sciences] [Google Scholar]
- Protopapa, S., Sunshine, J. M., Feaga, L. M., et al. 2014, Icarus, 238, 191 [NASA ADS] [CrossRef] [Google Scholar]
- Rietmeijer, F. J. M. 2002, Chemie der Erde Geochemistry, 62, 1 [Google Scholar]
- Rietmeijer, F. J. M., & Nuth III, J. A. 2004, in The New ROSETTA Targets, eds. L. Colangeli et al. (The Netherlands: Kluwer Academic Publishers), 9710 [Google Scholar]
- Rotundi, A., Sierks, H., Della Corte, V., et al. 2015, Science, 347, 6220 [Google Scholar]
- Rotundi, A., Baratta, G. A., Borg, J., et al. 2014, Meteor. Planet. Sci., 49, 550 [Google Scholar]
- Rotundi, A., Rietmeijer, F., Ferrari, M., et al. 2008, Meteor. Planet. Sci., Nr 1/2, 367 [Google Scholar]
- Sanford, S., Aléon, J., Alexander, C. M. O. D., et al. 2006, Science, 314, 1720 [NASA ADS] [CrossRef] [PubMed] [Google Scholar]
- Schulz, R., Hilchenbach, M., Langevin, Y., et al. 2015, Nature, 518, 216 [NASA ADS] [CrossRef] [Google Scholar]
- Sierks, H., Barbieri, C., Lamy, P. L., et al. 2015, Science, 347, 6220 [CrossRef] [Google Scholar]
- Thomas, K. L., Blanford, G. E., Clemett, S. J., et al. 1995, Geochim. Cosmoch., 59, 2797 [Google Scholar]
- Thomas, N., Sierks, H., Barbieri, C., et al. 2015, Science, 347, 0440 [CrossRef] [Google Scholar]
- Wallis. M. K. 1982, in Comets, ed. L. L. Wilkening (Tucson: University of Arizona), 357 [Google Scholar]
All Tables
Number of particles by type detected by GIADA during the bound-orbit phase reported with their measured physical parameter ranges.
Enhancements in dust detection rate along the 10 km radius orbits: several compact particle detections close in time identifying higher dust density coma regions and suggesting active areas localized on the nucleus.
Dust mass accumulated weekly on QCM1 (pointing in the Sun direction) and on QCM5 (pointing in the nadir direction).
All Figures
|
Fig. 1 GIADA working principle and measurable dust parameters. Panel a): block diagram displaying the GIADA subsystems and the path of the incoming dust particle. The bottom panels provide dust particle parameters directly measured by GIADA (panel b)), derived from the measurements (panel c)), and obtained after selecting specific calibration curves dependent on dust optical properties (panel d)). |
| In the text | |
|
Fig. 2 Longitude and latitude covered along the bound orbits phase at 30, 20, and 10 km orbit radius (left panel) and Rosetta orbits reported in the 67P body-centered solar orbital (CSO) frame (right panel). The CSO frames for 67P are defined as follows: X-axis points from 67P to the Sun; the Y-axis is the component orthogonal to the X-axis of inertially referenced velocity of the Sun relative to 67P; the Z-axis is X cross Y, completing the right-handed reference frame. |
| In the text | |
|
Fig. 3 Particle spatial distribution by type: fluffy, compact, and small compact detected during the bound-orbit phase. Fluffy particles, plotted as clusters, i.e., only the detection of each shower is reported, seem the more dispersed particles together with, although to a lesser extent, small compact particles. |
| In the text | |
|
Fig. 4 2D histograms on a Mollweide projection showing particle detections divided by type (columns) and by orbit radius (rows). The symbol size is proportional to the number of impacts in the case of detections. |
| In the text | |
|
Fig. 5 Percentage of particles with respect to the phase angle at which they were detected. The particle numbers are doubly normalized: 1) the number of particles detected at each phase angle divided by the total number of particles of that specific type was calculated; and 2) the obtained ratio was normalized to the time spent by the spacecraft at specific phase angles. |
| In the text | |
|
Fig. 6 a) Number of fluffy particles vs. week of the year, and b) number of compact particles vs. week of the year reported with decreasing heliocentric distance. Week 46 shows an enhancement in dust particle detections due to the low phase angle trajectory flown during landing operations. |
| In the text | |
|
Fig. 7 Number of detections per particle type vs. GIADA off-nadir pointing. |
| In the text | |
|
Fig. 8 Compact particle masses plotted vs. detection longitude (panel a)) and latitude (panel b)). Compact particle speeds plotted vs. detection longitude (panel c)) and latitude (panel d)). The data are divided per radius of the orbit along which they were acquired, 10, 20, and 30 km. |
| In the text | |
|
Fig. 9 a) Mass-dependent dust speed fitted to derive the power index γ = −0.32 ± 0.18; b)−d): dust speed histograms and Maxwellian fits for particles detected at 30, 20, and 10 km, respectively. The error of the speed measurement is 6%. |
| In the text | |
|
Fig. 10 Two out of five microbalances, QCM1 and QCM5 show an increase in frequency during the bound orbit phase (Sept. 2014−Feb. 2015) due to the dust mass accumulated on the quartz sensors. A strong anisotropy in the dust flux is inferred by comparing the much steeper frequency increase of QCM1, pointing toward the Sun (top panel) with respect to QCM5, pointing nadir (middle panel). The QCMs residual signal noise is due to the sensor thermal hysteresis. This effect is particularly evident for QCM1 for which the signal appears as a double line since GIADA commissioning after the Rosetta hibernation phase, giving a frequency error of 5 Hz, which is twice that of the other QCMs. The bottom panel shows the phase angle and the distance from the nucleus at which the data were acquired. |
| In the text | |
Current usage metrics show cumulative count of Article Views (full-text article views including HTML views, PDF and ePub downloads, according to the available data) and Abstracts Views on Vision4Press platform.
Data correspond to usage on the plateform after 2015. The current usage metrics is available 48-96 hours after online publication and is updated daily on week days.
Initial download of the metrics may take a while.