Fig. 4
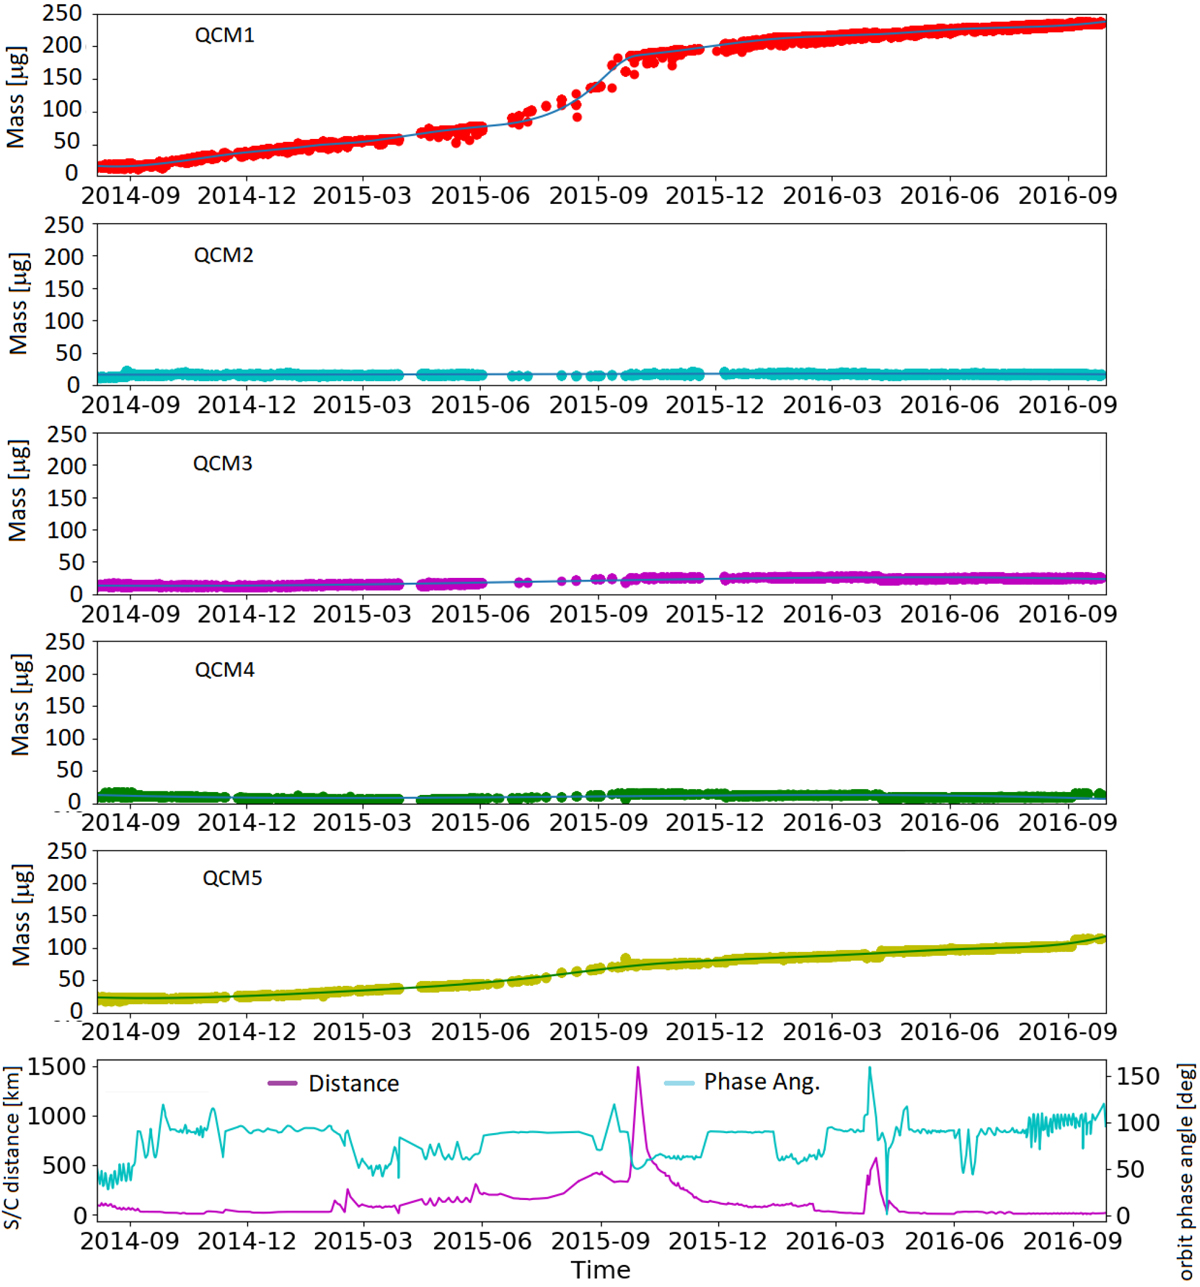
Cumulated mass deposited on the QCMs retrieved after the isotherm filtering, i.e., on selected data points that were acquired when the QCM is at its most frequent temperature +/−0.75 °C. Cumulated masses are fitted by continuous spline curves. The curves show a relevant mass deposition increase on QCM1 and QCM5, in particular around perihelion of 67P (13 August 2015). No dust mass increase is detected byQCM2 and QCM4, while a slight increase in QCM3 is limited to perihelion. In the bottom panel we report the variation of the S/C distance from the comet and the phase angle (spacecraft-comet-Sun) that could influence the dust flux. No clear correlation is visible. A dust flux increase is visible for QCM5 at the end of the mission, which is associated with the outburst that occurred on 5 September 2016, when the S/C was at about 5 km from the nucleus surface of 67P.
Current usage metrics show cumulative count of Article Views (full-text article views including HTML views, PDF and ePub downloads, according to the available data) and Abstracts Views on Vision4Press platform.
Data correspond to usage on the plateform after 2015. The current usage metrics is available 48-96 hours after online publication and is updated daily on week days.
Initial download of the metrics may take a while.