Fig. 3
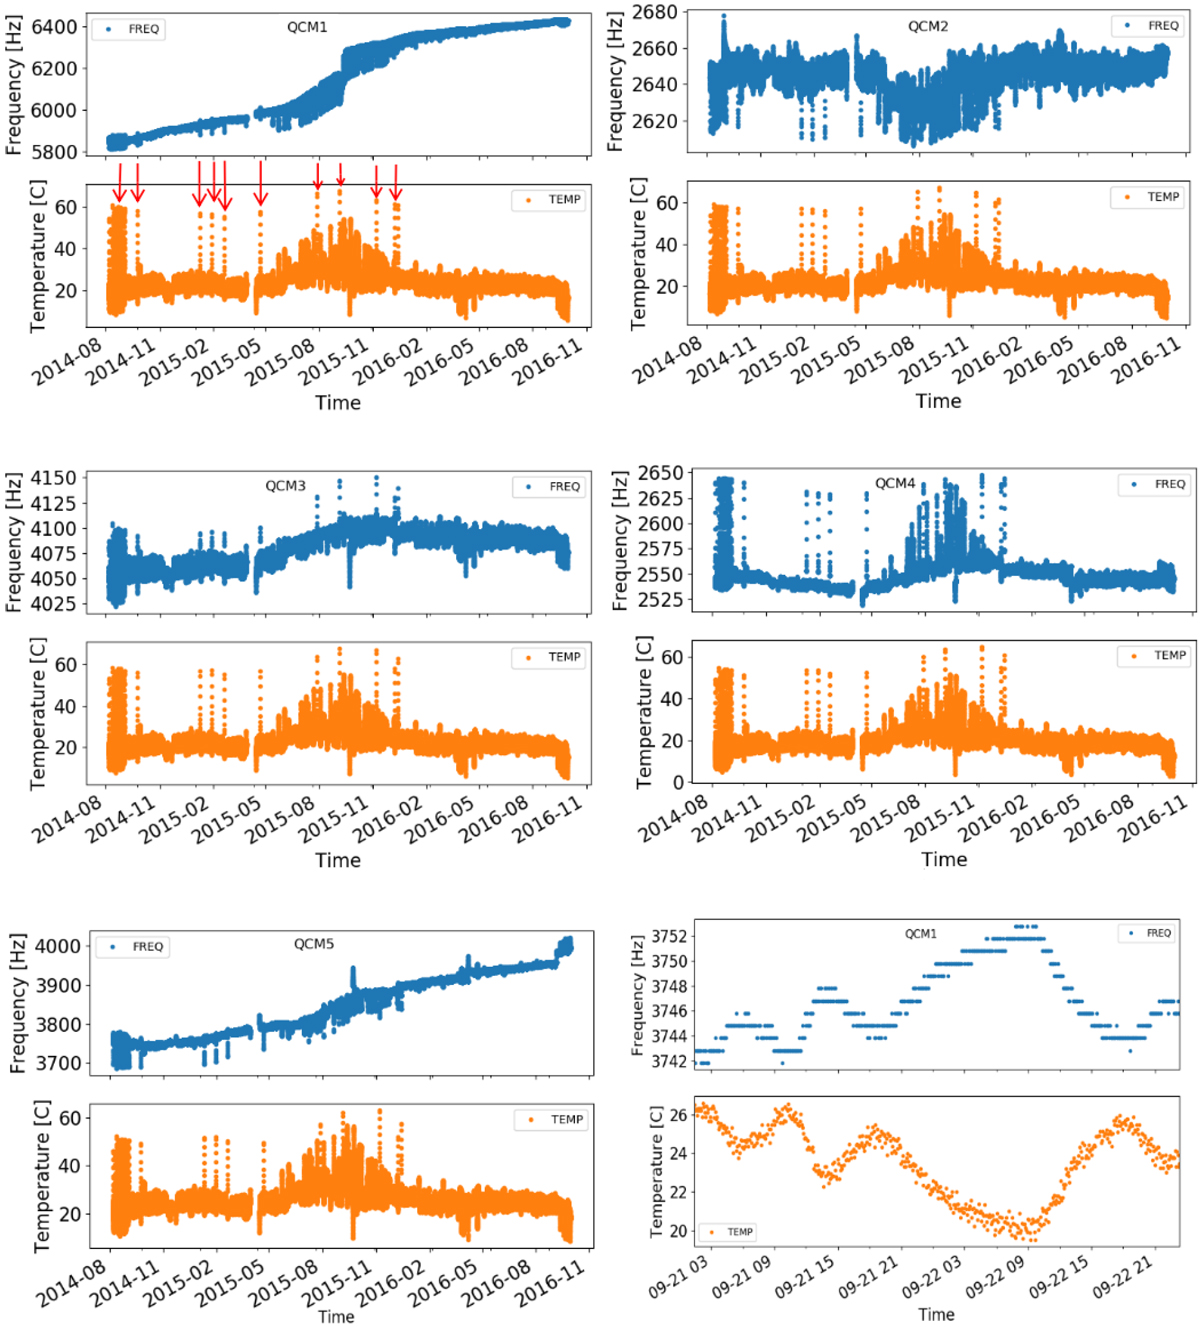
MBS data, frequencies, and temperatures for each QCM, collected during the entire Rosetta mission, 6 August 2014–30 September 2016. QCM1 and QCM5 show a significant frequency increase. MBS active heatings are highlighted as an example for QCM1 raw data by red arrows (upper left panel). These telecommanded temperature variations can also be easily recognized in the other plots. In the bottom right panel we report the thermal behavior of QCM1 over 24 h in response to the variable S/C pointing, which induces temperature variations of only a few degrees.
Current usage metrics show cumulative count of Article Views (full-text article views including HTML views, PDF and ePub downloads, according to the available data) and Abstracts Views on Vision4Press platform.
Data correspond to usage on the plateform after 2015. The current usage metrics is available 48-96 hours after online publication and is updated daily on week days.
Initial download of the metrics may take a while.