Fig. 2
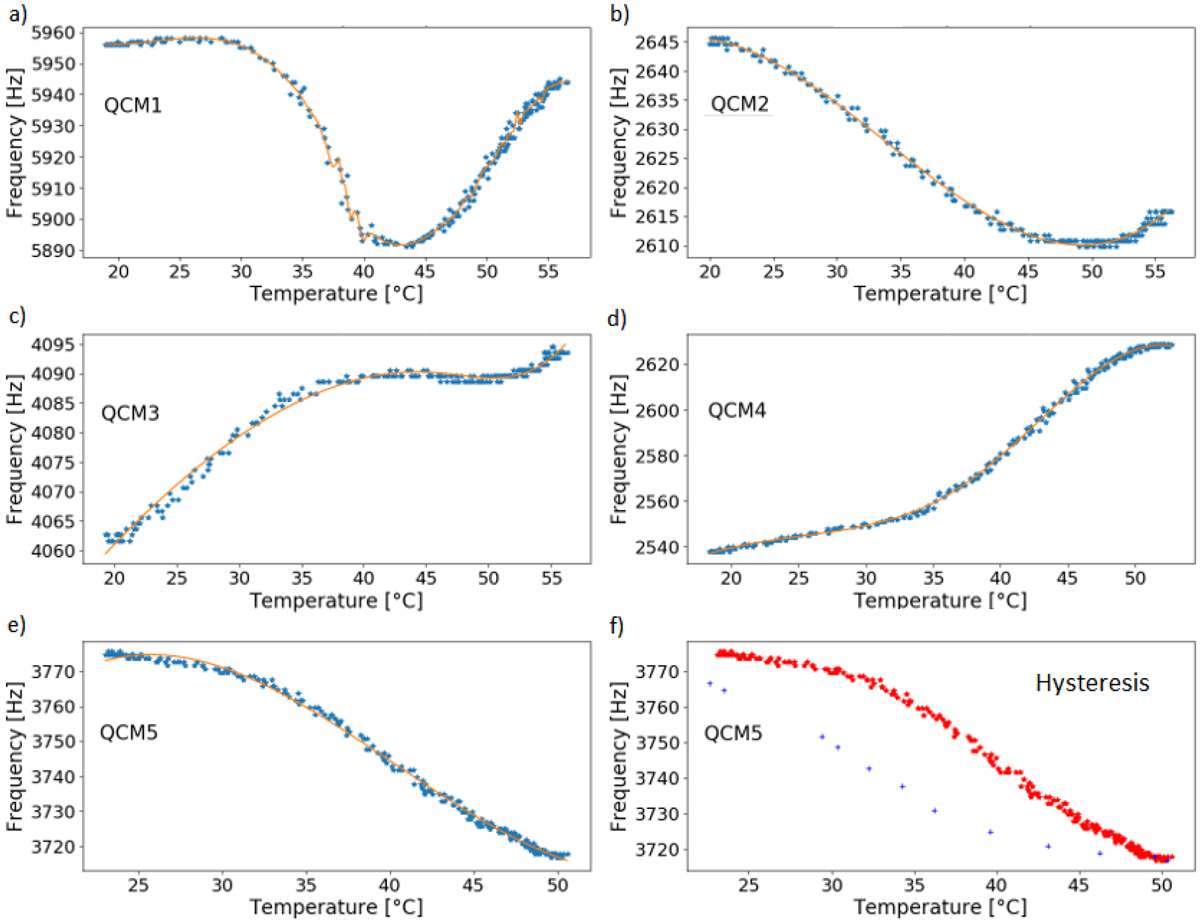
Panels a–e: frequency vs. temperature correlation plots for the five QCMs, retrieved during a commanded MBS active heatings. Panel f: QCM5 thermal cycle reported as an example of the thermal hysteresis. Red dots correspond to the frequency vs. temperature data measured for QCM5 during the MBS active heating; blue dots are the data corresponding to the subsequent QCM5 passive cooling. Comparing the different panels it is evident that QCMs do not have monotonic trends and that each QCM has a specific behavior with respect to temperature variations.
Current usage metrics show cumulative count of Article Views (full-text article views including HTML views, PDF and ePub downloads, according to the available data) and Abstracts Views on Vision4Press platform.
Data correspond to usage on the plateform after 2015. The current usage metrics is available 48-96 hours after online publication and is updated daily on week days.
Initial download of the metrics may take a while.