Free Access
Fig. 6
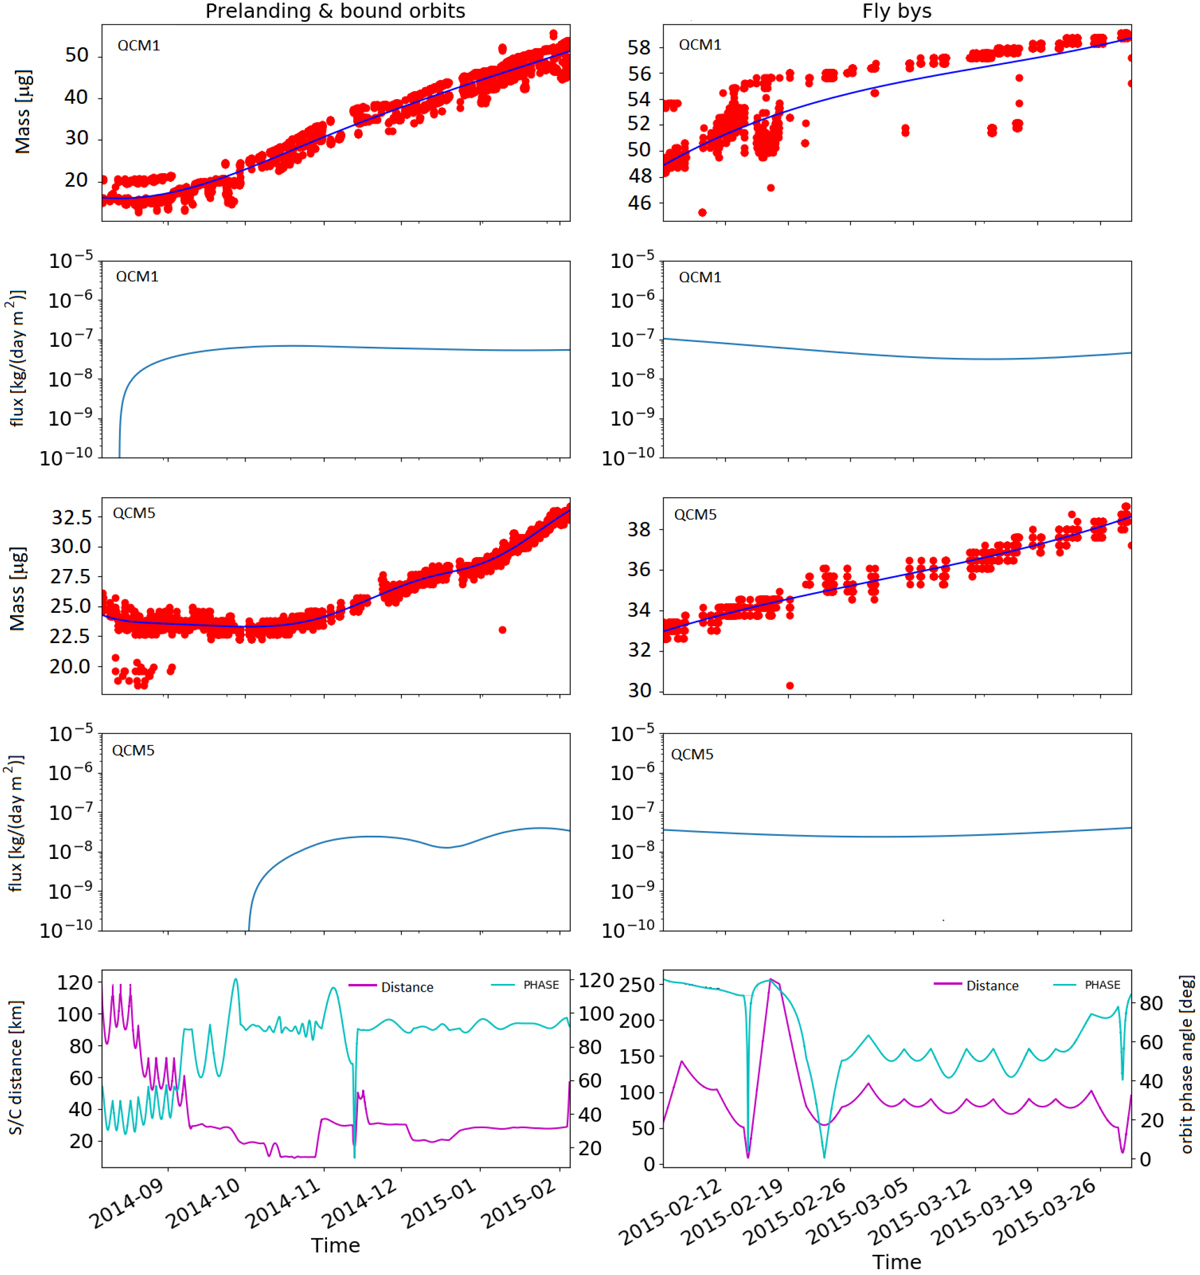
Submicrometer- and micrometer-sized cumulated dust mass and fluxes measured by QCM1 and QCM5 during pre-landing (left column) and flyby (right column). The sparse isolated data points are due to the thermal history of the QCMs (hysteresis). The fitting algorithm assigns a low weight to these stragglers.
Current usage metrics show cumulative count of Article Views (full-text article views including HTML views, PDF and ePub downloads, according to the available data) and Abstracts Views on Vision4Press platform.
Data correspond to usage on the plateform after 2015. The current usage metrics is available 48-96 hours after online publication and is updated daily on week days.
Initial download of the metrics may take a while.