Fig. 5
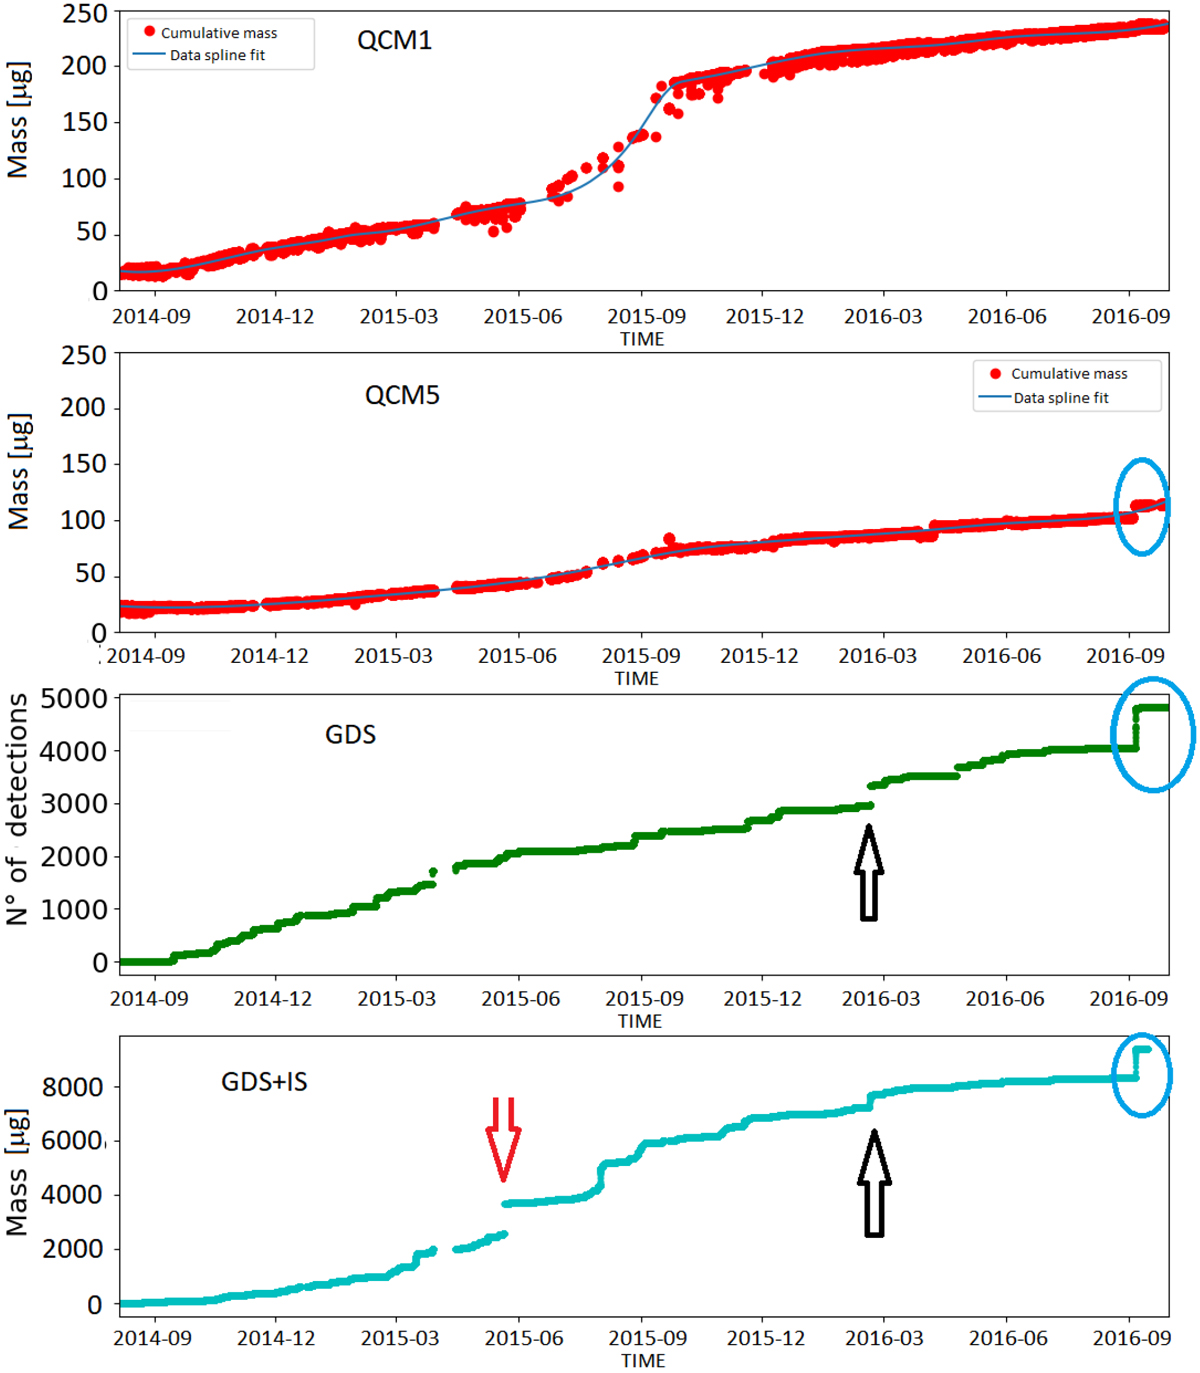
From top: submicrometer- and micrometer-sized cumulated mass measured by QCM1 and QCM5 (first two panels; GIADA/GDS-only cumulative detections of particles >100 μm (third panel); cumulated mass of particles > 100 micrometers, measured by the GDS and IS GIADA subsystems (bottom panel). We highlight the dust event on 5 September 2016 with blue circles. This event was registered by all the GIADAsensors pointing nadir, i.e., QCM5, GDS, and IS, because the S/C-nucleus distance was short (about 5 km). Conversely, the outburst on 19 February 2016 (Grün et al. 2016) was registered only by GDS and IS (see black arrows in the two bottom panels), but not by QCM5 because the S/C was at 30 km from the nucleus, i.e., submicrometer- and micrometer-sized particles were already dispersed with respect to those >100 μm. In thebottom panel another outburst is visible (red arrow). This occurred on 3 July 2015 (Agarwal et al. 2017). In this case, the S/C-comet distance was about 200 km, thus QCM5 did not detect a contemporaneous dust mass increase for submicrometer- and micrometer-sized particles. The cumulative mass of particles >100 μm (bottom panel) is rescaled to the QCM sensitive area.
Current usage metrics show cumulative count of Article Views (full-text article views including HTML views, PDF and ePub downloads, according to the available data) and Abstracts Views on Vision4Press platform.
Data correspond to usage on the plateform after 2015. The current usage metrics is available 48-96 hours after online publication and is updated daily on week days.
Initial download of the metrics may take a while.