Fig. 9
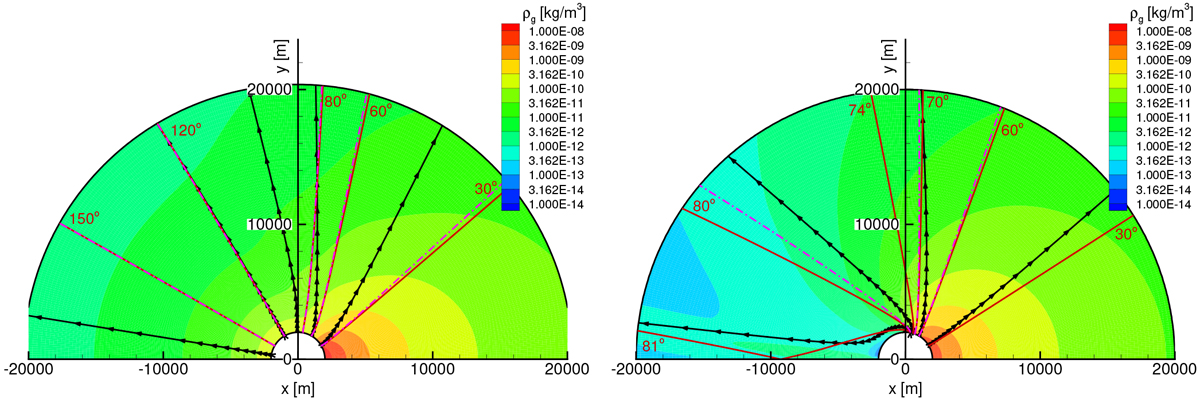
Examples of gas density distribution and dust particle trajectories for two cases of nightside activity: high (left) and weak (right). The gas flow-lines are shown in black, the trajectories of the 9.1 μm and 62 nm dust particles are shown by red solid and magenta dash-dot lines, respectively. The trajectory origins are indicated by the angles.
Current usage metrics show cumulative count of Article Views (full-text article views including HTML views, PDF and ePub downloads, according to the available data) and Abstracts Views on Vision4Press platform.
Data correspond to usage on the plateform after 2015. The current usage metrics is available 48-96 hours after online publication and is updated daily on week days.
Initial download of the metrics may take a while.