| Issue |
A&A
Volume 623, March 2019
|
|
|---|---|---|
| Article Number | A135 | |
| Number of page(s) | 16 | |
| Section | Interstellar and circumstellar matter | |
| DOI | https://doi.org/10.1051/0004-6361/201834016 | |
| Published online | 20 March 2019 | |
Carbonaceous nano-dust emission in proto-planetary discs: the aliphatic-aromatic components★
1
Institut d’Astrophysique Spatiale (IAS), UMR 8617-CNRS, Université Paris Sud,
91405 Orsay, France
2
Institut des Sciences Moléculaires d’Orsay (ISMO), CNRS, Université Paris Sud, Université Paris-Saclay,
91405 Orsay, France
e-mail: This email address is being protected from spambots. You need JavaScript enabled to view it.
Received:
3
August
2018
Accepted:
17
January
2019
Abstract
Context. In the interstellar medium, carbon (nano-)grains are a major component of interstellar dust. This solid phase is more vulnerable to processing and destruction than its silicate counterpart. It exhibits a complex, size-dependent evolution that is due to interactions within different radiative and dynamical environments. Infrared signatures of these carbon nano-grains are seen in a large number of discs around Herbig HAeBe stars.
Aims. We probe the composition and evolution of carbon nano-grains at the surface of (pre-)transitional proto-planetary discs around Herbig stars.
Methods. We present spatially resolved infrared emission spectra obtained with the Nasmyth Adaptive Optics System (NAOS) Near-Infrared Imager and Spectrograph (CONICA) at the Very Large Telescope (VLT) in the 3–4 μm range with a spatial resolution of 0.1′′, which allowed us to trace aromatic, olefinic, and aliphatic bands that are attributed to sub-nanometer hydrocarbon grains. We applied a Gaussian fitting to analyse the observed spectral signatures. Finally, we propose an interpretation in the framework of the The Heterogeneous dust Evolution Model of Interstellar Solids (THEMIS).
Results. We show the presence of several spatially extended spectral features that are related to aromatic and aliphatic hydrocarbon material in discs around Herbig stars, from ~10 to 50–100 au, and even in inner gaps that are devoid of large grains. The correlation and constant intensity ratios between aliphatic and aromatic CH stretching bands suggests a common nature of the carriers. Given their expected high destruction rates through UV photons, our observations suggest that they are continuously replenished at the disc surfaces.
Key words: protoplanetary disks / infrared: planetary systems
The reduced spectra (Fig. 2) are only available at the CDS via anonymous ftp to cdsarc.u-strasbg.fr (130.79.128.5) or via http://cdsarc.u-strasbg.fr/viz-bin/qcat?J/A+A/623/A135
© T. Boutéraon et al. 2019
 Open Access article, published by EDP Sciences, under the terms of the Creative Commons Attribution License (http://creativecommons.org/licenses/by/4.0), which permits unrestricted use, distribution, and reproduction in any medium, provided the original work is properly cited.
1 Introduction
Carbonaceous dust is a major component of the solid matter in the interstellar medium (ISM). It is observed in a wide variety of environments in emission and extinction. Much more sensitive to energetic events than its silicate counterpart, carbonaceous dust has been shown to be highly processed in UV-irradiated regions and in shocks (e.g., Jones 1990; Dartois et al. 2004a,b; Pino et al. 2008; Mennella 2008; Godard et al. 2011; Micelotta et al. 2010a,b). It is thus expected to be sensitive to the local physical conditions in the environments where it is observed. Processing of carbonaceous dust is expected to be reflected in the aromatic and aliphatic near- to mid-IR emission bands that are attributed to sub-nanometer polycyclic aromatic hydrocarbon-like molecules (PAHs; Leger & Puget 1984) or hydrogenated amorphous carbons (a-C:H; Jones 1990, and references therein). a-C(:H) materials, which includes both H-poor a-C and H-rich a-c:H, are a broad family of compounds that include various proportions of polyaromatic units of various sizes that are linked by olefinic and aliphatic bridges. These components, when observed in emission, which are associated with the aromatic phase, should thus exhibit a series of bands between 3.4 and 3.6 μm, in addition to the aromatic 3.3 μm band (e.g. Geballe et al. 1985; Jourdain de Muizon et al. 1990a,b; Joblin et al. 1996; Goto et al. 2003; Pilleri et al. 2015), as well as bands at 6.9 and 7.3 μm (Pino et al. 2008; Carpentier et al. 2012).
Aromatic infrared bands (AIBs) have been observed using the Infrared Space Observatory (ISO), Spitzer, AKARI, and ground-based observations towards proto-planetary discs around pre-main-sequence stars (e.g. Brooke et al. 1993; Meeus et al. 2001; Acke & van den Ancker 2004; Habart et al. 2004; Sloan et al. 2005; Geers et al. 2006, 2007a,b; Keller et al. 2008; Acke et al. 2010; Maaskant et al. 2014; Seok & Li 2017). Based on Spitzer data, the detection rate is ~70% in Herbig Ae stars, ~50% in Herbig Be stars (Acke et al. 2010), and ~10% in T Tauri stars (Furlan et al. 2006; Geers et al. 2006). AIBs are detected only towards a few debris discs (Chen et al. 2006a). Furthermore, mid-IR bands attributed to C–H aliphatic bonds at 6.9 and 7.3 μm have been observed in ~55% of Herbig stars (Acke et al. 2010). The study of the aromatic/aliphatic band ratio in the mid-IR Spitzer spectra (Acke et al. 2010) suggests that strong UV fluxes reduce the aliphatic component and magnify the spectral signature of the aromatic molecules in the IR spectra. However, dehydrogenation caused by UV photons (Muñoz Caro et al. 2001)also reduces the C–H aromatic signatures. Finally, fullerenes have been detected in one disc (Roberts et al. 2012).
Bands between 3.4 and 3.6 μm have also been detected in some Herbig Ae/Be (HAeBe) stars (e.g. Acke & Van den Ancker 2006; Habart et al. 2006). A few of them (two to three) show peculiar strong features that peak at 3.43 and 3.53 μm (e.g. Blades & Whittet 1980; Guillois et al. 1999; Van Kerckhoven et al. 2002. With adaptative optics high angular resolution spectroscopic observations of the HAeBe star HD 97048 and Elias 1, the emission in the strong features at 3.43 and 3.53 μm was spatially resolved (Habart et al. 2004; Goto et al. 2009). Several studies have proposed attributing these features to surface C–H stretching modes on 10–50 nm or larger diamond particles (e.g. Guillois et al. 1999; Sheu et al. 2002; Jones et al. 2004; Pirali et al. 2007). On the other hand, some discs show relatively weak but distinguishable features between 3.4 and 3.6 μm at 3.40, 3.46, 3.51, and 3.56 μm (e.g. Sloan et al. 1997), which may be attributed to aliphatic components. These features were also detected towards photo-dissociation regions (PDRs) in star-forming regions, reflection nebulae, and (proto-)planeatary nebulae (e.g. Geballe et al. 1985; Jourdain de Muizon et al. 1990a,b; Joblin et al. 1996; Goto et al. 2003; Pilleri et al. 2015). Towards a proto-planetary nebula, Goto et al. (2003) found that the relative intensity of the aliphatic feature at 3.4 μm to the aromatic feature at 3.3 μm decreases with the distance from the star. They suggested that thermal processing is likely to account for the spectral variation that reflects the history of the planetary nebula. Towards the NGC 7023 north-west PDR, Pilleri et al. (2015) traced the evolution of the 3.3 and 3.4 μm bands. They showed that the intensity of the 3.3 μm band relative to the total PAH emission increases with the UV flux, while the relative contribution of the 3.4 μm band decreases with the UV flux. The UV photo-processing of very small grains that leads to PAHs with attached aliphatic sidegroups in the lower UV flux region, which then become PAHs in the higher UV flux region, was suggested to explain the spectral variation. Variations in the ratio of the 3.3 to 3.4 micron bands raise the question of the nature and stability of the carriers of these bands and of their excitation mechanisms as a function of the local physical conditions.
It is therefore important to study the aromatic and aliphatic bands in proto-planetary discs, where the carbon nano-grains are likely highly processed, to understand the mechanisms at work on carbon dust. Photo-induced processes may be important at the disc surfaces. Carbon nano-grains, which escape settling, are very well coupled to the gas in the upper disc layers. The AIBs emission arises from the very thin upper disc surface layers that are penetrated by UV photons from the central star, which can be interpreted as a PDR. Because of the stochastic heating mechanism, the emission in the bands is spatially extended (e.g. Habart et al. 2006) and thus enables probing the composition of the disc surface material over large distances, as well as the disc geometry. High AIBs-to-stellar luminosity ratios are observed in targets with a flared disc (e.g. Meeus et al. 2001; Habart et al. 2004; Keller et al. 2008; Acke et al. 2010). Observations of AIBs provide one of the most striking indications for flared discs around HAeBe stars (e.g. Lagage et al. 2006; Berné et al. 2015). Furthermore, AIBs have been detected in the inner disc cavities, where on-going planet formation could have started (e.g. Geers et al. 2007a; Maaskant et al. 2013, 2014; Kraus et al. 2013; Schworer et al. 2017). Recently, near-IR interferometric observations of HAeBe stars tracing the inner part of the warm dusty discs revealed unusually extended near-IR emission (out to ~10 au Klarmann et al. 2017; Kluska et al. 2018). This suggests stochastically heated very small (sub-)nanometer grains in the inner disc parts. Finally, similarly as in PDRs, carbon nano-grains could play a key role in gas heating through photoelectric effects and might thus influence the vertical disc structure (e.g. Meeus et al. 2012). Because of their very large effective surface area, nano-grains are also expected to play an important role in the formation of key molecules (e.g. H2, hydrocarbon molecules) and charge balance. A better knowledge of them is therefore essential to understand disc physics and chemistry.
This study focuses on the near-IR emission between 3 and 4 μm of spatially resolved spectra around young Herbig stars that are orbited by a proto-planetary disc and have been observed with the Nasmyth Adaptive Optics System (NAOS) Near-Infrared Imager and Spectrograph (CONICA; NaCo) at the Very Large Telescope (VLT) in Chile. This is the first study of spatially resolved weak bands in the 3 to 4 μm range in proto-planetary discs. Our aim is to use the aromatic and aliphatic signatures that are detected at the disc surfaces to characterise the size and composition of the sub-nanometer carbonaceous grains. In Sect. 2 we discuss the diversity of the carbonaceous signatures. In Sect. 3 we present the astrophysical parameters and main characteristics of the observed discs. In Sect. 4 we describe the observations and data reduction. In Sect. 5 we present the observational results, the fitting method for the spectral signatures, and the identified bands. In Sect. 6 we briefly describe the THEMIS framework, which is a global model within which dust composition, evolution, and signatures can be analysed. In Sect. 7 we discuss the results and their astrophysical implications.
2 Variability in carbonaceous signatures
Figure 1 presents the diversity of the features that are related to hydrogenated amorphous carbonaceous (a-C:H) materials in the 3–4 μm near-IR range where C–H stretching vibrational modes are observed. These vibrational modes are particularly interesting because they characterise the bonds between carbon and hydrogen atoms that vary according to their local environment (closest neighbours).
Figure 1 illustrates these variations for the related signatures of two major types of laboratory experiments. Four experiments feature a-C:H deposited on thin-film samples (Dartois et al. 2005, 2004a; Ristein 1998; Dischler 1987), and one experiment focuses on soot nano-grains, which have disordered carbon nano-structurations and were produced in flames (Pino et al. 2008). An analysis was made using IR absorption spectroscopy. The experiments of these studies give an overview of the variability in features that are related to carbonaceous materials, and they highlight the difficulty of signature assignments. The assignment of the band origin in the 3.22–3.32 μm range is stillquite uncertain because four or five vibrations overlap in this region.
Table 1 lists the assumed signature assignments, their band centre and width ranges, in wavelengths and wavenumbers. These modes correspond to C–H stretching (str) vibrational modes. We distinguish three main types of bonds: aromatics, olefinics, and aliphatics. Representations of these vibration modes are given in Fig. 1. The aromatic band at 3.3 μm corresponds to the vibration of hydrogen bonded to a carbon included in an aromatic cycle and labelled sp2 (hybridisation state) CH aromatic (aro.). Its band centre varies from 3.268 to 3.295 μm and its width from 0.005 to 0.057 μm. Olefinic (ole.) modes correspond to the vibration of the CH or CH2 group where the carbon atom is engaged in a C=C bond. The CH2 asymmetric (asy) mode varies from 3.240 to 3.249 μm with a width between 0.014 and 0.045 μm. It is less variable than its symmetrical (sym) counterpart, for which the band centre varies from 3.350 to 3.396 μm and the width between 0.003 and 0.028 μm. A third olefinic mode involving only the CH group occurs at an intermediate wavelength between 3.311 and 3.344 μm with width variations between 0.008 and 0.062 μm. These modes are related to a sp2 planar hybridisation, where one carbon atom forms bonds with three other atoms.
Two types of aliphatic (ali.) modes can be distinguished in the CH stretch region: those that originated in the CH3 and CH2 functional group, with their asymmetric and symmetric characters. The CH3 aliph asy mode varies from 3.378 to 3.84 μm and its width varies between 0.008 and 0.033 μm, while the CH2 aliph asy mode varies from 3.413 to 3.425 μm and its width varies between 0.006 and 0.034 μm. At longer wavelength, the CH3 aliph sym mode varies from 3.466 to 3.486 μm and its width varies between 0.006 and 0.034 μm, while the CH2 aliph sym mode varies from 3.503 to 3.509 μm and its width varies between 0.006 and 0.051 μm. A fifth mode related to the aliphatic CH can be found at a wavelength intermediate between symmetric and asymmetric modes. It is labelled tertiarty, and its band centre varies from 3.425 to 3.47 μm and its width varies between 0.006 and 0.036 μm. All aliphatic modes have a sp3 hybridisation in which carbon atoms are bonded to four other atoms.
In the following, observational data are compared to the THEMIS model (Jones et al. 2017, 2013), which takes into account vibrational modes from the thin-film experiments described above. The bands included in THEMIS (assignment and characteristics) are also plotted in Fig. 1 for comparison. A typical spectrum from the disc observation and spectrum from the PDR NGC 7023 (Pilleri et al. 2015) are also plotted for comparison. Obvious differences between laboratory data, observations, and the model are found. They are discussed in Sect. 6.
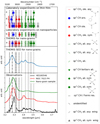 |
Fig. 1 Top panel: band centre (line) and width (transparent box) of the spectral signatures related to a-C:H materials obtained in laboratory experiments on thin film or on nano-grains in the mid-IR range where C–H stretching vibrational modes are observed. We show the aromatic compound (blue), olefinic (red) and aliphatic (green) bonds, and other non-assigned signatures (grey). The signatures used in the THEMIS model are based on these experiments and are drawn in row a. They are extended by vertical lines for aromatics (dash-dotted), olefinics (dashed), and aliphatics (dotted). Middle panel: SED for an H-poor, aromatic-rich grain population from the THEMIS model, calculated with DustEM. Bottom panel: characteristic spectrum from our study that shows the whole diversity observed in this range around the Herbig star HD 100546. Spectra from the PDR NGC 7023 (Pilleri et al. 2015) and nano-particles (Carpentier et al. 2012; related to the study of Pino et al. 2008) are also plotted for comparison. The signatures in the right panel are labelled and a schematic view of vibrational modes is given. a: Jones et al. (2017), b: Pino et al. (2008), c: Dartois et al. (2004a), d: Ristein (1998), and e: Dischler (1987). |
3 Selected (pre-)transitional discs
Our sample consists of four well-known Herbig Ae/Be stars, all with evidence of a circumstellar disc that is thought to be in transition from a gas-rich proto-planetary disc to a gas-depleted debris disc. The four discs show clear evidence of flaring based on modelling their spectral energy distribution (SED; Meeus et al. 2001), and IR and millimeter interferometry observations (detailed descriptions of the discs and the associated references are given in Appendix A). Furthermore, it has recently become clear that these four discs show many spatial structures, such as annular gaps and rings in the large grain emission distribution near the mid-plane, as seen in millimeter and in the near-IR scattered stellar light by μm grains. Large-scale spiral arms are also seen in scattered light. In the innermost few astronomical units (au), evidence for a radial gap separating an inner disc (from ~0.1 to few au) and the outer main disc (from ~10 to 100 au or more) was found using near- and mid-IR observations. Some of these structures could be tracing on-going planet formation. Planet candidates have been found around two of our discs: HD 100546 (e.g. Quanz et al. 2015; Currie et al. 2015)and HD 169142 (Biller et al. 2014; Reggiani et al. 2014; Osorio et al. 2014). However, as discussed by several authors, the observed disc structures could also result from gravitational perturbations by binary stars, disc dynamical evolution (e.g. gas accretion from the surrounding molecular cloud and local maximum pressure), or dust evolution.
These discs have been observed at different wavelengths using ISO, Spitzer, and ground-based spectroscopy, all showing aromatic emission features and possibly aliphatic emission features (Meeus et al. 2001; Acke & van den Ancker 2004; Sloan et al. 2005; Habart et al. 2006; Geers et al. 2007b; Keller et al. 2008; Acke et al. 2010; Seok & Li 2017). In Table 2 we report(i) the astrophysical parameters of each star (spectral type, effective temperature, luminosity, mass, age, distance, and G0, i.e., far-UV flux strength at 50 au from the star in terms of the Habing field (Habing 1968), and (ii) the dust spectral characteristics (presence of aromatic and aliphatic features). We also list the strength of the 3.3 μm aromatic emission feature measured from the ISO spectra of Meeus et al. (2001) and Van Kerckhoven et al. (2002). Estimates of the radial spatial extension of the 3.3 μm aromatic emission feature (FWHM) measured from ground-based spatially resolved observations are also reported.
Band centre (λ0, ν0) and FWHM variations in laboratory experiments.
4 Observations and data reduction
Observations were performed using a long slit in the L band, between 3.20 and 3.76 μm, with the NaCo at the VLT. The on-sky projection of the slit is 28′′ long and 0.086′′ wide, whichcorresponds to the diffraction limit in this wavelength range. The pixel scale is 0.0547′′ and the spectral resolution is R = λ∕Δλ ~1000. We took several slit positions, one centred on the star, and the other slits shifted by one half-width. Seven or nine positions allowed us to extract spectra on an area centred on the of 2′′ × 0.258′′ or 2′′ × 0.354′′, respectively. The long slit was aligned north-south, except for HD 100546. For HD 100546, the long slit was aligned with the major axis of the disc as resolved in scattered light (Augereau et al. 2001; Grady et al. 2001), with a position angle of ~160 degrees measured east of north. The integration time per slit was three minutes. The data-set reference is 075.C-0624(A), and observationscharacteristics are summarised in Table 2.
Ground-based near-IR spectroscopic observations involve the use of a standard procedure to subtract the atmosphericcontribution. For each disc, we employed the standard chopping/nodding technique with a throw of ~9′′ in the north-south direction in order to correct for the atmospheric and instrumental background. Telluric bands due to the atmosphere were used for the wavelength calibration of spectra. They were removed using standard stars observed during each data-set acquisition. To compensate for the airmass variation between the observations of the disc and thestandard star, a scaling factor was applied to the standard star spectrum to optimise telluric band subtraction.
5 Results
5.1 Extraction, decomposition, and characteristics of the spectra
For the four discs, spectra were extracted from pixels for each slit on either side of the central star, covering a star-centred area of 2′′ × 0.258′′ or 2′′ × 0.354′′. Because we focused on the carbonaceous dust emission evolution, we extracted the features from the original data by subtracting an underlying continuum. The continuum was subtracted with a polynomial of order three considering ranges where bands are absent, that is, the 3.6–3.7 μm range, and 3.2 μm. The intensity at 3.35 μm was used to constrain the polynomial so that the continuum was not higher than the signal. The spectra show similar structures for the four discs: the 3.3 μm aromatic feature, at least five features between 3.4 and 3.6 μm (cf. Fig. 3), and the hydrogen recombination lines Pfund 9 and 8 at 3.297 and 3.741 μm.
To interpret the shape and evolution of the features that move away from the central star, we considered a heterogeneous widening, assuming several carriers associated with the same signature, and made a Gaussian decomposition of the spectra based on the experiments discussed in Sect. 2. The size, temperature, structure, and even composition of the various carriers imply that the signature is composed of multiple components. A good approximation of these signatures is thus a series of Gaussian profiles. We used eight Gaussians:
-
3.3 μm: related to the C–H stretching mode of aromatics.
-
3.4, 3.43, 3.46, 3.52, and 3.56 μm, which most probably are associated with aliphatic materials.
-
3.297 and 3.741 μm, which are the recombination lines Pfund 9 and 8 of hydrogen.
The decomposition was made on the continuum-subtracted spectra expressed in wavenumber. The initial parameters and their tolerance range are summarised in Table 3. A zoom of the decomposition is presented in Fig. 3.
We optimised the parameters for each Gaussian using the Powell method. If the amplitude of the 3.3 μm band was three times lower than the mean noise of the underlying continuum, the spectrum was excluded. Then, we averaged the spectra according to their distance from the star, considering a step of 0.1′′, which corresponds to the spatial resolution of the instrument. Figure 2 presents the characteristic spectra according to the distance to the central star. These are normalised to the continuum at 3.2 μm and thus show the evolution of the signatures relative to the continuum. The main observation is that all the discs exhibit similar spectral signatures: a 3.3 μm aromatic feature, and other features in the 3.4–3.6 μm range (Fig. 2).
Figure 3 shows details for one characteristic spectrum. For the 3.3, 3.4, and 3.46 μm bands, the FWHMs are similar, but they are narrower for the 3.43 and 3.52 μm bands. The FWHM of the 3.56 μm band is broader, but the feature is poorly fitted. The hydrogen Pfund recombination lines are very close to their theoretical values, 3.297 and 3.741 μm, with a narrow FWHM; this confirms the good wavelength calibration of the data. The decomposition method gives similar results for the other spectra. In the following, we focus on similarities and variations of these signatures.
Top part: astrophysical parameters of the selected discs. Bottom part: summary of the observations.
Initial parameters of the Gaussian decomposition method.
5.2 Detection of the bands towards the disc
Aromatic and aliphatic bands are detected in HD 100546 between 0.2 and 0.9′′ (20–100 au) in the main outer disc (see Fig. 2). In HD 100453, they are seen between 0.1 and 0.4′′ (10–40 au) to cover an area that includes the gap that extends up to 20 au and the external disc. Likewise, in HD 169142, signatures are detected between 0.1 and 0.4′′ (10–45 au), which includes part of the two gaps detected between 1 and 20 au and between 30 and 55 au. In HD 179218, bands are detected between 0.1′′ and 0.5′′ (30–120 au). A gap exists out to 10 au. The data do not allow us to probe the inner part of the disc. Interestingly, for most of the discs, the IR band carriers seem to be present in the main disc regions and also in the gaps, which is in contrast to the situation for large grains (see references in the Appendix A).
5.3 Intensity variations
For each disc, Fig. 4 shows the intensities of each a-C:H emission band between 3.4 and 3.6 μm as a function of the intensity in the 3.3 μm aromatic band. These values come from the decomposition results of the individual pixel spectra that meet the selection criteria we discussed previously. For HD 100546, HD 100453, and HD 169142, the values are mostly distributed linearly. For HD 179218, the distribution is less clear. The Spearman rank correlation coefficients that describe the monotonic relationship between two variables show a good correlation between the 3.4 to 3.6 μm features and the 3.3 μm feature. Theemission in aromatic and aliphatic bands in this wavelength range is very sensitive to the particle size. Moreover, this spatial correlation suggests that the band carriers are stochastically heated and have a similar size distribution.
Figure 5 presents the distribution ratio values for the 3.4–3.6 μm signatures to the 3.3 μm band as a function of the distance from the star. For HD 100546, HD 100453, and HD 169142, the 3.4/3.3, 3.43/3.3, 3.46/3.3, and 3.52/3.3 ratios are of the same order and have a narrow dispersion without significant evolution as a function of the distance from the star, except for the ratio 3.43/3.3 for HD 100546, which has a larger dispersion. For HD 179218, the ratios are lower by ~1.4. As specified in Table 2, HD 179218 is more luminous than the three other stars, therefore we expect carbonaceous materials to be differently processed as a result of the very different physical conditions. The aliphatic bonds, which are more fragile than the aromatic rings, are expected to be the first to break under UV processing.
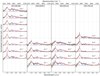 |
Fig. 2 NaCo-averaged spectra (black) for different distances from the star in 0.1′′ steps. Gaussian decomposition (in red) for each spectrum. Spectra are normalised to the continuum at 3.2 μm. |
5.4 3.3 μm band
In this section, we investigate the position and width of the 3.3 μm feature. Previous studies have pointed out that the 3.3 μm feature is composed of two sub-bands: one band peaks at 3.28 μm, and the other at 3.30 μm (Sadjadi et al. 2017; Candian et al. 2012; Song et al. 2003; Tokunaga et al. 1991; Hammonds et al. 2015; Kwok & Zhang 2011). In particular, Tokunaga et al. (1991) classified the 3.3 μm band into two types. Type 1 peaks at 3.289 μm and has a width of 0.042 μm. It is observed in numerous objects, such as planetary nebulae and HII regions. Type 2 peaks at 3.296 μm and has a narrower width of 0.020 μm, which is observed in pre-main-sequence and evolved stars. Tokunaga et al. (1991) noted that laboratory data did not allow a particular assignment to the features and proposed that Type 2 bands are best fitted by amorphous aromatic materials and Type 1 bands by heated PAHs. As suggested in Fig. 5, the carriers of the bands are likely due to a single material. A series of studies distinguished between Type 1 and Type 2 in the 3.3 μm band and investigated the origin of this band in the Red Rectangle in emission (Song et al. 2003; Candian et al. 2012) and along a diffuse line of sight towards the Galactic centre (Chiar et al. 2013). While Candian et al. (2012) proposed that the 3.28 μm feature comes from the structural organisation of the PAHs, Chiar et al. (2013) suggested an aliphatic origin for the 3.28 μm band because of the stretching mode of olefinic C-H bonds in amorphous hydrocarbons. In another study, Sadjadi et al. (2017) performed quantum-mechanical calculations on aromatic, aliphatic, and olefinic compounds and proposed assigning the 3.28 μm feature to aromatics and the 3.30 μm to olefinics.
The averaged band centre and width of the 3.3 μm band and variations with distance from the star are listed in Table 4. The band centre agrees with the laboratory experiment values reported in Table 1. For the all discs, the width between 0.055 and 0.089 μm is globally higher than the highest width of 0.057 μm measured in the laboratory, even though uncertainties could explain this difference in some cases. The averaged band centre and width of theother features and their variation ranges are listed in Table 5.
In Fig. 6 the parameter values of the band centre and FWHM based on the decomposition of pixel spectra are plotted as a function of the distance from the star. In the bottom panels, the FWHM is plotted versus band centre. The variations are reportedin Table 4. In HD 100453 and HD 179218, the average band centre decreases with distance from 3.30 μm to 3.29 μm. In HD 100546 and HD 169142, the band centre remains constant at 3.295 μm, moving away from the star. In all the discs, the FWHM first decreases and then increases with distance from the star. Wealso note that in HD 179218, the FWHM increases for band centres at longer wavelength. This suggests that close to 3.28 μm, the carrier of the feature probably is more aromatic, and around 3.30 or 3.32 μm, it probably is more olefinic or aliphatic (Sadjadi et al. 2017; Chiar et al. 2013). In this case, a narrow width would mean that one component dominates when a broader one would represent both components. This aspect is explored in more detail in Sect. 6. For HD 100453 and HD 179218, the 3.3 μm band centre seemsto shift from higher to lower values with distance from the central star. A priori, this is unexpected given the known behaviour of carbonaceous materials that are irradiated by UV photons. Close by the star, we expect that amorphous aliphatic materials would be aromatised by the more intense UV photon flux (e.g. Jones 1990; Dartois et al. 2004a,b; Pino et al. 2008; Mennella 2008; Godard et al. 2011). Variations in the centre and width of the band suggest chemical processing (e.g. increasing contribution of olefinic-to-aliphatic bridges withincreasing distance to the star) that is complex and difficult to interpret; it requires further study to allow definitive conclusions. The 3.3 μm band evolution could thus be used as a diagnostic probe of the carbonaceous dust composition.
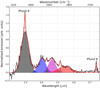 |
Fig. 3 NaCo-averaged spectrum (black) of HD 100546 at 0.4′′ or 40 au from the star. The Gaussian decomposition is shown by the red curve, and the hydrogen recombination lines are plotted in grey. Individual contributor spectral signatures are identified at 3.3 μm (black), 3.4 μm (blue), 3.43 μm (green), 3.46 μm (magenta), 3.52 μm (cyan), and 3.56 μm (red). The spectrum is normalised to the continuum at 3.2 μm. |
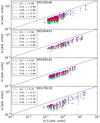 |
Fig. 4 Aliphatic/Aromatic band intensity correlation. Points show the intensity (amplitude ×σ) of the 3.4 (blue), 3.43 (green), 3.46 (magenta), 3.52 (cyan), 3.56 (red) μm band as function of the 3.3 μm band intensity. For each set, the Spearman coefficient r is calculated. |
5.5 3.4–3.3 μm band ratio
The top panel in Fig. 5 shows values of the ratio between the 3.4 to 3.3 μm bands as a function of the distance from the star. Values of the averaged ratio are reported in Table 6. The ratio does not vary significantly with the distance, while the radiation field intensity at the disc surface decreases by several orders of magnitude.
A previous study by Pilleri et al. (2015) focused on spatially resolved spectra of the PDR NGC 7023 with AKARI and showed an increase in the 3.4/3.3 ratio when the far-UV flux G0 decreases. In order to compare our results with those of Pilleri et al. (2015), we applied our decomposition method (see Sect. 4) to their data to calculate the 3.4/3.3 ratio. We obtain higher ratios, but they vary in the same way with G0 as was found by Pilleri et al. (2015) (Table 7).
Figure 7 shows the 3.4/3.3 ratio versus G0 for NGC 7023 and the four discs. To calculate G0 at different distances from the central star in discs, we considered a blackbody with the effective temperature and stellar luminosity given in Table 2. The aliphatic-to-aromatic ratio does not appear to vary significantly between PDRs at the molecular edge and disc surfaces. Assuming a constant gas density, with the orders-of-magnitude higher UV flux expected in our disc sample, with the Pilleri extrapolation, we would expect a very low 3.4/3.3 ratio, and a rapid dehydrogenation of the carriers following experiments. However, the emission in the 3–4 μm range depends not only on the UV flux, but also on the (re-)hydrogenation rate, which in turn depends on the gas density. Thus, the observation of an aliphatic-to-aromatic ratio that varies little may suggest either a recent exposure of the carriers to the radiation field (by a continuous local vertical replenishment at the disc surface) before their destruction or conversion, and/or that the ratio of G0 /nH may be a better parameter to consider, and not the UV flux alone. In discs, the gas density is expected to be much higher than in PDRs and must increase when we approach the star.
To proceed in understanding the 3.4/3.3 ratio as a function of the local physical conditions, we considered the intensity of the radiation in relation to the local gas density. Based on the model of Woitke et al. (2016), who considered a disc in thermal andhydrostatical equilibrium, the gas density at the upper surface of the disc at the radial optical depth Av = 1 can be estimated to be about nH = 109 and 107 cm−3 at 10 and 100 au, respectively, from the central star (see their Fig. 4 for their reference model). Thus, considering that G0 scales as the inverse squared distance to the illuminating star, we can estimate that G0 /nH does not vary to first order between 10 and 100 au. This could explain a 3.4/3.3 ratio that does not vary much with distance from the star in the discs. At the radial optical depth Av = 1 and considering  , the far-UV strength at 50 au (see Table 2), we can roughly estimate the G0 /nH ratio as a function of the distance d from the star by
  . We find G0 /nH ~ 0.04 for HD 100546, ~0.002 and ~0.004 for HD 100453 and HD 169142 and ~0.15 for HD 179218 at 10 or 100 au. The 3.4/3.3 ratios in HD 100546, HD 100453, and HD 169142, are comparable to those at the P2, P3, and P4 positions in the PDR NGC 7023. In HD 179218, the 3.4/3.3 ratio is between that found for the P1 and P2 positions in the cavity and the PDR edge.
For NGC 7023, estimates of G0 can be found in Pilleri et al. (2015) and of nH (the total number of hydrogen nuclei) in Kühler et al. (2014). This gives (i) G0 /nH = 102 in the cavity (ionised region – position P1); (ii) G0 ∕nH = 0.26–2.6 at the PDR edge (position P2); (iii) G0 /nH = 1−2 × 10⁻² in the PDR (Av ~ 1 – position P3); and (iv) G0 /nH = 10−3–2.5 × 10⁻⁴ in the PDR (Av ~3 – position P4). The 3.4/3.3 ratio is low in the cavity (P1) and remains constant towards the PDR even if G0 ∕nH varies by several orders of magnitude. By combining the PDR and disc results, we find that the 3.4/3.3 ratio is roughly equal to 0.3–0.4 for G0 /nH ≤ 10−2, but it decreases to ~0.2 for G0∕nH ≥ 10−1.
In conclusion, the 3.4/3.3 band ratios observed in discs are comparable to those observed in PDRs, and interestingly, they do not depend on the far-UV strength over density ratio beyond a certain threshold. However, a more detailed study of the disc shape and irradiation conditions is needed to estimate the physical conditions (G0, nH) at the disc surfaces more accurately. A specific radiative transfer code for each disc with the appropriate structure (cavities and gaps) is required.
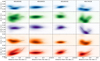 |
Fig. 5 Aliphatic/Aromatic band intensity ratios according to the distance from the star. Point densities show the band ratios (amplitude ×σ) of the3.4 (blue), 3.43 (green), 3.46 (magenta), 3.52 (orange), 3.56 (red) to the 3.3 μm band vs. the distance from the star. The point densities are plotted instead of points to highlight the variations. The median value of the ratio is plotted as a black solid line. |
3.3 μm band characteristics and variations as a function of the distance from the star (d).
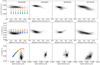 |
Fig. 6 Top panels: 3.3 μm band centre as a function of the distance from the star. Middle panels: 3.3 μm FWHM as a function of the distance from the star. Bottom panels: 3.3 μm FWHM over the band centre. For HD 100546, which is shown in the left panels, values are reported from THEMIS varying band gap from 0.1 eV (magenta) to 0.6 eV (red, as rainbow colours). Top two panels: size increases from bottom to top (for the same colour). Bottom panels: size increases from right to left. |
Band centres, widths, and variation ranges for each disc (d).
Ratios of the 3.4–3.3 μm bands for each disc.
Ratios of the 3.4–3.3 μm bands for NGC 7023.
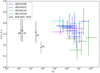 |
Fig. 7 3.4/3.3 ratio as a function of G0. The black dot shows the band ratio in PDR NGC 7023 (based on Pilleri et al. 2015). Stars show the band ratio for each disc and different distances to the central star. For the disc, the G0 has been estimated from a blackbody associated with the parameters of the central star (temperature and luminosity). The error bars for the 3.4/3.3 ratio are the dispersion of ratio values for the considered distance. The error bars for G0 correspond to the values for the considered distance inside the VLT/NACO beam. |
6 Modelling
The heterogeneous dust evolution model for interstellar solids (THEMIS)1 is based on data derived from laboratory experimentsand is described in detail elsewhere (Jones 2012a,b,c; Jones et al. 2013, 2017; Kühler et al. 2014). THEMIS has been used before to analyse dense cloud observations (Kühler et al. 2015; Jones et al. 2016; Ysard et al. 2016), dust in the Magellanic Clouds (Chastenet et al. 2017) and other nearby galaxies within the Dustpedia project2. We are here mostly interested in the emission from stochastically heated nano-grains, therefore we briefly summarise the essentialelements pertaining to these particles of THEMIS, which have radii from 0.4 nm to several tens of nanometers and a power-law size distribution that steeply declines in abundance with increasing radius. These nano-grains are primarily of amorphous, hydrogen-poor a-C composition and principally consist of poly-aromatic units linked together by olefinic/aliphatic bridges. These grains are rendered hydrogen-poor through the effects of photolytic dehydrogenation by the ambient interstellar UV radiation field in the diffuse ISM (Jones 2012a,b,c). The composition, structure, and optical properties of the THEMIS carbonaceous grains, which contain aromatic, olefinic, and aliphatic sub-components, were calculated using the extended random covalent network (eRCN) model for H-rich a-C:H and a defective graphite (DG) model for H-poor grains (Jones 2012a,b). The carbonaceous material properties are principally determined by their band gap, and the associated optical properties were calibrated using the available laboratory data as described in detail in Jones (2012a,b).
For grains with radii ≤20 nm, the size of the aromatic clusters is necessarily limited. As derived in Robertson (1986), the band gap depends on the size of these clusters. For a given composition, the smaller grains therefore have a larger gap than their bulk counterpart (Jones 2012b,c). This last point is taken into account in THEMIS with the definition of an effective band gap that depends upon the particle size. Thus, and in order to avoid any ambiguity in the following, we adopted the bulk material band gap in our description, with the advisory that in general, the effective band gap is largerthan the bulk material band gap (Jones 2012c).
In THEMIS the spectroscopic assignments for the C–H and C–C vibrational modes were based on the available laboratory spectroscopic data (Jones 2012a). The parametrised band characteristics are a compromise given the diversity encountered in laboratory data (see Fig. 1) and observed through the interstellar IR emission bands. Thus, the THEMIS IR spectral predictions are globally and qualitatively consistent with the observed laboratory and astronomical spectra. In particular, THEMIS can self-consistently explain the 3.3 μm band and its associated side bands in the 3.4−3.6 μm region. However, the current model is not able to explain the details of the observed emission spectra, that is, the band positions do not always agree with the observed bands, and as attested by the data presented in Fig. 1, neither are any of the available laboratory data sets. Thus, it appears that conditions in the laboratory cannot yet be made to match all the environments for the IR carriers in space, and we therefore have not yet achieved completely satisfactory spectral fits of the models to the data. Additionally, the THEMIS model predictions were made for dust in the diffuse ISM, whereas the best IR emission band spectra are generally for PDR regions with generally more intense and harsher radiation fields.
In our exploration of the dust model parameter space, the THEMIS model grid contain almost 200 spectra for a given disc as a function of distance. These were calculated using DustEM3, a numerical tool for dust emission and extinction (Compiègne et al. 2011).
Using THEMIS in its current form, we calculated a model grid for each disc and explored the nature of the THEMIS nano-grains as a function of three parameters:
- 1.
the distance from the star, which translates into the local radiation field expressed in terms of G0,
- 2.
the grain composition, in terms of the material effective band gap, Eg, which is explored over the range Eg = 0.0−2.5 eV, that is, from aromatic-rich materials (Eg ~ 0 eV) to aliphatic-rich, a-C:H like materials (Eg > 2 eV), and
- 3.
variations in the minimum size of the carbonaceous nano-grain size distribution ranging from amin = 0.4 to 1.0 nm. For greater sizes, the distributuion follows that of Jones et al. (2013).
Figure 8 shows an example of the wide variability in SED allowed by THEMIS. From the top left panel to the bottom right panel, the gap increases, that is, underlying carriers vary from aromatic materials (small gap) to aliphatics (large gap). Increasing the gap leads to a switch-over of the aromatic signature (black dash-dotted line) at 3.3 μm to olefines and aliphatics signatures (grey dashed and magenta dotted line) between 3.4 and 3.6 μm for higher gaps. In each panel the colour traces are SEDs with different minimum sizes of the smallest grains in the distribution size. This illustrates the prevalence of the surface or bulk effects. The emission properties of the smallest grains vary rapidly with size, in particular, the band/continuum ratio. The choice of this range of minimum size allows us to illustrate these variations. For small gaps, with increasing minimum size, we note an increase in continuum emission and a decrease in band emission that is due to both the surface and bulk effect and to the effectively smaller gap for larger grains, which are less strongly limited by the size of aromatic clusters (Jones 2012a). For large gaps, the continuum emission remains weak with increasing size because the aromatic units are too small to allow emission at these wavelengths.
Thus, a first exploration was made throughout the grid to compare to the observations. We focused on HD 100546, which is the disc for which the spectra cover the widest range of distances from the star. The radiation field was modelled by a blackbody with the temperature and luminosity of the central star, that is, 10 500 K and 32 L⊙. The field intensity G0 was calculated for steps of 0.1′′ (the star is located at 103 pc). For each distance from the star, the SED was simulated for several sets of parameters of band gap Eg and minimum size amin. To compare this to the observations, we then used the decomposition method presented in Sect. 4 on the model data to obtain the parameters of the Gaussian functions. The model spectra were normalised to the observational spectrum at 0.2′′.
The results are presented in Fig. 9. Figures B.1 and B.2 show the comparison with other parameter sets. In the left panel we plot the results of the model decomposition (the similar aspect is due to the normalisation). In right panel we show the relative intensities in the bands in the same plot as in Fig. 4. For Fig. 9, where amin = 0.5 nm and Eg = 0.1 eV, the intensities obtained after normalisation match the observations in terms of the relative order of the distribution between the signatures for bands at 3.4, 3.43, 3.46, and 3.52 μm and in terms of the intensities (derived from the field intensity G0). When amin varies from 0.5 to 0.4 nm (Fig. B.1), we observe a global shift to higher intensities. When the effective gap increases from 0.1 to 0.2 eV (with amin = 0.5 nm, Fig. B.2), intensities of aliphatic bands increase with respect to the 3.3 μm band. The intensity of the signature at 3.56 μm seems to be underestimated when we consider amin = 0.5 nm and Eg = 0.1 eV. As first described in Sect. 5.1, the fit of the 3.56 μm feature does not match very well. The decomposition method and THEMIS assume that observed signatures come from a-C:H materials that contain only carbon and hydrogen atoms. Thus, we speculate that the 3.56 μm feature could be explained by the chemical composition of the dust, such as inclusions of hetero-atoms of nitrogen or oxygen. As reported by Tallent & Siewers (1956) and Goebel et al. (1981), some carbonaceous materials with nitrogen or oxygen do have signatures around 3.56 μm. In the particular case of possible oxygen inclusion, some features expected in the mid-IR wavelength range may be searched for. With the inclusion of nitrogen in the aromatic network, this would be less evident as the infrared activity of potential new modes may be weak, but could influence and shift the position of some of the mid-IR aromatic modes (Socrates 2004).
Finally, as shown in Fig. 6 (bottom panel) in Sect. 5.4, we explored the width variation according to the band centre shift of the 3.3 μm band. In THEMIS, the increases in Eg (i.e., change in the grain composition) and amin drive the increase in width and the shift of the band centre to longer wavelengths. This argues for multiple components for the 3.3 μm band, from aromatic composition close to 3.28 μm and hybrid aromatic-olefinic composition close to 3.30 μm.
For the whole spectrum, we note that the fit is not perfect. As explained above, THEMIS was developed for the diffuse ISM, and the signatures in this wavelength range present a great variability. Nevertheless, if the decomposition method does not use all signatures of the model, it fits signatures related to the same type of materials (aliphatics) that evolve in the same way, as indicated by the correlation in Fig. 4. This first exploration allows us some interpretations of the dust composition and size, but we recall that uncertainties remain high about the radiation field intensity, especially because of the large spatial scale covered by one spectrum where G0 varies quickly, and because analysis is based on averaged spectra for each distance and does not consider local variations due to the structure. By confirming that dust in HD 100546 is composed mostly of aromatic-rich sub-nanometer grains with aliphatic and olefinic components, these results indicate that THEMIS is useful for modelling dust in discs and sets limits on the composition and size of dust. Nevertheless, a more detailed study has to be conducted to fully and definitively understand the observed variations and their origin.
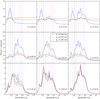 |
Fig. 8 Spectral energy density in the 3.2–3.8 μm range calculated with THEMIS for a radiation field intensity G0 = 2.5 × 10⁷ similar to that found in discs. The calculation was made with DustEM. From top right to bottom left, the band gap varies from 0.1 eV to 2.4 eV. In each subplot, the SED is plotted for several minimum sizes of grains. |
7 Conclusions
We presented NaCo/VLT spectroscopic observations in the 3 μm region of a small sample of HAeBe stars. These data allowed us for the first time to spatially resolve the disc emission in the bands related to aromatic and aliphatic materials. Band assignments to aliphatic features is a complex question because of their high variability in terms of band positions and widths.
- 1.
This work confirms the presence of features that are related to aromatic and aliphatic materials in discs around Herbig stars. These features are observed in a wide spatial range of the discs (from about ~10 to 100 au), even if the innermost parts of these discs remain inaccessible to our observations.
- 2.
The various far-UV radiation conditions and correlated intensities of aliphatic features with aromatic features argue in favour for the common nature of the carriers, which are stochastically heated nano-grains. If there were distinct populations of carriers with significantly different sizes, there would be no reason to have spatially correlated features.
- 3.
No strong variations in band ratios (aliphatic/aromatic) according to the distance from the star are observed. This suggests that features vary in a similar way: the same location and the same intensity. It also argues for grains with a mixed composition that is relatively stable. However, at a given distance, the dispersion of the values varies and depends on the data quality and intrinsic decomposition variations, but also on the physical dispersion that is due to these processes: aromatisation (due to UV irradiation), amorphisation, fragmentation, and internal dynamics. An important point to consider is that the aliphatic bonds, which are more fragile than the aromatic rings, are expected to be thefirst to break under UV processing. Thus, no strong variation in aliphatic-aromatic band ratios suggests that a continuous replenishment at the disc surface is at work. This is supported by the fact that nano-grains of comparable size are observed throughout the discs, whereas the smallest grains would be expected to be destroyed in the most highlyirradiated areas. Photo-induced and/or collisional fragmentation of larger grains that may be important at the disc surfaces might be a process to explain the replenishment of the nano-grain component.
- 4.
The 3.4/3.3 band ratios observed in discs are comparable to those observed in PDRs and appear to notonly depend on the far-UV strength, but also on the gas density. Interestingly, the 3.4/3.3 ratio does not depend on the far-UV strength over density ratio beyond a certain threshold (of G0∕nH ≤ 0.01).
- 5.
The band centre and FWHM variations in the 3.3 μm band suggest multiple components of the feature with aromatic/olefinic composition. Evolution depends on the disc, however, and remains unclear.
- 6.
This first comparison with THEMIS gives a reasonable but imperfect match to the observations: this is expected because THEMIS was developed for the diffuse ISM.
- 7.
The relative order of IR features is well reproduced with THEMIS for a nano-grain population with Eg = 0.1 eV and amin = 0.5 nm.
This work raises new questions about the nature of the observed signatures and their underlying carriers. In our follow-up work, we will characterise the processing times of dust grains at the disc surface (photo-dissociation, recombination, dehydrogenation) to understand the process of their replenishment. To detect the bands and sub-bands of carbon dust in its many forms, which can be weak in a strong continuum, the combination of high spatial and spectral resolution and sensitivity is essential. The forthcoming observations with the MultiAperTure mid-Infrared SpectroScopic Experiment (MATISSE) at the VLT and with the James Webb Space Telescope will provide data that will allow further analyses and interpretations.
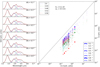 |
Fig. 9 Left panel: decomposition of the continuum-subtracted spectra calculated with DustEM for a radial field intensity that is consistent with what is expected for HD 100546. All the spectra are normalised to the continuum at a distance of 0.2′′. Right panel: correlation between intensities in bands at 3.4, 3.43, 3.46, 3.52, 3.56 μm and the band at 3.3 μm, underlined by those calculated for pixels of HD 100546 that were previously shown in Fig. 4. |
Acknowledgements
We thank our referee, A. Candian, for the care and quality of her comments and suggestions that greatly improved the clarity of this paper. This work was based on observations collected at the European Southern Observatory, Chile (ESO proposal number: 075.C-0624(A)), and was supported by P2IO LabEx (ANR-10-LABX-0038) in the framework of the “Investissements d’Avenir” (ANR-11-IDEX-0003-01) managed by the Agence Nationale de la Recherche (ANR, France), Programme National “Physique et Chimie du Milieu Interstellaire” (PCMI) of CNRS/INSU with INC/INP co-funded by CEA and CNES. We also acknowledge Paolo Pilleri for sharing his observations of the PDR NGC7023 (Pilleri et al. 2015). Reproduced with permission from Astronomy & Astrophysics, ©ESO.
Appendix A Discs
A.1 HD 100546
HD 100546 is one of the nearest very well-studied Herbig Be stars (d = 109 ± 4 pc; Gaia Collaboration 2018; Lindegren et al. 2016). Based on high-contrast images obtained with the HST and with ground-based instruments, an elliptical structure was detected that extends up to 350–380 au (Augereau et al. 2001), and multiple-arm spiral patterns were identified (Grady et al. 2001; Ardila et al. 2007; Boccaletti et al. 2013). An inner dust disc extending from ~0.2 au to ~1–4 au was resolved using near-IR interferometry (Benisty et al. 2010; Tatulli et al. 2011; Mulders et al. 2013; Panić et al. 2014). The (pre-)transitional nature of HD 100546 was initially proposed by Bouwman et al. (2003) from an SED analysis. A gap that extends to up to 10–15 au has been confirmed by mid-IR interferometry (Liu et al. 2003; Panić et al. 2014), spectroscopy in the UV and the near-IR (Grady et al. 2007; Brittain et al. 2009; van der Plas et al. 2009), and high-resolution polarimetric imaging in the optical and near-IR (Quanz et al. 2015; Garufi et al. 2016; Follette et al. 2017).
It is the first disc in which crystalline silicates (Hu et al. 1989) and aromatic bands (Malfait et al. 1998) have been detected. HD 100546 is one of the few HAeBe stars to simultaneously show strong aromatic band luminosity and warm gas line luminosities (Meeus et al. 2012, 2013). The 8.6 and 11.3 μm aromatic features are spatially extended over a few 100 au (van Boekel et al. 2004), and the spatial distribution of the 3.3 μm emission shows a gap in the innermost region (~5–10 au) and is extended up to at least 50 au (Habart et al. 2006). The FHWM is about ~ 12 ± 3 au Geers et al. (2007b). In Habart et al. (2006), some additional features in the 3.4–3.5 μm region have also been detected, which were at the time attributed to aliphatic C–H stretches in methyl or ethyl side-groups attached to PAHs (Joblin et al. 1996; Yang et al. 2013, 2016) or nano-diamonds.
A.2 HD 100453
The Herbig Ae star HD 100453A (d = 104 ± 3 pc, M = 1.7Msol; Gaia Collaboration 2018; Dominik et al. 2003) is less bright and not studied as frequently as HD 100546. Its proto-planetary disc was recently revealed to host a gap (Khalafinejad et al. 2016) and a global two-arm spiral structure in a SPHERE/VLT image. This is consistent with a companion-driven origin (Wagner et al. 2017, and reference therein). The primary A-star hosts an M-dwarf companion with a mass of ~ 0.2M and an angular separation of 1.05′′, which corresponds to a projected physical separation of ~108 au if the orbit is seen close to face-on (Chen et al. 2006b; Collins et al. 2009). The spatially resolved mid-IR Q-band image obtained with Gemini north/MICHELLE indicates an outer gap edge at ~20 au, and the disc is extended up to ~200 au (Khalafinejad et al. 2016). Based on the Gemini Planet Imager (GPI) polarized intensity (PI), SPHERE data, and the IR SED fitting, Long et al. (2017) suggested that the circumstellar disc of HD 100453 appears to contain an inner disc, which, when an SED fitting was made, extends from 0.13–1 au, followed by a large radial gap (1–18 au) and an outer disc (18–39 au).
Its Spitzer/IRS spectrum shows a very weak sign of silicate features at 10 and 20 μm, which also indicates a gap in the disc (e.g., Mariñas et al. 2011; Maaskant et al. 2013). The aromatic features at 3.3, 6.2, 7.8, 8.6, 11.3, and 12.7 μm are detected (Meeus et al. 2001), with secondary features observed at 5.7, 6.0, 10.6, 12.0, and 13.5 μm, and the 6.8 and 7.2 μm aliphatic bands (Acke et al. 2010). HD 100453 also displays an emission feature at 16–19 μm that might be attributed to the out-of-plane skeletal modes of large elongated PAH molecules (Peeters et al. 2004; Acke et al. 2010). The 3.3 μm aromatic feature is spatially extended with an FWHM equal to ~20 au. (Habart et al. 2006; Klarmann et al. 2017) presented near-IR interferometric observations that showed extended flux that might be evidence for carbonaceous stochastically heated particles in the inner region of the proto-planetary discs around HD 100453.
A.3 HD 169142
HD 169142 is a Herbig Ae star (A5Ve; Keller et al. 2008) that is well studied at a distance of 117 ± 4 pc (Grady et al. 2007; Manoj et al. 2006; Gaia Collaboration 2018). It shows an (almost face-on) disc with (i) multiple gaps (an inner gap between ~1 and ~20 au and a middle gap between ~30 and ~55 au), (ii) dust rings at the edge of the gaps (at ~20–30 au and at 55–85 au), and (iii) an outer disc (e.g., Honda 2013; Quanz et al. 2013; Osorio et al. 2014; Momose et al. 2015; Fedele et al. 2017; Ligi et al. 2017; Bertrang et al. 2017).
Seok & Li (2016) and Pohl et al. (2017) also modelled the dust population according to its location or its evolution. Seok & Li (2016) performed a comprehensive modelling of its SED as well as the PAH emission features with porous dust and astronomical-PAHs and found that three dust populations and relatively small PAH molecules with an ionisation fraction of 0.8 can explain the entire SED and the observed PAH features4. In this disc, the aromatic feature at 3.3 μm is clearly detected with the other aromatic bands at 6.2, 7.8, 8.6, 11.3 and 12.7 μm (Meeus et al. 2001; Sloan et al. 2005), as well as secondary features observed at 5.7, 6.0, 10.6, 12.0, and 13.5 μm, and the 6.8 and 7.2 μm aliphatic bands (Acke et al. 2010). The 3.3 μm aromatic feature appears to be observed in the inner cavity and is spatially extended with an FWHM of 0.3′′ or ~30 au (Habart et al. 2006, and this paper).
A.4 HD 179218
The star HD 179218 is at a distance of ~290 pc (Gaia Collaboration 2018) with a B9 spectral type and a strong luminosity of ~180 L. It harbours a circumstellar disc that is revealed through its IR excess and that is well known for its silicate-dominated IR spectrum (Bouwman et al. 2001; Schütz et al. 2005; van Boekel et al. 2005). Its IR spectra are dominated by crystalline forsterite and enstatite and not by small, amorphous silicate grains. HD 179218 is known to have a high percentage of crystalline dust. This indicates dust processing in the circumstellar disc of HD 179218, and the presence of cold enstatite at ~10 au implies that it is mostly produced in the inner regions and is transported outwards by radial mixing (van Boekel et al. 2005). A double-ring-like emission at 10 μm has been spatially resolved (e.g. Fedele et al. 2008), and it peaks at ~1 and 20 au, respectively. A gap at ~10 au is reported based on the mid-IR interferometry with VLTI/MIDI.
The aromatic feature at 3.3 μm is detected, as well as the other aromatic bands at 6.2, 7.8, and 8.6 μm (Meeus et al. 2001; Acke & van den Ancker 2004; Acke et al. 2010). A very recent study shows that has for the first time spatially resolved the aromatic emission of the disc (Taha et al. 2018). The average FHWM of the 8.6 and 11.3 μm is of 0.232′′ or 67 au and 0.280′′ or 81 au. Based on spatial and spectroscopic considerations as well as on qualitative comparison with IRS 48 and HD 97048, the authors favoured a scenario in which PAHs extend out to large radii across the flared disc surface and are at the same time predominantly in an ionised charge state that is due to the strong UV radiation field of the central star. The 3.3 μm aromatic feature is detected from 0.1′′ until 0.5′′ or 150 au from the central star. In this study, we find that the FWHM is about 0.2′′ or ~60 au. Kluska et al. (2018) presented near-IR interferometric observations showing extended flux that might be evidence for carbonaceous stochastically heated particles in the inner region of the proto-planetary discs around HD 179218.
Appendix B Comparison of THEMIS with observations
Figures B.1 and B.2 show correlations between the aliphatic bands and the aromatic band for two sets of parameters obtained with THEMIS: (Eg = 0.2 eV, amin = 5 nm) and (Eg= 0.1 eV, amin = 4 nm), respectively. See Sect. 6 for details.
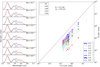 |
Fig. B.1 Correlation between intensities in bands 3.4, 3.43, 3.46, 3.52, and 3.46 and the band at 3.3 μm, underlined by those calculated for pixels of HD 100546 that were previously shown in Fig. 4. |
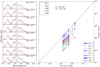 |
Fig. B.2 Correlation between intensities in bands 3.4, 3.43, 3.46, 3.52, and 3.46 and the band at 3.3 μm, underlined by those calculated for pixels of HD 100546 that were previously shown in Fig. 4. |
References
- Acke, B., & van den Ancker M. E. 2004, A&A, 426, 151 [NASA ADS] [CrossRef] [EDP Sciences] [Google Scholar]
- Acke, B., & Van den Ancker M. E. 2006, A&A, 449, 267 [NASA ADS] [CrossRef] [EDP Sciences] [Google Scholar]
- Acke, B., Bouwman, J., Juhász, A., et al. 2010, ApJ, 718, 558 [NASA ADS] [CrossRef] [Google Scholar]
- Ardila, D. R., Golimowski, D. A., Krist, J. E., et al. 2007, ApJ, 665, 512 [NASA ADS] [CrossRef] [Google Scholar]
- Augereau, J. C., Lagrange, A. M., Mouillet, D., & Ménard, F. 2001, A&A, 365, 78 [NASA ADS] [CrossRef] [EDP Sciences] [Google Scholar]
- Benisty, M., Tatulli, E., Ménard, F., & Swain, M. R. 2010, A&A, 511, A75 [NASA ADS] [CrossRef] [EDP Sciences] [Google Scholar]
- Berné, O., Fuente, A., Pantin, E., et al. 2015, A&A, 578, L8 [NASA ADS] [CrossRef] [EDP Sciences] [Google Scholar]
- Bertrang, G. H.-M., Flock, M., & Wolf, S. 2017, MNRAS, 464, L61 [NASA ADS] [CrossRef] [Google Scholar]
- Biller, B. A., Males, J., Rodigas, T., et al. 2014, ApJ, 792, L22 [NASA ADS] [CrossRef] [Google Scholar]
- Blades, J. C., & Whittet, D. C. B. 1980, MNRAS, 191, 701 [NASA ADS] [CrossRef] [Google Scholar]
- Boccaletti, A., Pantin, E., Lagrange, A.-M., et al. 2013, A&A, 560, A20 [NASA ADS] [CrossRef] [EDP Sciences] [Google Scholar]
- Bouwman, J., Meeus, G., de Koter, A., et al. 2001, A&A, 375, 950 [NASA ADS] [CrossRef] [EDP Sciences] [Google Scholar]
- Bouwman, J., de Koter, A., Dominik, C., & Waters, L. B. F. M. 2003, A&A, 401, 577 [NASA ADS] [CrossRef] [EDP Sciences] [Google Scholar]
- Brittain, S. D., Najita, J. R., & Carr, J. S. 2009, ApJ, 702, 85 [NASA ADS] [CrossRef] [Google Scholar]
- Brooke, T. Y., Tokunaga, A. T., & Strom, S. E. 1993, AJ, 106, 656 [NASA ADS] [CrossRef] [Google Scholar]
- Candian, A., Kerr, T. H., Song, I.-O., McCombie, J., & Sarre, P. J. 2012, MNRAS, 426, 389 [NASA ADS] [CrossRef] [Google Scholar]
- Carpentier, Y., Féraud, G., Dartois, E., et al. 2012, A&A, 548, A40 [NASA ADS] [CrossRef] [EDP Sciences] [Google Scholar]
- Chastenet, J., Bot, C., Gordon, K. D., et al. 2017, A&A, 601, A55 [NASA ADS] [CrossRef] [EDP Sciences] [Google Scholar]
- Chen, C. H., Sargent, B. A., Bohac, C., et al. 2006a, ApJS, 166, 351 [NASA ADS] [CrossRef] [Google Scholar]
- Chen, X. P., Henning, T., van Boekel, R., & Grady, C. A. 2006b, A&A, 445, 331 [NASA ADS] [CrossRef] [EDP Sciences] [Google Scholar]
- Chiar, J. E., Tielens, A. G. G. M., Adamson, A. J., & Ricca, A. 2013, ApJ, 770, 78 [NASA ADS] [CrossRef] [Google Scholar]
- Collins, K. A., Grady, C. A., Hamaguchi, K., et al. 2009, ApJ, 697, 557 [NASA ADS] [CrossRef] [Google Scholar]
- Compiègne, M., Verstraete, L., Jones, A., et al. 2011, A&A, 525, A103 [NASA ADS] [CrossRef] [EDP Sciences] [Google Scholar]
- Currie, T., Cloutier, R., Brittain, S., et al. 2015, ApJ, 814, L27 [NASA ADS] [CrossRef] [Google Scholar]
- Dartois, E., Muñoz Caro, G. M., Deboffle, D., & d’Hendecourt, L. 2004a, A&A, 423, L33 [NASA ADS] [CrossRef] [EDP Sciences] [Google Scholar]
- Dartois, E., Marco, O., Muñoz-Caro, G. M., et al. 2004b, A&A, 423, 549 [NASA ADS] [CrossRef] [EDP Sciences] [Google Scholar]
- Dartois, E., Caro, G. M. M., Deboffle, D., Montagnac, G., & d’Hendecourt, L. 2005, A&A, 432, 895 [NASA ADS] [CrossRef] [EDP Sciences] [Google Scholar]
- Dischler, B. 1987, in Proceedings of the EMRS Symposium, 17, 189 [Google Scholar]
- Dominik, C., Dullemond, C. P., Waters, L. B. F. M., & Walch, S. 2003, A&A, 398, 607 [NASA ADS] [CrossRef] [EDP Sciences] [Google Scholar]
- Fedele, D., van den Ancker, M. E., Acke, B., et al. 2008, A&A, 491, 809 [NASA ADS] [CrossRef] [EDP Sciences] [MathSciNet] [Google Scholar]
- Fedele, D., Carney, M., Hogerheijde, M. R., et al. 2017, A&A, 600, A72 [NASA ADS] [CrossRef] [EDP Sciences] [Google Scholar]
- Follette, K. B., Rameau, J., Dong, R., et al. 2017, AJ, 153, 264 [NASA ADS] [CrossRef] [Google Scholar]
- Furlan, E., Hartmann, L., Calvet, N., et al. 2006, ApJS, 165, 568 [NASA ADS] [CrossRef] [MathSciNet] [Google Scholar]
- Gaia Collaboration (Brown, A. G. A., et al.) 2018, A&A, 616, A1 [NASA ADS] [CrossRef] [EDP Sciences] [Google Scholar]
- Garufi, A., Quanz, S. P., Schmid, H. M., et al. 2016, A&A, 588, A8 [NASA ADS] [CrossRef] [EDP Sciences] [Google Scholar]
- Geballe, T. R., Lacy, J. H., Persson, S. E., McGregor, P. J., & Soifer, B. T. 1985, ApJ, 292, 500 [NASA ADS] [CrossRef] [Google Scholar]
- Geers, V. C., Augereau, J.-C., Pontoppidan, K. M., et al. 2006, A&A, 459, 545 [NASA ADS] [CrossRef] [EDP Sciences] [Google Scholar]
- Geers, V. C., Pontoppidan, K. M., Van Dishoeck, E. F., et al. 2007a, A&A, 469, L35 [NASA ADS] [CrossRef] [EDP Sciences] [Google Scholar]
- Geers, V. C., van Dishoeck, E. F., Visser, R., et al. 2007b, A&A, 476, 279 [NASA ADS] [CrossRef] [EDP Sciences] [Google Scholar]
- Godard, M., Féraud, G., Chabot, M., et al. 2011, A&A, 529, A146 [NASA ADS] [CrossRef] [EDP Sciences] [Google Scholar]
- Goebel, J. H., Bregman, J. D., Witteborn, F. C., Taylor, B. J., & Willner, S. P. 1981, ApJ, 246, 455 [NASA ADS] [CrossRef] [Google Scholar]
- Goto, M., Gaessler, W., Hayano, Y., et al. 2003, ApJ, 589, 419 [NASA ADS] [CrossRef] [Google Scholar]
- Goto, M., Henning, T., Kouchi, A., et al. 2009, ApJ, 693, 610 [NASA ADS] [CrossRef] [Google Scholar]
- Grady, C. A., Polomski, E. F., Henning, T., et al. 2001, AJ, 122, 3396 [NASA ADS] [CrossRef] [Google Scholar]
- Grady, C. A., Schneider, G., Hamaguchi, K., et al. 2007, ApJ, 665, 1391 [NASA ADS] [CrossRef] [Google Scholar]
- Guillois, O., Ledoux, G., & Reynaud, C. 1999, ApJ, 521, L133 [NASA ADS] [CrossRef] [Google Scholar]
- Habart, E., Natta, A., & Krügel, E. 2004, A&A, 427, 179 [NASA ADS] [CrossRef] [EDP Sciences] [Google Scholar]
- Habart, E., Natta, A., Testi, L., & Carbillet, M. 2006, A&A, 449, 1067 [NASA ADS] [CrossRef] [EDP Sciences] [Google Scholar]
- Habing, H. J. 1968, Bull. Astron. Inst. Netherlands, 19, 421 [Google Scholar]
- Hammonds, M., Mori, T., Usui, F., & Onaka, T. 2015, Planet. Space Sci., 116, 73 [NASA ADS] [CrossRef] [Google Scholar]
- Honda, M. 2013, Subaru Proposal, 1, 22 [NASA ADS] [Google Scholar]
- Hu, J. Y., The, P. S., & de Winter D. 1989, A&A, 208, 213 [NASA ADS] [Google Scholar]
- Joblin, C., Tielens, A., Allamandola, L. J., & Geballe, T. R. 1996, ApJ, 458, 610 [NASA ADS] [CrossRef] [PubMed] [Google Scholar]
- Jones, A. P. 1990, MNRAS, 247, 305 [NASA ADS] [Google Scholar]
- Jones, A. P. 2012a, A&A, 540, A1 [NASA ADS] [CrossRef] [EDP Sciences] [Google Scholar]
- Jones, A. P. 2012b, A&A, 540, A2 [NASA ADS] [CrossRef] [EDP Sciences] [Google Scholar]
- Jones, A. P. 2012c, A&A, 542, A98 [NASA ADS] [CrossRef] [EDP Sciences] [Google Scholar]
- Jones, A. P., d’Hendecourt, L. B., Sheu, S.-Y., et al. 2004, A&A, 416, 235 [NASA ADS] [CrossRef] [EDP Sciences] [Google Scholar]
- Jones, A. P., Fanciullo, L., Kühler, M., et al. 2013, A&A, 558, A62 [NASA ADS] [CrossRef] [EDP Sciences] [Google Scholar]
- Jones, A. P., Kühler, M., Ysard, N., et al. 2016, A&A, 588, A43 [NASA ADS] [CrossRef] [EDP Sciences] [Google Scholar]
- Jones, A. P., Koehler, M., Ysard, N., Bocchio, M., & Verstraete, L. 2017, A&A, 602, A46 [NASA ADS] [CrossRef] [EDP Sciences] [Google Scholar]
- Jourdain de Muizon, M., d’Hendecourt, L. B., & Geballe, T. R. 1990a, A&A, 235, 367 [NASA ADS] [Google Scholar]
- Jourdain de Muizon, M., d’Hendecourt, L. B., & Geballe, T. R. 1990b, A&A, 227, 526 [NASA ADS] [Google Scholar]
- Keller, L. D., Sloan, G. C., Forrest, W. J., et al. 2008, ApJ, 684, 411 [NASA ADS] [CrossRef] [Google Scholar]
- Khalafinejad, S., Maaskant, K. M., Mariñas, N., & Tielens, A. 2016, A&A, 587, A62 [NASA ADS] [CrossRef] [EDP Sciences] [Google Scholar]
- Klarmann, L., Benisty, M., Min, M., et al. 2017, A&A, 599, A80 [NASA ADS] [CrossRef] [EDP Sciences] [Google Scholar]
- Kluska, J., Kraus, S., Davies, C. L., et al. 2018, ApJ, 855, 44 [NASA ADS] [CrossRef] [Google Scholar]
- Kühler, M., Jones, A., & Ysard, N. 2014, A&A, 565, L9 [NASA ADS] [CrossRef] [EDP Sciences] [Google Scholar]
- Kühler, M., Ysard, N., & Jones, A. P. 2015, A&A, 579, A15 [NASA ADS] [CrossRef] [EDP Sciences] [Google Scholar]
- Kraus, S., Ireland, M. J., Sitko, M. L., et al. 2013, ApJ, 768, 80 [NASA ADS] [CrossRef] [Google Scholar]
- Kwok, S., & Zhang, Y. 2011, Nature, 479, 80 [NASA ADS] [CrossRef] [PubMed] [Google Scholar]
- Lagage, P.-O., Doucet, C., Pantin, E., et al. 2006, Science, 314, 621 [NASA ADS] [CrossRef] [PubMed] [Google Scholar]
- Leger, A., & Puget, J. L. 1984, A&A, 137, L5 [Google Scholar]
- Li, A., & Lunine, J. I. 2003, ApJ, 594, 987 [NASA ADS] [CrossRef] [Google Scholar]
- Ligi, R., Vigan, A., Gratton, R., et al. 2017, in SF2A-2017: Proceedings of the Annual meeting of the French Society of Astronomy and Astrophysics, eds. C. Reylé, P. Di Matteo, F. Herpin, et al., 337 [Google Scholar]
- Lindegren, L., Lammers, U., Bastian, U., et al. 2016, A&A, 595, A4 [NASA ADS] [CrossRef] [EDP Sciences] [Google Scholar]
- Liu, W. M., Hinz, P. M., Meyer, M. R., et al. 2003, ApJ, 598, L111 [NASA ADS] [CrossRef] [Google Scholar]
- Long, Z. C., Fernandes, R. B., Sitko, M., et al. 2017, ApJ, 838, 62 [NASA ADS] [CrossRef] [Google Scholar]
- Maaskant, K. M., Honda, M., Waters, L. B. F. M., et al. 2013, A&A, 555, A64 [NASA ADS] [CrossRef] [EDP Sciences] [Google Scholar]
- Maaskant, K. M., Min, M., Waters, L., & Tielens, A. 2014, A&A, 563, A78 [NASA ADS] [CrossRef] [EDP Sciences] [Google Scholar]
- Malfait, K., Waelkens, C., Waters, L., et al. 1998, A&A, 332, L25 [NASA ADS] [Google Scholar]
- Manoj, P., Bhatt, H. C., Maheswar, G., & Muneer, S. 2006, ApJ, 653, 657 [NASA ADS] [CrossRef] [Google Scholar]
- Mariñas, N., Telesco, C. M., Fisher, R. S., & Packham, C. 2011, ApJ, 737, 57 [NASA ADS] [CrossRef] [Google Scholar]
- Meeus, G., Waters, L. B. F. M., Bouwman, J., et al. 2001, A&A, 365, 476 [NASA ADS] [CrossRef] [EDP Sciences] [Google Scholar]
- Meeus, G., Montesinos, B., Mendigutía, I., et al. 2012, A&A, 544, A78 [NASA ADS] [CrossRef] [EDP Sciences] [Google Scholar]
- Meeus, G., Salyk, C., Bruderer, S., et al. 2013, A&A, 559, A84 [NASA ADS] [CrossRef] [EDP Sciences] [Google Scholar]
- Mennella, V. 2008, ApJ, 682, L101 [NASA ADS] [CrossRef] [Google Scholar]
- Micelotta, E. R., Jones, A. P., & Tielens, A. G. G. M. 2010a, A&A, 510, A36 [NASA ADS] [CrossRef] [EDP Sciences] [Google Scholar]
- Micelotta, E. R., Jones, A. P., & Tielens, A. G. G. M. 2010b, A&A, 510, A37 [NASA ADS] [CrossRef] [EDP Sciences] [Google Scholar]
- Momose, M., Morita, A., Fukagawa, M., et al. 2015, Publ. Astron. Soc. Jpn., 67, 83 [Google Scholar]
- Mulders, G. D., Min, M., Dominik, C., Debes, J. H., & Schneider, G. 2013, A&A, 549, A112 [NASA ADS] [CrossRef] [EDP Sciences] [Google Scholar]
- Muñoz Caro, G. M., Ruiterkamp, R., Schutte, W. A., Greenberg, J. M., & Mennella, V. 2001, A&A, 367, 347 [NASA ADS] [CrossRef] [EDP Sciences] [Google Scholar]
- Osorio, M., Anglada, G., Carrasco-González, C., et al. 2014, ApJ, 791, L36 [NASA ADS] [CrossRef] [Google Scholar]
- Panić, O., Ratzka, T., Mulders, G. D., et al. 2014, A&A, 562, A101 [NASA ADS] [CrossRef] [EDP Sciences] [Google Scholar]
- Peeters, E., Mattioda, A. L., Hudgins, D. M., & Allamandola, L. J. 2004, ApJ, 617, L65 [NASA ADS] [CrossRef] [Google Scholar]
- Pilleri, P., Joblin, C., Boulanger, F., & Onaka, T. 2015, A&A, 577, A16 [NASA ADS] [CrossRef] [EDP Sciences] [Google Scholar]
- Pino, T., Dartois, E., Cao, A.-T., et al. 2008, A&A, 490, 665 [CrossRef] [EDP Sciences] [Google Scholar]
- Pirali, O., Vervloet, M., Dahl, J. E., et al. 2007, ApJ, 661, 919 [NASA ADS] [CrossRef] [Google Scholar]
- Pohl, A., Benisty, M., Pinilla, P., et al. 2017, ApJ, 850, 52 [NASA ADS] [CrossRef] [Google Scholar]
- Quanz, S. P., Avenhaus, H., Buenzli, E., et al. 2013, ApJ, 766, L2 [NASA ADS] [CrossRef] [Google Scholar]
- Quanz, S. P., Amara, A., Meyer, M. R., et al. 2015, ApJ, 807, 64 [NASA ADS] [CrossRef] [Google Scholar]
- Reggiani, M., Quanz, S. P., Meyer, M. R., et al. 2014, ApJ, 792, L23 [NASA ADS] [CrossRef] [Google Scholar]
- Ristein, J. 1998, J. Appl. Phys., 84, 3836 [NASA ADS] [CrossRef] [Google Scholar]
- Roberts, K. R. G., Smith, K. T., & Sarre, P. J. 2012, MNRAS, 421, 3277 [NASA ADS] [CrossRef] [Google Scholar]
- Robertson, J. 1986, Adv. Phys., 35, 317 [NASA ADS] [CrossRef] [Google Scholar]
- Sadjadi, S., Zhang, Y., & Kwok, S. 2017, ApJ, 845, 123 [NASA ADS] [CrossRef] [Google Scholar]
- Schütz, O., Meeus, G., & Sterzik, M. F. 2005, A&A, 431, 165 [NASA ADS] [CrossRef] [EDP Sciences] [Google Scholar]
- Schworer, G., Lacour, S., Huélamo, N., et al. 2017, ApJ, 842, 77 [NASA ADS] [CrossRef] [Google Scholar]
- Seok, J. Y., & Li, A. 2016, ApJ, 818, 2 [NASA ADS] [CrossRef] [Google Scholar]
- Seok, J. Y., & Li, A. 2017, ApJ, 835, 291 [NASA ADS] [CrossRef] [Google Scholar]
- Sheu, S.-Y., Lee, I.-P., Lee, Y. T., & Chang, H.-C. 2002, ApJ, 581, L55 [NASA ADS] [CrossRef] [Google Scholar]
- Sloan, G. C., Bregman, J. D., Geballe, T. R., Allamandola, L. J., & Woodward, C. E. 1997, ApJ, 474, 735 [NASA ADS] [CrossRef] [PubMed] [Google Scholar]
- Sloan, G. C., Keller, L. D., Forrest, W. J., et al. 2005, ApJ, 632, 956 [NASA ADS] [CrossRef] [Google Scholar]
- Socrates, G. 2004, Infrared and Raman Characteristic Group Frequencies: Tables and Charts (John Wiley & Sons) [Google Scholar]
- Song, I.-O., Kerr, T. H., McCombie, J., & Sarre, P. J. 2003, MNRAS, 346, L1 [NASA ADS] [CrossRef] [Google Scholar]
- Taha, A. S., Labadie, L., Pantin, E., et al. 2018, A&A, 612, A15 [NASA ADS] [CrossRef] [EDP Sciences] [Google Scholar]
- Tallent, W. H., & Siewers, I. J. 1956, Anal. Chem., 28, 953 [CrossRef] [Google Scholar]
- Tatulli, E., Benisty, M., Ménard, F., et al. 2011, A&A, 531, A1 [NASA ADS] [CrossRef] [EDP Sciences] [Google Scholar]
- Tokunaga, A. T., Sellgren, K., Smith, R. G., et al. 1991, ApJ, 380, 452 [NASA ADS] [CrossRef] [Google Scholar]
- van Boekel, R., Waters, L. B. F. M., Dominik, C., et al. 2004, A&A, 418, 177 [NASA ADS] [CrossRef] [EDP Sciences] [Google Scholar]
- van Boekel, R., Min, M., Waters, L. B. F. M., et al. 2005, A&A, 437, 189 [NASA ADS] [CrossRef] [EDP Sciences] [Google Scholar]
- van der Plas, G., van den Ancker, M. E., Acke, B., et al. 2009, A&A, 500, 1137 [NASA ADS] [CrossRef] [EDP Sciences] [Google Scholar]
- Van Kerckhoven, C., Tielens, A. G. G. M., & Waelkens, C. 2002, A&A, 384, 568 [NASA ADS] [CrossRef] [EDP Sciences] [Google Scholar]
- Wagner, K. R., Daniel, A., & Kasper, M. 2017, LPI Contributions, 2042, 4028 [NASA ADS] [Google Scholar]
- Woitke, P., Min, M., Pinte, C., et al. 2016, A&A, 586, A103 [NASA ADS] [CrossRef] [EDP Sciences] [Google Scholar]
- Yang, X. J., Glaser, R., Li, A., & Zhong, J. X. 2013, ApJ, 776, 110 [NASA ADS] [CrossRef] [Google Scholar]
- Yang, X. J., Li, A., Glaser, R., & Zhong, J. X. 2016, ApJ, 825, 22 [NASA ADS] [CrossRef] [Google Scholar]
- Ysard, N., Kühler, M., Jones, A., et al. 2016, A&A, 588, A44 [NASA ADS] [CrossRef] [EDP Sciences] [Google Scholar]
Similar PAHs properties are derived by Seok & Li for HD 100453 and HD 179218, while for HD 100546 relatively large PAHs with a small ionization fraction are found. The ionization fraction is the probability of finding a PAH molecule in a nonzero charge state (Li & Lunine 2003).
All Tables
Top part: astrophysical parameters of the selected discs. Bottom part: summary of the observations.
3.3 μm band characteristics and variations as a function of the distance from the star (d).
All Figures
|
Fig. 1 Top panel: band centre (line) and width (transparent box) of the spectral signatures related to a-C:H materials obtained in laboratory experiments on thin film or on nano-grains in the mid-IR range where C–H stretching vibrational modes are observed. We show the aromatic compound (blue), olefinic (red) and aliphatic (green) bonds, and other non-assigned signatures (grey). The signatures used in the THEMIS model are based on these experiments and are drawn in row a. They are extended by vertical lines for aromatics (dash-dotted), olefinics (dashed), and aliphatics (dotted). Middle panel: SED for an H-poor, aromatic-rich grain population from the THEMIS model, calculated with DustEM. Bottom panel: characteristic spectrum from our study that shows the whole diversity observed in this range around the Herbig star HD 100546. Spectra from the PDR NGC 7023 (Pilleri et al. 2015) and nano-particles (Carpentier et al. 2012; related to the study of Pino et al. 2008) are also plotted for comparison. The signatures in the right panel are labelled and a schematic view of vibrational modes is given. a: Jones et al. (2017), b: Pino et al. (2008), c: Dartois et al. (2004a), d: Ristein (1998), and e: Dischler (1987). |
| In the text | |
|
Fig. 2 NaCo-averaged spectra (black) for different distances from the star in 0.1′′ steps. Gaussian decomposition (in red) for each spectrum. Spectra are normalised to the continuum at 3.2 μm. |
| In the text | |
|
Fig. 3 NaCo-averaged spectrum (black) of HD 100546 at 0.4′′ or 40 au from the star. The Gaussian decomposition is shown by the red curve, and the hydrogen recombination lines are plotted in grey. Individual contributor spectral signatures are identified at 3.3 μm (black), 3.4 μm (blue), 3.43 μm (green), 3.46 μm (magenta), 3.52 μm (cyan), and 3.56 μm (red). The spectrum is normalised to the continuum at 3.2 μm. |
| In the text | |
|
Fig. 4 Aliphatic/Aromatic band intensity correlation. Points show the intensity (amplitude ×σ) of the 3.4 (blue), 3.43 (green), 3.46 (magenta), 3.52 (cyan), 3.56 (red) μm band as function of the 3.3 μm band intensity. For each set, the Spearman coefficient r is calculated. |
| In the text | |
|
Fig. 5 Aliphatic/Aromatic band intensity ratios according to the distance from the star. Point densities show the band ratios (amplitude ×σ) of the3.4 (blue), 3.43 (green), 3.46 (magenta), 3.52 (orange), 3.56 (red) to the 3.3 μm band vs. the distance from the star. The point densities are plotted instead of points to highlight the variations. The median value of the ratio is plotted as a black solid line. |
| In the text | |
|
Fig. 6 Top panels: 3.3 μm band centre as a function of the distance from the star. Middle panels: 3.3 μm FWHM as a function of the distance from the star. Bottom panels: 3.3 μm FWHM over the band centre. For HD 100546, which is shown in the left panels, values are reported from THEMIS varying band gap from 0.1 eV (magenta) to 0.6 eV (red, as rainbow colours). Top two panels: size increases from bottom to top (for the same colour). Bottom panels: size increases from right to left. |
| In the text | |
|
Fig. 7 3.4/3.3 ratio as a function of G0. The black dot shows the band ratio in PDR NGC 7023 (based on Pilleri et al. 2015). Stars show the band ratio for each disc and different distances to the central star. For the disc, the G0 has been estimated from a blackbody associated with the parameters of the central star (temperature and luminosity). The error bars for the 3.4/3.3 ratio are the dispersion of ratio values for the considered distance. The error bars for G0 correspond to the values for the considered distance inside the VLT/NACO beam. |
| In the text | |
|
Fig. 8 Spectral energy density in the 3.2–3.8 μm range calculated with THEMIS for a radiation field intensity G0 = 2.5 × 10⁷ similar to that found in discs. The calculation was made with DustEM. From top right to bottom left, the band gap varies from 0.1 eV to 2.4 eV. In each subplot, the SED is plotted for several minimum sizes of grains. |
| In the text | |
|
Fig. 9 Left panel: decomposition of the continuum-subtracted spectra calculated with DustEM for a radial field intensity that is consistent with what is expected for HD 100546. All the spectra are normalised to the continuum at a distance of 0.2′′. Right panel: correlation between intensities in bands at 3.4, 3.43, 3.46, 3.52, 3.56 μm and the band at 3.3 μm, underlined by those calculated for pixels of HD 100546 that were previously shown in Fig. 4. |
| In the text | |
|
Fig. B.1 Correlation between intensities in bands 3.4, 3.43, 3.46, 3.52, and 3.46 and the band at 3.3 μm, underlined by those calculated for pixels of HD 100546 that were previously shown in Fig. 4. |
| In the text | |
|
Fig. B.2 Correlation between intensities in bands 3.4, 3.43, 3.46, 3.52, and 3.46 and the band at 3.3 μm, underlined by those calculated for pixels of HD 100546 that were previously shown in Fig. 4. |
| In the text | |
Current usage metrics show cumulative count of Article Views (full-text article views including HTML views, PDF and ePub downloads, according to the available data) and Abstracts Views on Vision4Press platform.
Data correspond to usage on the plateform after 2015. The current usage metrics is available 48-96 hours after online publication and is updated daily on week days.
Initial download of the metrics may take a while.