Fig. 9
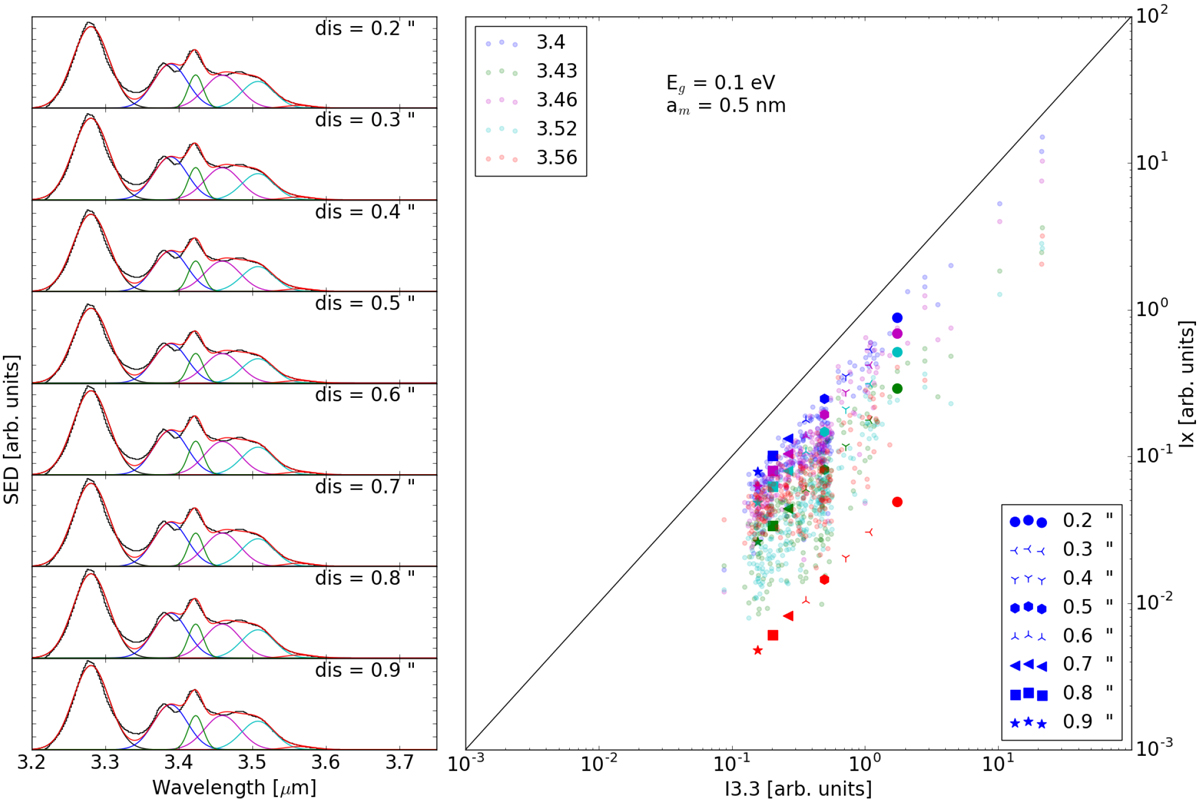
Left panel: decomposition of the continuum-subtracted spectra calculated with DustEM for a radial field intensity that is consistent with what is expected for HD 100546. All the spectra are normalised to the continuum at a distance of 0.2′′. Right panel: correlation between intensities in bands at 3.4, 3.43, 3.46, 3.52, 3.56 μm and the band at 3.3 μm, underlined by those calculated for pixels of HD 100546 that were previously shown in Fig. 4.
Current usage metrics show cumulative count of Article Views (full-text article views including HTML views, PDF and ePub downloads, according to the available data) and Abstracts Views on Vision4Press platform.
Data correspond to usage on the plateform after 2015. The current usage metrics is available 48-96 hours after online publication and is updated daily on week days.
Initial download of the metrics may take a while.