Fig. 3
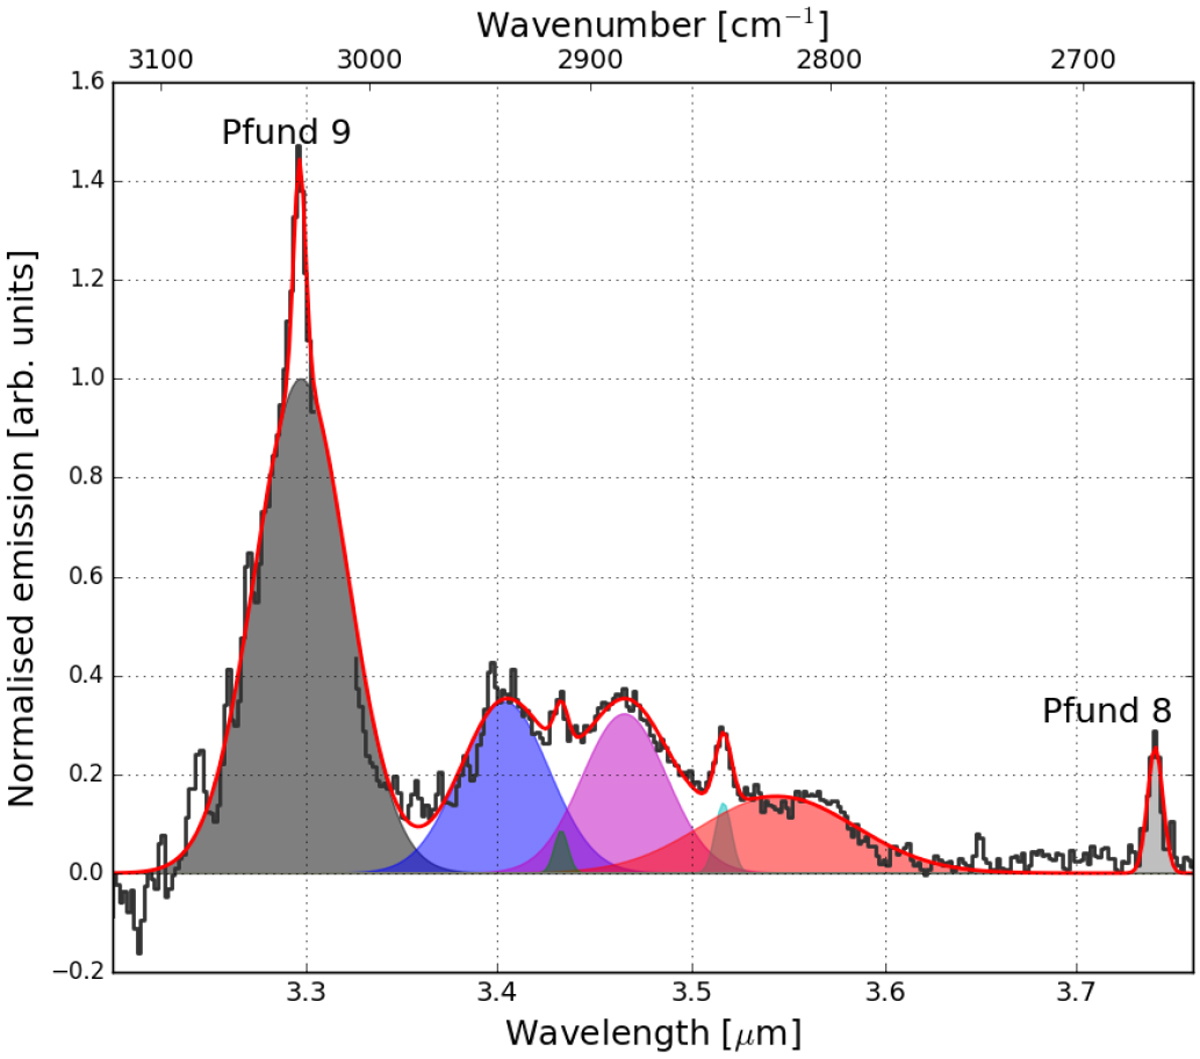
NaCo-averaged spectrum (black) of HD 100546 at 0.4′′ or 40 au from the star. The Gaussian decomposition is shown by the red curve, and the hydrogen recombination lines are plotted in grey. Individual contributor spectral signatures are identified at 3.3 μm (black), 3.4 μm (blue), 3.43 μm (green), 3.46 μm (magenta), 3.52 μm (cyan), and 3.56 μm (red). The spectrum is normalised to the continuum at 3.2 μm.
Current usage metrics show cumulative count of Article Views (full-text article views including HTML views, PDF and ePub downloads, according to the available data) and Abstracts Views on Vision4Press platform.
Data correspond to usage on the plateform after 2015. The current usage metrics is available 48-96 hours after online publication and is updated daily on week days.
Initial download of the metrics may take a while.