Fig. 1
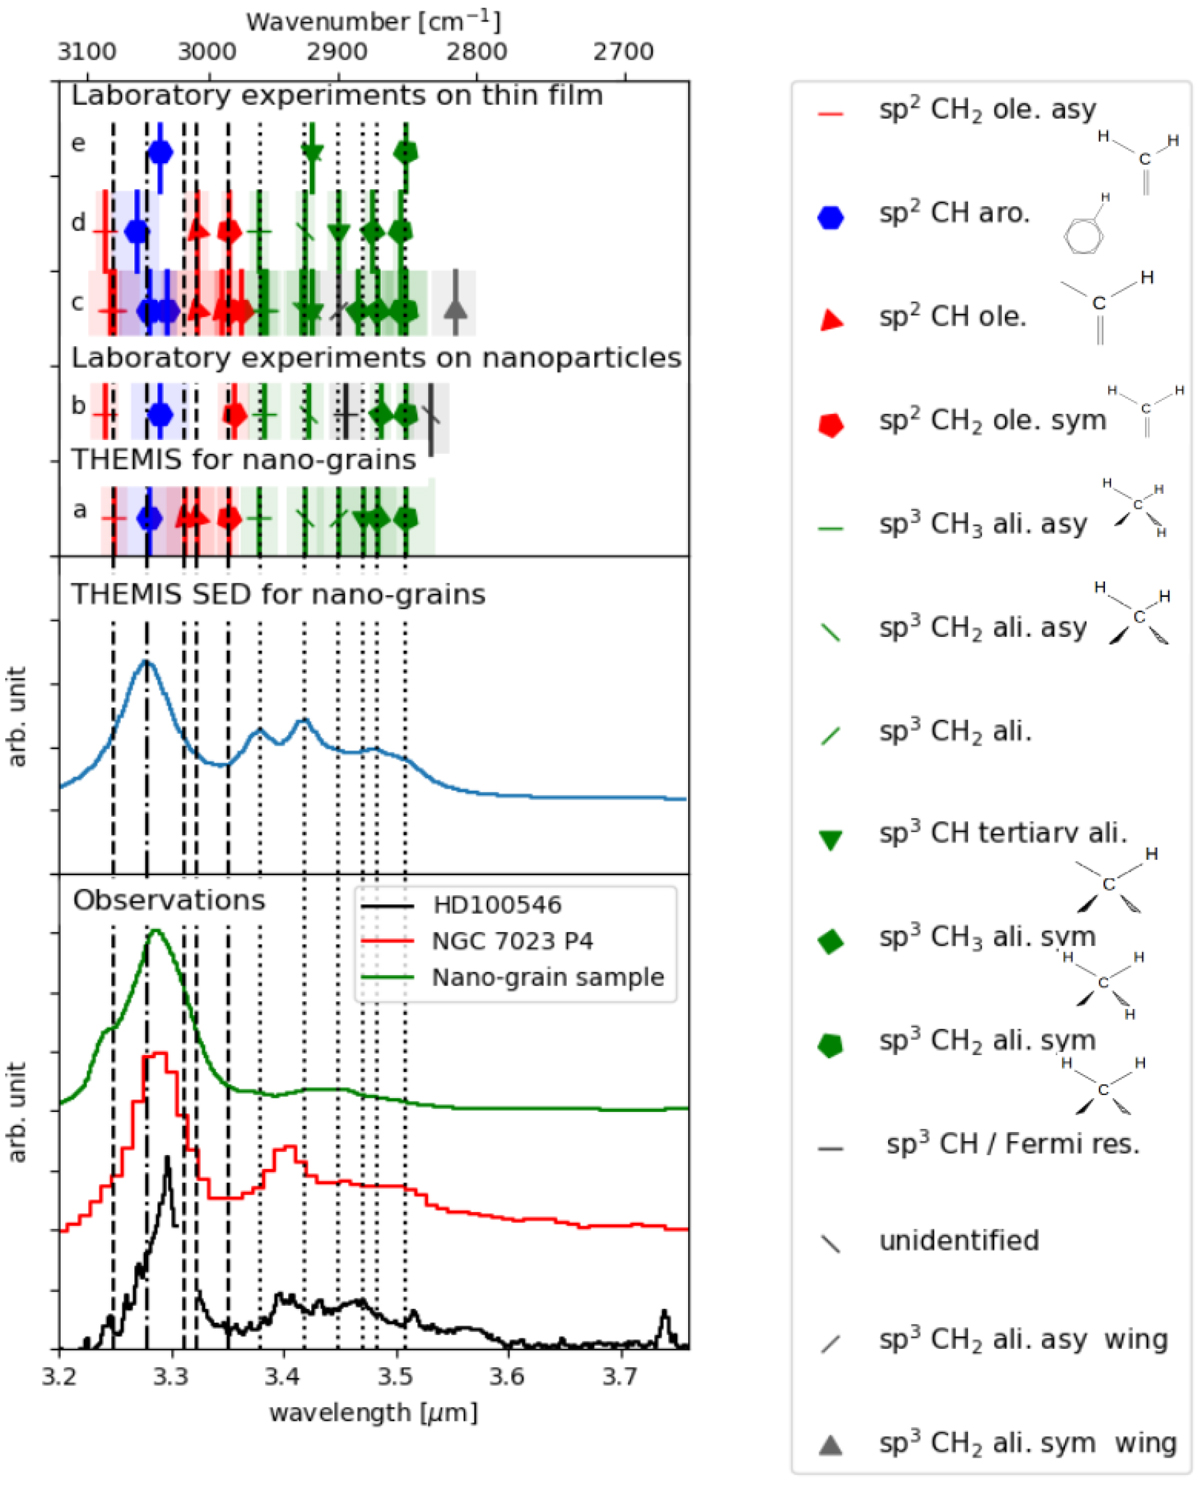
Top panel: band centre (line) and width (transparent box) of the spectral signatures related to a-C:H materials obtained in laboratory experiments on thin film or on nano-grains in the mid-IR range where C–H stretching vibrational modes are observed. We show the aromatic compound (blue), olefinic (red) and aliphatic (green) bonds, and other non-assigned signatures (grey). The signatures used in the THEMIS model are based on these experiments and are drawn in row a. They are extended by vertical lines for aromatics (dash-dotted), olefinics (dashed), and aliphatics (dotted). Middle panel: SED for an H-poor, aromatic-rich grain population from the THEMIS model, calculated with DustEM. Bottom panel: characteristic spectrum from our study that shows the whole diversity observed in this range around the Herbig star HD 100546. Spectra from the PDR NGC 7023 (Pilleri et al. 2015) and nano-particles (Carpentier et al. 2012; related to the study of Pino et al. 2008) are also plotted for comparison. The signatures in the right panel are labelled and a schematic view of vibrational modes is given. a: Jones et al. (2017), b: Pino et al. (2008), c: Dartois et al. (2004a), d: Ristein (1998), and e: Dischler (1987).
Current usage metrics show cumulative count of Article Views (full-text article views including HTML views, PDF and ePub downloads, according to the available data) and Abstracts Views on Vision4Press platform.
Data correspond to usage on the plateform after 2015. The current usage metrics is available 48-96 hours after online publication and is updated daily on week days.
Initial download of the metrics may take a while.