Fig. 7
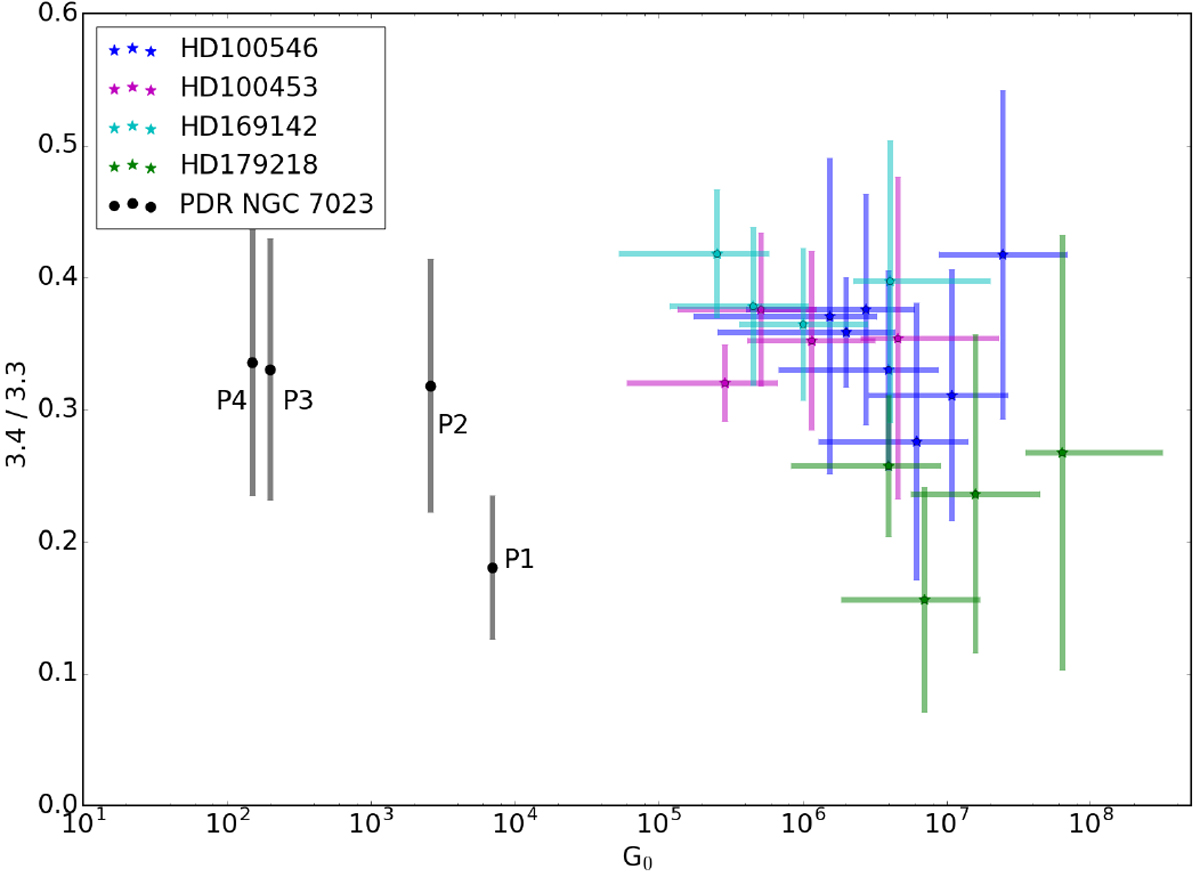
3.4/3.3 ratio as a function of G0. The black dot shows the band ratio in PDR NGC 7023 (based on Pilleri et al. 2015). Stars show the band ratio for each disc and different distances to the central star. For the disc, the G0 has been estimated from a blackbody associated with the parameters of the central star (temperature and luminosity). The error bars for the 3.4/3.3 ratio are the dispersion of ratio values for the considered distance. The error bars for G0 correspond to the values for the considered distance inside the VLT/NACO beam.
Current usage metrics show cumulative count of Article Views (full-text article views including HTML views, PDF and ePub downloads, according to the available data) and Abstracts Views on Vision4Press platform.
Data correspond to usage on the plateform after 2015. The current usage metrics is available 48-96 hours after online publication and is updated daily on week days.
Initial download of the metrics may take a while.