| Issue |
A&A
Volume 618, October 2018
|
|
|---|---|---|
| Article Number | A7 | |
| Number of page(s) | 15 | |
| Section | Planets and planetary systems | |
| DOI | https://doi.org/10.1051/0004-6361/201833226 | |
| Published online | 03 October 2018 | |
Gravitational fragmentation and formation of giant protoplanets on orbits of tens of au
1
Department of Astrophysics, University of Vienna,
Vienna,
1180, Austria
e-mail: This email address is being protected from spambots. You need JavaScript enabled to view it.
2
Research Institute of Physics, Southern Federal University,
Rostov-on-Don,
344090 Russia
Received:
13
April
2018
Accepted:
19
June
2018
Abstract
Aims. Migration of dense gaseous clumps that form in young protostellar disks via gravitational fragmentation is investigated to determine the likelihood of giant planet formation.
Methods. High-resolution numerical hydrodynamics simulations in the thin-disk limit are employed to compute the formation and long-term evolution of a gravitationally unstable protostellar disk around a solar-mass star.
Results. We show that gaseous clumps that form in the outer regions of the disk (>100 au) through disk fragmentation are often perturbed by other clumps or disk structures, such as spiral arms, and migrate toward the central star on timescales from a few thousand to few tens of thousands of years. The migration timescale is slowest when stellar motion in response to the disk gravity is considered. When approaching the star, the clumps first gain mass (up to several tens of MJup), but then quickly lose most of their diffuse envelopes through tidal torques. Part of the clump envelope can be accreted onto the central star causing an FU-Orionis-type accretion and luminosity outburst. The tidal mass loss helps the clumps to significantly slow down or even halt their inward migration at a distance of a few tens of au from the protostar. The resulting clumps are heavily truncated both in mass and size compared to their wider orbit counterparts, keeping only a dense and hot nucleus. During the inward migration, the temperature in the clump interiors may exceed the molecular hydrogen dissociation limit (2000 K) and the central region of the clump can collapse into a gas giant protoplanet. Moreover, migrating clumps may experience close encounters with other clumps, resulting in the ejection of the least massive (planetary-mass) clumps from the disk. We argue that FU-Orionis-type luminosity outbursts may be the end product of disk fragmentation and clump inward migration, preceding the formation of giant protoplanets on tens of au orbits in systems such as HR 8799.
Key words: stars: formation / stars: protostars / protoplanetary disks / planets and satellites: formation
© ESO 2018
1 Introduction
Gravitational instability and fragmentation of protostellar disks has long been considered as one of the possible formation mechanisms of giant planets and brown dwarfs (e.g., Boss 1998; Rice et al. 2003; Mayer et al. 2007; Vorobyov & Basu 2010; Zhu et al. 2012; Vorobyov 2013; Stamatellos 2015). Disk fragmentation tends to occur at radial distances beyond 100 au from the central star, where the cooling time becomes shorter than the local dynamical timescale (e.g., Johnson & Gammie 2003; Rafikov 2005, but see also Meru 2015). The importance of disk fragmentation as a likely mechanism for giant planet and brown dwarf formation has been reinforced by the detection of wide-orbit (from several tens to hundreds of astronomical units) planetary and brown dwarf companions to low-mass stars (e.g., Marois et al. 2008; Kalas et al. 2008; Lafrenière et al. 2010), the existence of which is difficult to explain in the framework of the core accretion mechanism for giant planet formation. Indeed, the timescales for the accumulation of giant planet atmospheres around solid protoplanetary cores in the core accretion models are much longer than the typical age of gaseous disks at distances beyond 10 au (e.g., Stökl et al. 2016).
Recently, yet another planet-formation mechanism has emerged, which combines elements of both disk fragmentation and core accretion scenarios. In this mechanism, known as tidal downsizing, gaseous clumps that form in the disk’s outer regions through gravitational fragmentation migrate inward, accumulating solid cores in their interior and losing part (or all) of their gaseous atmospheres through stellar tidal torques. The exact outcome of inward migration depends on many parameters, such as the migration speed of the clumps, the efficiency of dust settling in the clump interiors, the thermodynamics of the clumps, and so on; the final product can be a population of giant planets, icy planets, and even terrestrial-like planets in the inner disk. The key elements of tidal downsizing have been developed over the past few decades. The possibility for the formation of solid cores inside gaseous clumps was suggested by, for example, Decampli & Cameron (1979), Boss (1998), and Boley et al. (2010), and the inward migration, ejection, and survival of gaseous clumps were investigated by Vorobyov & Basu (2005, 2010), Zhu et al. (2012), and Vorobyov (2013). The refined theoretical foundation for the tidal downsizing theory was finally put forward in a series of papers by Nayakshin (2010a,b, 2017b).
An interesting implication of the tidal downsizing theory is that the inward migration of gaseous clumps can result not only in the formation of planets, but also in accretion bursts similar in magnitude to FU-Orionis-type eruptions when gaseous clumps are tidally destroyed and accreted by the protostar. Originally suggested in a series of papers by Vorobyov & Basu (2005, 2010, 2015), the idea of FU-Orionis-type eruptions triggered by inward clump migration and tidal destruction was further investigated semi-analytically by Nayakshin & Lodato (2012) and numerically using two-dimensional (2D) thin-disk and three-dimensional (3D) numerical (magneto)hydrodynamics simulations by Machida et al. (2011), Vorobyov et al. (2013b), Meyer et al. (2017), Zhao et al. (2018), and Whelan et al. (2018), showing that this mechanism can operate in both low- and high-mass star formation, and also in the primordial stars.
In this paper, we investigate the process of clump migration in a gravitationally unstable disk using high-resolution numerical hydrodynamics simulations. The use of the thin-disk limit allows us to compute the disk evolution during the entire embedded phase of star formation and achieve a numerical resolution as small as 0.1 au. We focus on the properties of one of the gaseous clumps formed in the disk via gravitational fragmentation and investigate the details of its inward migration until it is destroyed by the action of stellar tidal torques. We emphasize that we do not use or insert sink particles as proxies for gaseous clumps, as, for example, in Baruteau et al. (2011) and Stamatellos (2015), but instead study the evolution and dynamics of thermally and rotationally supported, self-gravitating gaseous clumps. This allows us to study their internal structure, mass loss, and prospects of planetarycore formation, as in, for example, Cha & Nayakshin (2011), Galvagni et al. (2012), and Galvagni & Mayer (2014).
The organization of this paper is as follows. A brief description of the numerical model is provided in Sect. 2. The global disk evolution is considered in Sect. 3. The migration of gaseous clumps is investigated in Sect. 4. The effects of the boundary and stellar motion are studied in Sect. 5. The main results are summarized in Sect. 6.
2 Model description
Our numerical model was described in detail in Vorobyov & Basu (2010) and, with some modifications, in Vorobyov & Basu (2015). Below, we briefly review the aspects of the model that are most relevant to the present work. We use numerical hydrodynamics simulations in the thin-disk limit to compute the formation and long-term evolution of a circumstellar disk. Our numerical simulations start from the gravitational collapse of a starless core with a typical radius of 104 au. They continue into the embedded phase of star formation, when a star, disk, and envelope are formed. The simulations are terminated in the T Tauri phase, when most of the envelope has accreted onto the central star plus disk system. The main physical processes taken into account are disk heating via stellar and background irradiation of the disk surface, shock heating, turbulent heating, described via the Shakura & Sunyaev α-parameterization, disk self-gravity, and radiative cooling from the disk surface. To avoid overly small time steps, we set a dynamically inactive sink cell in the center of our computational domain with a radius of rsc = 15 au and introduce a point-mass protostar in the center of the sink cell when the gas surface density there exceeds a critical value for the transition from isothermal to adiabatic evolution.
The equations of mass, momentum, and energy transport in the thin-disk limit are
 (1)
(1)
![Mathematical equation: \begin{equation*} \frac{\partial}{\partial t}\left(\Sigma \bm{v}_{\textrm{p}}\right)+\left[\bm{\nabla} \cdot \left(\Sigma \bm{v}_{\textrm{p}}\otimes \bm{v}_{\textrm{p}}\right)\right]_{\textrm{p}}=-\bm{\nabla}_{\textrm{p}} P+\Sigma \bm{g}_{\textrm{p}}+\left(\bm{\nabla}\cdot \bm{\Pi}\right)_{\textrm{p}},\end{equation*}](/articles/aa/full_html/2018/10/aa33226-18/aa33226-18-eq2.png) (2)
(2)
 (3)
(3)
where subscripts p and p ′ refer to the planar components (r, ϕ) in polar coordinates, Σ is the mass surface density, e is the internal energy per surface area, P is the vertically integrated gas pressure calculated via the ideal equation of state as P = (γ − 1)e with γ = 7∕5,  is the velocity in the disk plane,
  is the gravitational acceleration in the disk plane and
  is the gradient along the planar coordinates of the disk. Viscosity enters the basic equations via the viscous stress tensor Π and we calculate the magnitude of kinematicviscosity ν using the α-parameterization with a uniform α = 0.01.
The cooling and heating rates Λ and Γ take the disk cooling and heating due to stellar and background irradiation into account based on the analytical solution of the radiation transfer equations in the vertical direction (see Dong et al. 2016, for detail)1:
 (4)
(4)
where  is the midplane temperature, μ = 2.33 is the mean molecular weight,
  is the universal gas constant, σ the Stefan–Boltzmann constant, τR and τP are the Rosseland and Planck optical depths to the disk midplane, and κP and κR (in cm2 g−1) are the Planck and Rosseland mean opacities taken from Semenov et al. (2003).
The heating function per surface area of the disk is expressed as
 (5)
(5)
where Tirr is the irradiation temperature at the disk surface determined from the stellar and background black-body irradiation as
 (6)
(6)
where Firr(r) is the radiation flux (energy per unit time per unit surface area) absorbed by the disk surface at radial distance r from the central star. The latter quantity is calculated as
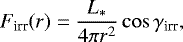 (7)
(7)
where γirr is the incidence angle of radiation arriving at the disk surface (with respect to the normal) at radial distance r. The incidence angle is calculated using a flaring disk surface as described in Vorobyov & Basu (2010). The stellar luminosity L* is the sum of the accretion luminosity L*,accr = (1 − ϵ)GM*Ṁ∕2R* arising from the gravitational energy of accreted gas and the photospheric luminosity L*,ph due to gravitational compression and deuterium burning in the stellar interior. The stellar mass M* and accretion rate onto the star Ṁ are determined using the amount of gas passing through the sink cell. The properties of the forming protostar (L*,ph and radius R*) are calculated using the stellar evolution tracks provided by the STELLAR code (Yorke & Bodenheimer 2008). The fraction of accretion energy absorbed by the star ϵ is set to 0.1.
2.1 Modifications to the original model
The main differences with previous studies of Vorobyov & Basu (2010, 2015) are (1) an increased numerical resolution, (2) different treatments of the inner boundary condition, and (3) stellar motion in response to the gravitational force of the disk. In this work, we used 1024 × 1024 grid cells, which is a factor of two to four higher in each coordinate direction than in our previous studies. We also increased the radius of the sink cell from 5 to 15 au because we are now interested in the dynamics of gaseous clumps (or fragments) at distances onthe order of several tens to hundreds of au from the star. The use of the logarithmically spaced grid in the r-direction and equidistant grid in the ϕ-direction allowed us to resolve the disk in the vicinity of the sink cell with a numerical resolution as small as 0.1 au and achieve a sub-au resolution up to r = 150 au. The inner 150 au are of particular interest for the current work, because this is where the inward migration of gaseous fragments formed through disk fragmentation takes place. A higher numerical resolution makes it also possible to better resolve the internal structure of migrating fragments.
We considered two variants of the inner boundary conditions: the free outflow boundary and the free inflow–outflow boundary. In the first case, the matter is allowed to flow out of the active computational domain, but is not allowed to flow in. This means that zero gradients of the gas density, pressure, and radial velocity are applied at the sink – active disk interface when vr < 0 (the flow is directed toward the sink). When vr ≥ 0 (the flow is directed toward the active disk), the reflecting boundary condition is used. The azimuthal velocity is extrapolated from the active disk to the sink cell assuming a Keplerian rotation. The disadvantage of the outflow boundary condition is that it may lead to an artificial drop in the gas surface density near the disk inner edge when wave-like motions are present in the inner disk caused, for example, by a perturbation from spiral arms or gaseous clumps orbiting the protostar.
In the inflow–outflow boundary condition, the matter is allowed to flow freely from the active disk to the sink cell and vice versa. If the matter flows from the active disk in the sink cell (radial velocity at the interface is negative), the mass of material that passes through the sink cell is further redistributed between the central ptotostar and the sink cell as ΔMflow = ΔM* + ΔMs.c. (see Fig. 1) according to the following algorithm:
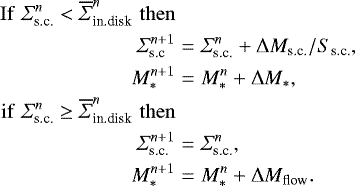
Here, Σs.c. is the surface density of gas in the sink cell,  is the averaged surface density of gas in the inner active disk (the averaging is usually done over several au immediately adjacent to the sink cell, the exact value is determined by numerical experiments), and Ss.c. is the surface area of the sink cell. The exact partition between ΔM* and ΔMs.c. is usually set to 95:5%. If the matter flows from the sink cell to the active disk (radial velocity at the interface is positive), then we update only the surface density in the sink cell as
 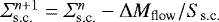 and do not change the mass of the central star.
The calculated surface densities in the sink cell  are used at the next time step as boundary values for the surface density. The radial velocity and pressure in the sink cell are determined from the zero gradient condition, while the azimuthal velocity is extrapolated from the active disk to the sink cell assuming a Keplerian rotation. These inflow–outflow boundary conditions enable a smooth transition of the surface density between the inner active disk and the sink cell, preventing (or greatly reducing) the formation of an artificial drop in the surface density near the inner boundary. We ensure that our boundary conditions conserve the total mass budget in the system. Finally, we note that the outer boundary condition is set to a standard free outflow, allowing for material to flow out of the computational domain, but not allowing any material to flow in.
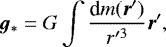
To explore the effects of stellar motion in response to the gravity force of the disk (including fragments), the term − Σ g* was added to the right-hand side of Eq. (2), so that this equation now describes the transport of momentum in the non-inertial frame of reference moving with the star. The acceleration of the star’s frame of reference g* can be expressed as
 (8)
(8)
where dm is the mass in a grid cell with position vector r′. In practice, we find g* by first calculating its Cartesian components g*,x and g*,y as

where ϕk is the azimuthal angle of the grid cell (j, k), the summation is performed over all grid zones and the force (per unit stellar mass) acting from the grid cell (j, k) onto the star can be expressed in the following form
 (11)
(11)
where mj,k is the mass in the grid cell (j, k) and rj is the radial distance to the grid cell (j, k).
Once the Cartesian components g*,x and g*,y of the stellar acceleration are known in every grid cell, the corresponding polar grid components can be found using the standard coordinate transformation formula

where ϕ is the azimuthal coordinate of a given grid cell. More detail can be found in Regály & Vorobyov (2017b).
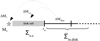 |
Fig. 1 Schematic illustration of the inner inflow–outflow boundary condition. The mass of material ΔMflow that passes through the sink cell from the active inner disk is further divided into two parts: the mass ΔM* contributing to the growing central star, and the mass ΔMs.c. settling in the sink cell. |
2.2 Initial conditions
The initial radial profile of the gas surface density Σ and angular velocity Ω of the pre-stellar core has the following form:
 (14)
(14)
![Mathematical equation: \begin{equation*} \mathrm{\Omega}=2\mathrm{\Omega}_{0}\left(\frac{r_{0}}{r}\right)^{2}\left[\sqrt{1+\left(\frac{r}{r_{0}}\right)^{2}}-1\right],\end{equation*}](/articles/aa/full_html/2018/10/aa33226-18/aa33226-18-eq22.png) (15)
(15)
where Σ0 and Ω 0 are the angular velocity and gas surface density at the center of the core, respectively,  is the radius of the central plateau, where cs is the initial isothermal sound speed in the core. This radial profile is typical of pre-stellar cores formed as a result of the slow expulsion of magnetic field due to ambipolar diffusion, with the angular momentum remaining constant during axially symmetric core compression (Basu 1997). The value of the positive density perturbation A is set to 1.2, making the core unstable to collapse. The initial gas temperature in collapsing cores is Tinit = 10 K. We consider a numerical model with Ω 0 =1.2 km s−1 pc−1, Σ 0 =5.2 × 10⁻² g cm-2, and r0 = 2400 au. The resulting core mass Mcore = 1.1 M⊙ and the ratio of rotational to gravitational energy β = 6.1 × 10⁻³.
3 Global disk evolution
In this section, we analyze the global evolutionary trends that are typical of our model disk, while in Sect. 4 we focus on a shorter time period and analyze the inward migration of one of the gaseous clumps formed in the disk through gravitational fragmentation. The fiducial model considered in this section and Sect. 4 is characterized by the free outflow boundary condition and the motionless central star. The effects of stellar motion and the free inflow–outflow boundary condition are considered in Sect. 5.
When disk fragmentation takes place, we distinguish the newly formed fragments from the rest of the disk (e.g., from the spiral arms) using the fragment-tracking method (first introduced in Vorobyov 2013) that searches for the disk regions satisfying the following criteria. First, we identify the local surface density peaks in the disk and stipulate that they represent the centers of the fragments if the gas surface density in these peaks is at least a factor of ten higher than the azimuthally averaged gas surface density at the same radial distance from the star. The exact factor was found using experiments and visual checks. After the center of the fragment with coordinates (rc, φc) has been identified, we determine the neighboring mesh cells belonging to the fragment by imposing the following two conditions on the gas pressure P and gravitational potential Φ
![Mathematical equation: \begin{eqnarray}\frac{\partial P}{\partial r'}+\frac{1}{r'}\frac{\partial P}{\partial\varphi'}<0,\\[4pt]\frac{\partial\mathrm{\Phi}}{\partial r'}+\frac{1}{r'}\frac{\partial\mathrm{\Phi}}{\partial\varphi'}>0,\end{eqnarray}](/articles/aa/full_html/2018/10/aa33226-18/aa33226-18-eq24.png)
where r′ = r − rc and φ′ = φ − φc. Equation (17) requires that the fragment is pressure supported, with a negative pressure gradient with respect to the center of the fragment. Equation (17) requires that the fragment is kept together by gravity, with the potential well being deepest at the center of the fragment. If these conditions fail at the center of the fragment, then the fragment is rejected, meaning that we have falsely taken a local density perturbation for a pressure-supported, gravity-bound fragment. If these conditions are fulfilled at the center of the fragment, we continue marching from the center and checking the neighboring cells until any of the conditions is violated. The grid cells that fulfill both conditions constitute the fragment. We checked the validity of this algorithm by random visual checks and found it to be satisfactory in most cases.
Figure 2 presents the gas surface density images in the inner 600 × 600 au2 box at nine evolutionary times, starting soon after the disk formation and ending after 0.5 Myr of disk evolution when most of the initial core mass has accreted onto the star plus disk system. We, therefore, capture the entire embedded phase of disk evolution. All times in the current paper are calculated from the instance of central star formation, if not stated otherwise, and the disk forms at t = 29 kyr. The fast increase in the disk size is evident in the top row. The first fragment forms at t ≈ 60 kyr at a distance of ≈ 100 au, in agreement with other studies of gravitationally unstable disks showing that disk fragmentation is most likely to occur in the disk outer regions, r≳50 au (e.g., Stamatellos & Whitworth 2009; Boley 2009). In the subsequent evolution, more fragments emerge in the disk, as shown by the red arrows, but their number does not grow steadily with time due to the presence of several mechanisms that lead to the loss of fragments. These mechanisms include merging of two fragments due to close encounters, ejection of fragments from the disk due to multi-body gravitational interaction (e.g., Basu & Vorobyov 2012; Vorobyov 2016), and inward migration of fragments followed by their tidal destruction and accretion onto the central star (Vorobyov & Basu 2010, 2015; Cha & Nayakshin 2011; Zhu et al. 2012). The middle row of panels in Fig. 2 is dedicated to a particular fragment, referred to as IF1, whose properties and inward migration are studied in detail in Sect. 4.
To check if the Toomre criterion for disk fragmentation is fulfilled in our model, we calculate the Toomre Q-parameter and search for the disk regions where Q < 1.0 (Toomre 1964). The Q-parameter for the case of a Keplerian disk is defined as
 (18)
(18)
where cs is the local sound speed, Ω and Σ are the local angular velocity and gas surface density in the disk, respectively. The yellow contour lines in the top row of Fig. 2 outline the regions of the disk where the Toomre parameter is less than unity and the red arrows point to the identified fragments. Clearly, all fragments are surrounded by compact disk regions with Q < 1.0, fulfilling the Toomre fragmentation criterion. At the same time, disk regions that are characterized by Q < 1 also exist, but they contain no fragments; these regions may form fragments later. We note that in the early evolution, at t < 140 kyr, all fragments are located at radial distances r > 100 au, where disk fragmentation is most likely. In the later evolution, however, some fragments are seen at much smaller radial distances, on the order of several tens of au. Although disk fragmentation at these distances is possible if induced by fragments already present in the disk (Meru 2015), in our case this is the result of inward migration and scattering, which we discuss in more detail in Sect. 4.
Figure 2 demonstrates that no fragments are present in the disk at the end of numerical simulations (t =0.495 Myr), meaning that none of the previously formed fragments have survived through the embedded phase of disk evolution. This indicates that although disk fragmentation can be common in the embedded phase, the survivability of the fragments is low (see, e.g., Vorobyov 2013) and most, if not all, fragments are destroyed by the end of the embedded phase. There is, however, one caveat to this conclusion. When considering the evolution of fragments, we did not take into account their possible contraction to planetary-sized objects. This occurs if the gas temperature exceeds 2000 K, molecular hydrogen dissociates, and the interiors of the fragments experience fast contraction due to the loss of pressure support (see, e.g., Masunaga & Inutsuka 2000). Resolving this process requires a much higher numerical resolution than is affordable in our core collapse and disk formation simulations. Alternatively, one can introduce sink particles as proxies for the fragments, a practice often adopted in studies of disk fragmentation (see, e.g., Federrath et al. 2010). In this case, however, one cannot resolve the internal structure of the fragments. In Sect. 4, we analyze the consequences of our adopted approximation and demonstrate that some fragments may give birth to dense, planetary-sized objects before finally being destroyed by the action of stellar tidal torques.
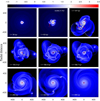 |
Fig. 2 Gas surface density maps (g cm-2, log units) in the fiducial model shown at nine times since the formation of the central protostar. Only the inner 600 × 600 au2 box is shown. The total computational region extends to 14 000 au in the r-direction. The contour lines in the top-left panel outline the regions where the Toomre Q-parameter is less than unity and the red arrows point to the identified fragments in the disk. Fragment IF1 is marked by the yellow arrows in the middle row of panels; its dynamics is considered in detail in Sect. 4. |
4 Dynamics of fragment IF1
The simultaneous presence of several fragments in the disk may greatly complicate their dynamics and evolution. In this section, the dynamics of four fragments, denoted further in the text as IF1 (inner fragment 1), OF1, OF2, and OF3 (outer fragments 1, 2, and 3, respectively), are studied in detail to show how the interaction between different fragments occurs in the disk and what may be the consequences of this interaction. We particularly focus on the structure and dynamics of IF1, as it shows the most interesting behavior when approaching the central protostar.
Figure 3 presents the disk surface density distributions at six consecutive times starting from the time instance when OF1 forms in the disk and ending when IF1 halts its inward migration and settles on a quasi-stable orbit. In the following text, the time is counted from t0 = 153.5 kyr and is referred to as  . The yellow arrows in Fig. 3 mark IF1, while the red arrows mark OF1, OF2 and OF3. Panel a demonstrates that OF1 starts forming at
  kyr from a local density enhancement that fulfills the Toomre fragmentation criterion, as can be seen from the yellow contour lines outlining the disk regions with Q < 1. OF1 is fully formed already at
  kyr and its mass at this time instance is 4.5 Jovian masses. We also checked whether or not the regions with Q < 1 satisfy the Gammie criterion (Gammie 2001) stating that the local cooling time tcool should be shorter than the fastest growth time of gravitational instability
  . The disk regions that satisfy both the Gammie and Toomre criterions are outlined with the black contour lines in panel a of Fig. 3. Clearly, these regions are more compact than the regions outlined by the Q < 1 criterion only, meaning that these two criteria, when applied together, are more stringent than the Toomre criterion alone. Nevertheless, the regions where both criteria are fulfilled are present in several disk locations and the formation of OF1 fulfills both criteria.
To check if the mass of OF1 is in agreement with theoretical expectations, we used Eq. (3) from Vorobyov (2013) expressing the Jeans length RJ in a thin disk as
 (19)
(19)
where  is the 2D velocity dispersion. To find RJ, we first calculated the mean values of the gas surface density and midplane temperature (
 and
and  ) inside the region with Q < 1 centered onthe forming OF1. The resulting mass of OF1, calculated as
  , is equal to 12.7 MJup, which is a factor of three higher than what was found using the fragment-tracking method. To resolve this discrepancy, we note that the region that finally collapses to form OF1 may be smaller than that outlined by the Q < 1 condition. Agood agreement is found if we consider the disk region around the forming fragment that fulfills a more stringent Q < 0.5 condition on disk fragmentation. A more stringent Toomre condition for fragmentation was also reported in the recent work of Takahashi et al. (2016).
Panels b and c of Fig. 3 show the time instances when OF1 has fully formed and starts interacting gravitationally with IF1. A spiral arc connecting both fragments develops during the closest approach between the two fragments and the angular momentum is redistributed so that IF1 starts spiralling toward the central protostar and OF1 is pushed to a higher orbit.
The interaction between IF1 and OF1 is illustrated in Fig. 4, showing the radial distances of OF1 and IF1 from the protostar as a function of time. We also show the relative distance between OF1 and IF1, which changes with time due to migration and the different angular velocities of the fragments. The time instance of the closest approach between IF1 and OF1 is marked with the arrow in Fig. 4. Before the formation of OF1 ( kyr), IF1 orbited the protostar at a distance of 110–120 au. Soon after the closest approach between OF1 and IF1, the radial distance of the latter starts rapidly decreasing, indicating that it lost angular momentum during this event, while the radial distance of OF1 starts increasing, implying that it gained angular momentum. Interestingly, IF1 halts its inward migration at
  kyr and starts orbiting the protostar at a radial distance of ≈ 25 au. The reasons that cause IF1 to halt its inward migration are discussed in detail in Sect. 4.1.
The close encounter of IF1 with OF1 played the role of a trigger, which initiated a rapid inward migration of IF1. However, other fragments in the disk, such as OF2 and OF3, or other structures in the disk, such as spiral arms and local density enhancements, probably also played an important role in the inward migration ofIF1. To determine their influence on the dynamics of IF1, we calculated the gravitational torques τi exerted on IF1 by the ith grid cell of the disk as
 (20)
(20)
where |rf| is the distance between the center of the fragment and the protostar (i.e., the lever arm), |Fi| is the gravitational force acting on the fragment from the ith cell, and γi is the angle between the lever arm and the force. When calculating τi, we excluded the grid cells belonging to IF1 itself. The gravity force is calculated as
 (21)
(21)
where Mf is the mass of the fragment, mi is the mass inside the ith grid cell, and Ri is the distance between the ith cell and the center of IF1.
The total torque τtot = ∑ iτi acting on IF1 can be related to its angular momentum as
 (22)
(22)
and can therefore give us an insight into the radial migration of the fragment – the negative τtot would imply that the fragment is losing its angular momentum and approaching the star, while the positive τtot would implythe opposite.
Figure 5, presents the spatial maps of individual torques |τi | (by the absolute value) exerted on IF1 by each grid cell of the disk. The position of IF1 is marked with the red arrow and the times are similar to those in Fig. 3. The fragment itself is highlighted by the black color to emphasize that the grid cells constituting the fragment do not contribute to the calculation of τtot. Clearly, τi is equal to zero for the grid cells located at the line passing through the star and the center of IF1 (because sin γi = 0). This line divides the disk into two halves, each one characterized by a distinct sign of the torque, positive or negative, that they exert on IF1. To distinguish between parts of the disk with positive and negative torques, we used the “+” and “–” signs, respectively. We note that IF1 orbits the star in the counterclockwise direction. Therefore, torques from part of the disk that is located ahead of the IF1 direction of rotation are positive.
A comparison of Figs. 5 and 3 indicates that the disk regions with the highest gas surface density, such as fragments and spiral arms, exert the strongest torques on IF1. Moreover, the torque exerted by OF1 is evidently not the strongest. For example, the arc connecting OF1 and IF1 at  kyr exerts a comparable torque on IF1. This supports our previous conjecture that the close approach of OF1 with IF1 acts only as a trigger, which initiates the fast inward migration of IF1, and the input from the entire disk needs to be considered when analyzing the migration of fragments in a self-gravitating disk. We also note that the torques acting on IF1 appear to decrease by absolute value at later times as IF1 approaches the star.
In Fig. 6, we compare the gravitational torques exerted on IF1 by OF1, OF2, and OF3, and also by the entire disk. More specifically, the top panel shows the torques exerted by each of the three fragments separately, while the bottom panel shows the torque exerted by the three fragments taken together, by the entire disk, and by the entire disk, but excluding the three fragments. Clearly, the torques from each of the three fragments (OF1, OF2, and OF3) are comparable in terms of their absolute value, but appear to be “out of phase”, partly canceling each other. As a result, the cumulative torque from the three fragments (the black line in the bottom panel) has a sinusoidal shape with an amplitude that gradually declines with time. We note that after the closest approach between IF1 and OF1 (at  kyr), the disk torque becomes both negative and much higher by absolute value than the cumulative torque from the three fragments. The subsequent inward migration of IF1 is therefore sustained by the disk rather than by the fragments. The main input to thedisk torque may be from the spiral arc that connects OF1 with IF1 during their closest approach (
 kyr) and later transforms in a spiral tail, which is visible in the wake of IF1 at
  kyr and
  kyr.
kyr.
Figure 7 shows the gas surface density distribution in and around IF1 during its inward migration toward the protostar. Three different time instances are shown and every panel has progressively smaller spacial scales to better resolve the fragment. The black arrows show the gas velocity field in the frame of reference of the center of IF1. Clearly, IF1 rotates in the same direction as the disk. Only the arrows for every 30th grid cell in each coordinate direction are shown, to avoid cluttering. The shape of IF1, found with the fragment-tracking algorithm of Sect. 3, is outlined with the red curves. The yellow circles outline the Hill radius for IF1 calculated as
 (23)
(23)
where Mf is the mass of the fragment confined within the red curve.
As IF1 approaches the star, its size shrinks because of the shrinking Hill radius and its shape becomes distorted through the action of tidal torques. Simultaneously, part of its material starts streaming away along the tidal arms. As a result, the fragment loses a large fraction of its initial mass through the leading and trailing tidal arms. Finally, the rotational motion inside IF1 almost disappears ( kyr), turning intoa sheer outflow. At this stage, IF1 ceases to be gravitationally supported and tidal torques tear apart the fragment.
The tidal destruction of IF1 is accompanied by an accretion burst with a magnitude typical of the FU-Orionis-type eruptions (Audard et al. 2014). Figure 8 shows the mass accretion rate Ṁ through the sink cell, the mass of IF1, and the radial distance of IF1 from the protostar as a function of time. As the fragment migrates inward, it first accumulates mass (reaching a peak value of ≈ 38 MJup), but then rapidly loses a large fraction of its mass when approaching a distance of 25 au. This rapid mass loss produces an accretion burst with a duration of about 50 yr and magnitude approaching 10−4 M⊙ yr−1. During the time period of 650 yr centered on the burst (and outlined by the two vertical dashed lines), the fragment has lost 24 MJup, while only 8.7 MJup has passed through the sink cell. This means that only about one third of the mass lost by IF1 passes through the sink celltriggering the accretion burst, while the remaining two thirds stay in the inner disk. In the subsequent evolution, IF1 continues to lose its mass, but at a slower rate until it finally disperses around  yr, producing another burst of a longer duration and smaller amplitude (≈ 2 × 10⁻⁵ M⊙ yr−1). The orbital distance of IF1 (≈ 25 au) does not change notably after the first burst and it makes seven revolutions at this quasi-stable orbit2.
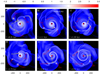 |
Fig. 3 Gas surface density distributions in the fiducial model at several time instances focusing on the inward migration of IF1. The time is counted from t0 = 153.5 kyr. The position of IF1 is marked with the yellow arrows, while the positions of OF1, OF2, and OF3 are marked with the red arrows. The yellow contour lines outline disk regions with the Toomre Q-parameter smaller than unity, while the black contour lines show the disk regions satisfying both the Toomre and Gammie criteria for disk fragmentation. The disk rotates counter clockwise. |
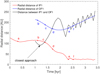 |
Fig. 4 Radial distances of IF1 and OF1 from the protostar (the red and blue lines, respectively) as a function of time. The black line shows the relative distance between IF1 and OF1. The letters indicate the time instances corresponding to panels b–f in Fig. 3. |
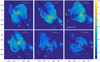 |
Fig. 5 Spatial maps of the absolute torque exerted on IF1 by the rest of the disk. The times are similar to those shown in Fig. 3. The disk rotates counterclockwise. The red arrows point to IF1. Partsof the disk characterized by the positive and negative torque are marked with the “+” and “-” signs, respectively, and the black dashed line separates these parts. The color bar shows the torque values in log dyne cm. The red contour line highlights the disk regions where the torque exceeds 1038 dyne cm. |
4.1 Halt of inward migration
In this section, we discuss the possible reasons for the halt of the IF1 inward migration. Figure 9 shows the total gravitational torque (τtot) exerted on IF1 by the entire disk (including other fragments), the radial distance of IF1 from the protostar, and the mass of IF1 as a function of time. Initially, τtot stays small, switching in sign from positive to negative and back. The position of IF1 reflects these changes in τtot and IF1 wobbles around a radial distance of 110 au. At  kyr, a close approach of OF1 with IF1 triggers the fast inward migration of the latter. Simultaneously, τtot becomes negative and increases by absolute value until
  kyr. At this timeinstance, the process of mass growth reverses and IF1 starts quickly losing most of its mass. In the subsequent evolution, the total disk torque drops (by absolute value) to near zero and the inward migration of IF1 halts. We note that the decrease in τtot (
 kyr) correlates with the burst of accretion, implying that the tidal truncation of IF1 may be the reason for the ultimate decrease in τtot.
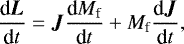
To further analyze the inward migration and halt of IF1, we note that the time derivative of the total angular momentum of IF1 can be expressed as
 (24)
(24)
where J = rf × v is the specific angular momentum of IF1 and v is its velocity. Figure 10 presents the time evolution of  and
and  . Initially, the rate of change of J is negative and the rate of change of Mf is positive, meaning that IF1 initially gains mass and loses specific angular momentum when approaching the protostar. After this time instance, however, the signs of
  and
and  flip and the fragment starts gaining specific angular momentum and losing its mass through tidal torques. We note that the specific angular momentum of IF1 can be related to its centrifugal acceleration as
 (25)
(25)
The fact that J increases while rf decreases implies that the centrifugal acceleration of IF1 quickly increases after  kyr, which helps to halt its inward migration. We note that both JdMf∕dt and MfdJ∕dt are much greater by absolute value than dL∕dt (see τtot in Fig. 9), so that small variations in dL∕dt during the inward migration of IF1 do not invalidate our analysis. We conclude that the tidal truncation of IF1 and the associated increase in its specific angular momentum help to halt the fast inward migration of IF1.
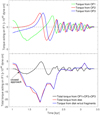 |
Fig. 6 Top panel: torque exerted on IF1 from OF1 (the green line), OF2 (the red line), and OF3 (the blue line) vs. time. Bottom panel: torque exerted on IF1 by OF1, OF2, and OF3 taken together (the black line), by the entire disk (the red line), and by the entire disk, but excluding the torque from the fragments (the blue line) vs. time. We note the difference in scales. |
4.2 Formation of a protoplanetary core
The fragments considered in our numerical simulations are the first hydrostatic cores in the context of star formation. Their sizes range between a few au and a few tens of au, which makes them vulnerable to the action of stellar tidal torques at radial distances of several tens of au and smaller. However, when the gas temperature in the interiors of the fragments exceeds ≈ 2000 K, molecular hydrogen dissociates and the so-called second collapse ensues, leading to the formation of a protoplanet or a proto-browndwarf, which can withstand the stellar tidal torques even at sub-au distances. The second collapse is difficult to resolve in global disk simulations such as our own. Nevertheless, we can estimate which part of IF1 would collapse to form a planetary-sized core and which part would form a circumplanetary disk and/or an envelope. We note that IF1 is characterized by fairly strongrotation before the supposed onset of the second collapse, with the ratio of rotational to gravitational energy βIF1 = 9.5%. Therefore, we may expect the formation of a fairly massive disk and/or envelope during the second collapse.
Figure 11 presents the mass, radial distance, and central temperature of IF1 as a function of time. The vertical dashed line indicates the time instance ( kyr) when the central temperature reaches 2000 K and the second collapse is supposed to take place. This is also the time when the mass of IF1 reaches a maximum value of about 38 MJup. The central temperature continues to increase until IF1 is heavily truncated by the tidal torques at
  kyr. In the subsequent evolution, the central temperature drops again.
To calculate the fraction of IF1 that would form the protoplanetary core at  kyr, we split IF1 into a series of concentric annuli and calculated the azimuthally averaged surface density and angular velocity profiles (in the frame of reference of the center of IF1) as a function of the radial distance from the center of the fragment. The first data point lies at r = 0.5 au and we extrapolated both distributions to smaller radii assuming that vϕ approaches zero in the center (no gravity point-source) and Σ has a constant density plateau in the inner regions of IF1. The corresponding profiles are shown in the top panel of Fig. 12. We then calculated the centrifugal radius of each annulus using the following expression
 (26)
(26)
where Mf(r) is the mass contained within the radial distance r from the center of IF1. Equation (26) assumes that the specific angular momentum J of each annulus is conserved during the second collapse.
The bottom panel of Fig. 12 presents the centrifugal radius and the enclosed mass of IF1 as a function of the radial distance from the center of the fragment. The horizontal dashed line marks the radius of the second hydrostatic core, taken to be Rs.core = 5RJup. We note that the exact value of Rs.core is rather uncertain, but most studies assume it to vary from several to ten RJup (Hosokawa et al. 2011; Baraffe et al. 2012; Vorobyov et al. 2017). The part of IF1 that lies to the left of the vertical dashed line at Rcrit = 0.16 au is characterized by Rcf ≤ Rs.core. During the second collapse, all material that lies inside Rcrit would directly form the protoplanetary core. On the other hand, the material that lies outside Rcrit would hit the centrifugal barrier before landing on the protoplanetary core and would rather form a disk and/or envelope around the core.
We found that if IF1 had collapsed at  kyr, it would have formed a protoplanetary core with a mass of 0.81 MJup, which is only a small fraction of the fragment’s total mass at this time instance (37 MJup). If we increase or decrease the radius of the second hydrostatic core by a factor of two, the resulting mass of the protoplanetary core becomes 1.4 MJup or 0.45 MJup, respectively. We note that the core will most certainly continue growing in mass through accretion, but the terminal mass is uncertain. We expect that during the subsequent inward migration, the protoplanetary core may lose part of its circumplanetary material through tidal torques, perhaps creating an accretion burst similar to what has happened with IF1. The protoplanetary core itself would, however, survive and settle at an orbit of approximately a few tens of au.
In a future study, we plan to test this hypothesis, introducing a sink particle at the time instance of supposed second collapse. A number of young stars have planetary-mass companions orbiting the host star at radial distances from 10 to 100 au (e.g., Fomalhaut b, 51 Eri b, HR 8799). For instance, four planets of HR 8799 (b, c, d, e) orbit the star at radial distances of 15, 24, 38, and 68 au, respectively. The second collapse of IF1 followed by tidal truncation could explain the formation of planets b, c, or d in the HR 8799 system.
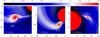 |
Fig. 7 Zoomed-in view on IF1 during its inward migration toward the protostar. The black arrows show the gas velocity field superimposed on the gas surface density distribution. The shrinking spatial scales are used to better resolve thefragment. The yellow circles mark the Hill radius of the fragment and the red curves outline the fragment shape as determined by the fragment-tracking method. The color bar shows the gas surface density in log g cm−2. |
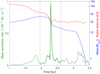 |
Fig. 8 Massaccretion rate through the sink cell (the green line), radial distance of IF1 from the star (the red line), and mass of IF1 (the blue line) as a function of time. |
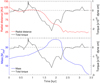 |
Fig. 9 Top panel: gravitational torque acting on IF1 from the entire disk including other fragments (the black line) and the radial distance of IF1 (the red line) as a function of time. Bottom panel: gravitational torque (the black line) and the mass of IF1 vs. time (the blue line). |
5 Effects of the inner boundary and stellar motion
In the fiducial model used in the previous sections we imposed a free outflow inner boundary condition, so that the matter was allowed to flow from the computational domain to the sink cell, but was prevented from flowing in the opposite direction. We also set a fixed star in the coordinate center and did not allow it to move in response to the gravity force of the disk and fragments. In this section, we relax both assumptions. We consider two models: one with a free inflow–outflow boundary condition (see Sect. 2.1), but the fixed star (hereafter, model IOB, “inflow–outflow–boundary”) and the other with the free outflow boundary condition, but with the star moving in response to the gravity force of the disk (hereafter, model SM, “stellar motion”). Stellar motion may be important when the disk is massive and strongly asymmetric, as is the case for gravitationally unstable and fragmenting disks. In this case, the rotation will be around the center of mass of the system, rather than around the central star itself. We restarted our fiducial model from  kyr, but with the aforementioned modifications.
Figure 13 presents the radial distance (top panel), mass (middle panel), and central temperature (bottom panel) of IF1 during its inward migration for the fiducial model, model IOB, and model SM. Clearly, the general evolution is similar in all three models – IF1 migrates inward, first gaining and then loosing its mass, until it finally disperses through the action of tidal torques at a radial distance of 25–30 au. However, there are some differences in the details of inward migration that are described below.
The inner boundary condition has a moderate effect on the dynamics and properties of IF1. The migration timescale of IF1 in model IOB is slightly longer and its maximum mass is slightly higher than in the fiducial model. The inflow–outflow boundary condition reduces the artificial drop in the gas surface density near the inner edge of the disk. As a result, there is more material in the inner disk interior of the IF1 orbit and this material exerts a positive gravitational torque on IF1, slowing down its inward migration.
On the other hand, allowing for stellar motion significantly changes the dynamics and properties of IF1. The timescale of inward migration in model SM is much longer than in the other two models without stellar motion. The slowed-down migration in the presence of stellar motion was previously reported in the context of planet migration by, for example, Regály & Vorobyov (2017a). To explore the reason for the slowed-down migration, we calculated the gravitational torques exerted on IF1 by the entire disk and by the central star with respect to the center of mass of the entire disk plus star system, and plotted these values as a function of time in the top panel of Fig. 14. Clearly, the absolutevalue of the stellar torque is greater than the disk torque, thanks to the greater mass of the star (M* = 0.51 M⊙ vs. Mdisk = 0.18 M⊙) and proximity of the star to IF1 (resulting in a stronger gravitational force). Moreover, both torques show an oscillatory behavior, changing their signs from positive to negative and back again.
The alternating sign of the stellar torque is illustrated in Fig. 15 showing the gas surface density distributions in model SM at several time instances. The center of mass of the disk plus star system is marked by the green dots and the position of the central star is shown by the black star symbol in the coordinate center. The red arrows show the direction of gravitational force F* acting on IF1 from the star, while the green arrows show the direction of the lever arm rc.m. (with respect to the center of mass) used in the calculation of the torque exerted on IF1 by the star. The yellow arrows show the angle γ* between rc.m. and F*. The sign of the torque τ* = rc.m. F* sinγ* exerted on IF1 by the star depends on the value of the angle γ*: the torque ispositive when γ* < 180° and negative when γ* > 180°. The angle γ* in turn depends on the spatial arrangement of IF1, the star, and the center of mass. When the center of mass is leading the fragment, γ* > 180° and vice versa (we note that the disk and fragment rotate counterclockwise).
The alternating sign of both torques affect the character of IF1 migration – it shows alternating inward–outward short-amplitude excursions, but the net result is a slow inward migration, in agreement with the integrated (disk plus star) torque being negative in sign, − 1.88 × 1043 dyne cm, by the end of migration. The slowed-down inward migration also changes the internal properties of IF1. In the model with stellar motion, IF1 accumulates and loses mass much slower than in models without stellar motion (middle panel of Fig. 13), although the maximum attainable mass of IF1 is similar to the other two models. As a result of slow mass accumulation in model SM, the gas temperature in the center of IF1 also grows slowly (bottom panel in Fig. 13). The maximum attainable temperature is also lower (≈ 3800 K) than in the other two models (≈5500 K).
The center of mass of the system and, therefore, the disk and stellar torques are determined by the global disk structure and position of other fragments in the disk. To illustrate this, in the bottom panel of Fig. 14, we plot the disk and stellar torques, but calculated using the material in the inner 145 au, so that only IF1, the inner part of the disk, and the central star are considered. Clearly, the stellar torque is reduced significantly and it is now mostly negative, meaning that the character of IF1 migration would be different in this case – it would likely be a steady inward migration at a faster speed.
Model SM at  kyr shows an interesting phenomenon – the radial distance and the mass of IF1 sharply decrease, while its central temperature increases. During the subsequent 1.0 kyr of evolution the fragment disperses. This is caused by a close encounter of IF1 with another fragment (OF4, outer fragment 4) shown in Fig. 16 with the red arrows. The closest approach occurs at
  kyr and leads tothe ejection of OF4 due to the multi-body gravitational interaction. The ejected fragment has a mass of 7.5 MJup and a velocity of 1.8 km s−1. The escape speed of the star plus disk system, vesc = 1.2 km s−1, is smaller than the velocity of OF4, meaning that we witness a true ejection and not the scattering of a planetary mass object to a wider orbit. The close approach is a paired effect – the ejection of OF4 is causing IF1 to quickly lose its angular momentum and approach the star3. The approach is accompanied by tidal destruction and an accretion burst consisting of one strong peak and several smaller ones, as is shown by the black line in Fig. 17. This figure also shows the radial distances of OF4 and IF1 from the star. Clearly, OF4 moves on a highly eccentric orbit caused by the gravitational interaction with other fragments in the outer disk. During one of its close approaches to the star, the trajectory of OF4 intersects with that of IF1, leading to the ejection of OF4 and accelerated infall of IF1. This phenomenon is therefore a chance effect, but its probability is enhanced by slowed-down migration ofIF1 and eccentric orbit of OF4.
Interestingly, the close approach between OF4 and IF1 causes a sharp increase in the temperature of the latter, probably due to tidal heating. The temperature exceeds 2000 K, which indicates that close approaches between the fragments can facilitate the second collapse and formation of protoplanetary cores.
Finally, it is interesting to compare the results of our simulations with the recent works of Nayakshin (2017a) and Stamatellos & Inutsuka (2018) on the dynamics of protoplanets in gravitationally unstable disks. The work of Nayakshin is most relevant to our study asit also considers the dynamics of gaseous clumps rather than collapsed sink particles. He found that the dynamics of the clumps depend on the dust opacity (scaled up or down with respect to that of Zhu et al. 2009), on the initial seed mass of the clump, and even on the initial azimuthal position of the clump in the disk. Depending on these parameters, the clumps may either quickly migrate toward the star and disperse or quickly gain mass and effectively halt their inward migration at tens of astronomical units. The migration timescales are similar to what was found in our models for the case of a motionless central star and the maximum attainable clump masses, a few tens of Jupiter masses, are also in agreement with our study. There is however a significant difference in the initialsetup of the disk. Nayakshin considers a disk that has only one fragment at a time, while our disks are heavily fragmented and have several fragments at a time. The clump-to-clump interaction introduces another degree of complexity in the clump dynamics and evolution, leading in our models to inward migration of clumps which are otherwise quasi-stable in the Nayakshin models.
It is less straightforward to compare our models with those of Stamatellos & Inutsuka (2018), because they consider thedynamics of point-sized sink particles, that is, the objects that have already experienced second collapse to planetary densities due to dissociation of molecular hydrogen, while we consider the pre-collapsed gaseous clumps. Nevertheless, the estimated mass growth rates of our clumps in the model with stellar motion (see Fig. 13) are in good agreement with a mass accretion rate on the protoplanet, ~ 10−3 MJup yr−1, found in their simulations. The model without stellar motion (Fig. 11), however, yields mass growth rates that are an order of magnitude higher than what is found in Stamatellos & Inutsuka (2018). The effect of protolanetary radiative feedback, which was found to be important for setting the final mass of the protoplanet, can only be studied once we introduce sink particles in our models.
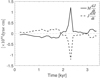 |
Fig. 10 Time evolution of |


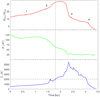 |
Fig. 11 Mass of IF1 (top panel), radial distance of IF1 (middle panel), and central temperature of IF1 (bottom panel), all vs. time. The horizontal dashed line shows a threshold temperature of 2000 K, above which molecular hydrogen dissociates and the second collapse is supposed to ensure. The vertical dashed line shows the time instance when the central temperature of IF1 reaches the threshold value. The red circles indicate time instances at which the mass growth rate of IF1 is calculated: (1) 6.6 × 10⁻³ MJup yr−1, (2) 1.45× 10⁻² MJup yr−1, (3) − 1.8 × 10⁻² MJup yr−1, and (4) − 3.3 × 10⁻² MJup yr−1. |
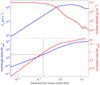 |
Fig. 12 Top panel: azimuthally averaged surface density and angular velocity profiles of IF1 as a function of the radial distance from the center of the fragment. Bottom panel: the centrifugal radius and the enclosed mass of IF1 as a function of the radial distance from the center of the fragment. The horizontal dashed line marks the radius of the second hydrostatic core Rs.core = 5RJup. The vertical dashed line separates the inner and outer parts of IF1 that form a protoplanetary core and disk plus envelope, respectively, during the second collapse caused by H2 dissociation. |
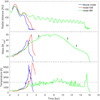 |
Fig. 13 Radial distance (top panel), mass (middle panel), and central temperature (bottom panel) of fragment IF1 vs. time in the fiducial model (blue curves), IOB model (red curves), and SM model (green curves). The green circles indicate time instances at which the mass growth rate of IF1 is calculated: (1) 4.0 × 10⁻³ MJup yr−1, (2) 4.8 × 10⁻³ MJup yr−1, (3) − 3.5 × 10⁻³ MJup yr−1, and (4) − 2.6 × 10⁻³ MJup yr−1. |
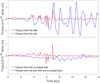 |
Fig. 14 Top panel: torques exerted on IF1 by the entire disk (the red solid line) and by the central star (the blue solid line). Bottom panel: the truncated disk and stellar torques exerted on IF1 and calculated using only the material lying in the inner 145 au of the disk. |
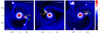 |
Fig. 15 Gas surface density distributions in the SM model at several time instances focusing on IF1. The direction of the gravity force F* acting on IF1 from the star is marked with the red arrow. The direction of the lever arm r* used for the calculation of the torque acting from the star on IF1 is marked with the green arrows. The curved yellow arrows show the angle γ* between r* and F*. The disk rotates counter clockwise. The scale bar is in log g cm−2. |
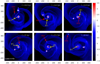 |
Fig. 16 Gas surface density distributions in the SM model at several time instances focusing on the close encounter between IF1 and OF4, resulting in the ejection of the latter fragment. IF1 and OF4 are indicated with the yellow and red arrows, respectively. The disk rotates counter clockwise. |
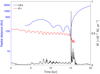 |
Fig. 17 Radial distances of IF1 and OF4 from the star (the red and blue lines, respectively, together with protostellar accretion rate (the black line), as a function of time in model SM. |
6 Conclusions
We used high-resolution grid-based numerical hydrodynamics simulations of disk formation and evolution to study the migration of dense gaseous clumps that form in the disk through gravitational fragmentation. Our numerical simulations cover the entire embedded phase of disk evolution, starting from the collapse of a prestellar core and ending with its complete dissipation due to accretion on the star plus disk system. Thanks to the logarithmically spaced grid in the radial direction we achieved a sub-au resolution in the disk regions where fragmentation and migration take place, which allowed us to study the internal structure of migrating clumps in detail. Our findings can be summarized as follows.
Gaseous clumps that form in the outer disk regions are often perturbed by other clumps or disk structures, such as spiral arms, and migrate toward the central star. When approaching the star, the clumps lose most of their diffuse envelopes through tidal torques. The tidal mass loss helps the clumps to significantly slow down or even halt their inward migration at a distance of a few tens of astronomical units from the protostar.
Tidal truncation of gaseous clumps as they approach the protostar can produce accretion bursts similar in magnitude and duration to the FU-Orionis-type eruptions, if the tidally stripped material is accreted by the protostar. Numerical simulations with a smaller inner sink cell (15 au in the current study) are needed to further investigate this phenomenon.
Tidal truncation and associated halt of inward migration produce hot and dense gaseous nuclei at distances on the order of a few tens of astronomical units. These nuclei may further experience the second collapse down to planetary densities through the dissociation of molecular hydrogen at T > 2000 K. However, only a small fraction of the total clump mass is expected to directly form the protoplanetary core and most of the clump material would form the circumplanetary disk and/or envelope.
The details of inner boundary implementation have a minor effect on the properties and migration of gaseous clumps, whereas stellar motion can significantly increase their inward migration timescale. The slowed-down migration increases the probability of chance encounters with other eccentric-orbit clumps, leading in some cases to the ejection of the least massive (planetary-mass) objects from the disk in the interstellar medium.
We conclude that tidal truncation of gaseous clumps is an important effect that not only slows down (or even halts) their inward migration, but also facilitates the formation of giant protoplanets on orbits of tens of au (as also predicted by tidal downsizing theory; see Nayakshin 2017b) and triggers accretion bursts, which in turn may affect the dust growth, chemistry, and gravitational fragmentation in protostellar disks (e.g., Vorobyov et al. 2013a; Stamatellos 2015; Hubbard 2017; Rab et al. 2017). A premature introduction of sink particles as proxies for gaseous clumps carries a risk of neglecting these important phenomena.
Acknowledgements
We are thankful to the anonymous referee for useful comments and suggestions which helped to improve the manuscript. We are thankful to Nader Haghighipour for stimulating discussions. This work was supported by the Russian Science Foundation grant 17-12-01168. The simulations were performed on the Vienna Scientific Clusterand on the Compute Canada network.
References
- Audard, M., Ábrahám, P., Dunham, M. M., et al. 2014, Protostars and Planets VI (Tucson, AZ: University of Arizona Press), 387 [Google Scholar]
- Baraffe, I., Vorobyov, E., & Chabrier, G. 2012, ApJ, 756, 118 [NASA ADS] [CrossRef] [Google Scholar]
- Baruteau, C., Meru, F., & Paardekooper, S.-J. 2011, MNRAS, 416, 1971 [NASA ADS] [CrossRef] [Google Scholar]
- Basu, S. 1997, ApJ, 485, 240 [CrossRef] [Google Scholar]
- Basu, S., & Vorobyov, E. I. 2012, ApJ, 750, 30 [NASA ADS] [CrossRef] [Google Scholar]
- Boley, A. C. 2009, ApJ, 695, L53 [NASA ADS] [CrossRef] [Google Scholar]
- Boley, A. C., Hayfield, T., Mayer, L., & Durisen, R. H. 2010, Icarus, 207, 509 [NASA ADS] [CrossRef] [Google Scholar]
- Boss, A. P. 1998, ApJ, 503, 923 [NASA ADS] [CrossRef] [Google Scholar]
- Cha, S.-H., & Nayakshin, S. 2011, MNRAS, 415, 3319 [NASA ADS] [CrossRef] [Google Scholar]
- Decampli, W. M., & Cameron, A. G. W. 1979, Icarus, 38, 367 [NASA ADS] [CrossRef] [Google Scholar]
- Dong, R., Vorobyov, E., Pavlyuchenkov, Y., Chiang, E., & Liu, H. B. 2016, ApJ, 823, 141 [NASA ADS] [CrossRef] [Google Scholar]
- Federrath, C., Banerjee, R., Clark, P. C., & Klessen, R. S. 2010, ApJ, 713, 269 [NASA ADS] [CrossRef] [Google Scholar]
- Galvagni, M., Hayfield, T., Boley, A., et al. 2012, MNRAS, 427, 1725 [NASA ADS] [CrossRef] [Google Scholar]
- Galvagni, M., & Mayer, L. 2014, MNRAS, 437, 2909 [NASA ADS] [CrossRef] [Google Scholar]
- Gammie, C. F. 2001, ApJ, 553, 174 [NASA ADS] [CrossRef] [Google Scholar]
- Hosokawa, T., Offner, S. S. R., & Krumholz, M. R. 2011, ApJ, 738, 140 [NASA ADS] [CrossRef] [Google Scholar]
- Hubbard, A. 2017, MNRAS, 465, 1910 [Google Scholar]
- Johnson, B. M., & Gammie, C. F. 2003, ApJ, 597, 131 [NASA ADS] [CrossRef] [Google Scholar]
- Kalas, P., Graham, J. R., Chiang, E., et al. 2008, Science, 322, 1345 [NASA ADS] [CrossRef] [PubMed] [Google Scholar]
- Lafrenière, D., Jayawardhana, R., & van Kerkwijk M. H. 2010, ApJ, 719, 497 [NASA ADS] [CrossRef] [Google Scholar]
- Machida, M. N., Inutsuka, S.-i., & Matsumoto, T. 2011, ApJ, 729, 42 [NASA ADS] [CrossRef] [Google Scholar]
- Marois, C., Macintosh, B., Barman, T., et al. 2008, Science, 322, 1348 [NASA ADS] [CrossRef] [PubMed] [Google Scholar]
- Masunaga, H. & Inutsuka, S.-i. 2000, ApJ, 531, 350 [NASA ADS] [CrossRef] [Google Scholar]
- Mayer, L., Lufkin, G., Quinn, T., & Wadsley, J. 2007, ApJ, 661, L77 [NASA ADS] [CrossRef] [Google Scholar]
- Meru, F. 2015, MNRAS, 454, 2529 [NASA ADS] [CrossRef] [Google Scholar]
- Meyer, D. M.-A., Vorobyov, E. I., Kuiper, R., & Kley, W. 2017, MNRAS, 464, L90 [NASA ADS] [CrossRef] [Google Scholar]
- Nayakshin, S. 2010a, MNRAS, 408, L36 [NASA ADS] [CrossRef] [Google Scholar]
- Nayakshin, S. 2010b, MNRAS, 408, 2381 [NASA ADS] [CrossRef] [Google Scholar]
- Nayakshin, S. 2017a, MNRAS, 470, 2387 [NASA ADS] [CrossRef] [Google Scholar]
- Nayakshin, S. 2017b, PASA, 34, e002 [NASA ADS] [CrossRef] [Google Scholar]
- Nayakshin, S., & Lodato, G. 2012, MNRAS, 426, 70 [NASA ADS] [CrossRef] [Google Scholar]
- Rab, C., Elbakyan, V., Vorobyov, E., et al. 2017, A&A, 604, A15 [NASA ADS] [CrossRef] [EDP Sciences] [Google Scholar]
- Rafikov, R. R. 2005, ApJ, 621, L69 [NASA ADS] [CrossRef] [Google Scholar]
- Regály, Z., & Vorobyov, E. 2017a, A&A, 601, A24 [NASA ADS] [CrossRef] [EDP Sciences] [Google Scholar]
- Regály, Z., & Vorobyov, E. 2017b, MNRAS, 471, 2204 [NASA ADS] [CrossRef] [Google Scholar]
- Rice, W. K. M., Armitage, P. J., Bate, M. R., & Bonnell, I. A. 2003, MNRAS, 339, 1025 [NASA ADS] [CrossRef] [Google Scholar]
- Semenov, D., Henning, T., Helling, C., Ilgner, M., & Sedlmayr, E. 2003, A&A, 410, 611 [NASA ADS] [CrossRef] [EDP Sciences] [Google Scholar]
- Stamatellos, D. 2015, ApJ, 810, L11 [NASA ADS] [CrossRef] [Google Scholar]
- Stamatellos, D., & Inutsuka, S.-i. 2018, MNRAS, 477, 3110 [NASA ADS] [CrossRef] [Google Scholar]
- Stamatellos, D., & Whitworth, A. P. 2009, MNRAS, 392, 413 [Google Scholar]
- Stökl, A., Dorfi, E. A., Johnstone, C. P., & Lammer, H. 2016, ApJ, 825, 86 [NASA ADS] [CrossRef] [Google Scholar]
- Takahashi, S. Z., Tsukamoto, Y., & Inutsuka, S. 2016, MNRAS, 458, 3597 [NASA ADS] [CrossRef] [Google Scholar]
- Toomre, A. 1964, ApJ, 139, 1217 [NASA ADS] [CrossRef] [Google Scholar]
- Vorobyov, E. I. 2013, A&A, 552, A129 [NASA ADS] [CrossRef] [EDP Sciences] [Google Scholar]
- Vorobyov, E. I. 2016, A&A, 590, A115 [NASA ADS] [CrossRef] [EDP Sciences] [Google Scholar]
- Vorobyov, E. I., & Basu, S. 2005, ApJ, 633, L137 [NASA ADS] [CrossRef] [Google Scholar]
- Vorobyov, E. I., & Basu, S. 2010, ApJ, 719, 1896 [NASA ADS] [CrossRef] [Google Scholar]
- Vorobyov, E. I., & Basu, S. 2015, ApJ, 805, 115 [NASA ADS] [CrossRef] [Google Scholar]
- Vorobyov, E. I., Baraffe, I., Harries, T., & Chabrier, G. 2013a, A&A, 557, A35 [NASA ADS] [CrossRef] [EDP Sciences] [Google Scholar]
- Vorobyov, E. I., DeSouza, A. L., & Basu, S. 2013b, ApJ, 768, 131 [NASA ADS] [CrossRef] [Google Scholar]
- Vorobyov, E. I., Elbakyan, V., Hosokawa, T., et al. 2017, A&A, 605, A77 [NASA ADS] [CrossRef] [EDP Sciences] [Google Scholar]
- Whelan, E. T., Riaz, B., & Rouzé, B. 2018, A&A, 610, L19 [NASA ADS] [CrossRef] [EDP Sciences] [Google Scholar]
- Yorke, H. W., & Bodenheimer, P. 2008, in Massive Star Formation: Observations Confront Theory, eds. H. Beuther, H. Linz, & T. Henning, ASP Conf. Ser., 387, 189 [NASA ADS] [Google Scholar]
- Zhao, B., Caselli, P., Li, Z.-Y., & Krasnopolsky, R. 2018, MNRAS, 473, 4868 [NASA ADS] [CrossRef] [Google Scholar]
- Zhu, Z., Hartmann, L., & Gammie, C. 2009, ApJ, 694, 1045 [NASA ADS] [CrossRef] [Google Scholar]
- Zhu, Z., Hartmann, L., Nelson, R. P., & Gammie, C. F. 2012, ApJ, 746, 110 [NASA ADS] [CrossRef] [Google Scholar]
The cooling and heating rates in Dong et al. (2016) are written for one side of the disk and need to be multiplied by a factor of 2.
The animation of clump inward migration can be found at http://www.astro.sfedu.ru/animations/accretion.mp4
The animation of clump ejection can be found at http://www.astro.sfedu.ru/animations/intruder.mp4.
All Figures
|
Fig. 1 Schematic illustration of the inner inflow–outflow boundary condition. The mass of material ΔMflow that passes through the sink cell from the active inner disk is further divided into two parts: the mass ΔM* contributing to the growing central star, and the mass ΔMs.c. settling in the sink cell. |
| In the text | |
|
Fig. 2 Gas surface density maps (g cm-2, log units) in the fiducial model shown at nine times since the formation of the central protostar. Only the inner 600 × 600 au2 box is shown. The total computational region extends to 14 000 au in the r-direction. The contour lines in the top-left panel outline the regions where the Toomre Q-parameter is less than unity and the red arrows point to the identified fragments in the disk. Fragment IF1 is marked by the yellow arrows in the middle row of panels; its dynamics is considered in detail in Sect. 4. |
| In the text | |
|
Fig. 3 Gas surface density distributions in the fiducial model at several time instances focusing on the inward migration of IF1. The time is counted from t0 = 153.5 kyr. The position of IF1 is marked with the yellow arrows, while the positions of OF1, OF2, and OF3 are marked with the red arrows. The yellow contour lines outline disk regions with the Toomre Q-parameter smaller than unity, while the black contour lines show the disk regions satisfying both the Toomre and Gammie criteria for disk fragmentation. The disk rotates counter clockwise. |
| In the text | |
|
Fig. 4 Radial distances of IF1 and OF1 from the protostar (the red and blue lines, respectively) as a function of time. The black line shows the relative distance between IF1 and OF1. The letters indicate the time instances corresponding to panels b–f in Fig. 3. |
| In the text | |
|
Fig. 5 Spatial maps of the absolute torque exerted on IF1 by the rest of the disk. The times are similar to those shown in Fig. 3. The disk rotates counterclockwise. The red arrows point to IF1. Partsof the disk characterized by the positive and negative torque are marked with the “+” and “-” signs, respectively, and the black dashed line separates these parts. The color bar shows the torque values in log dyne cm. The red contour line highlights the disk regions where the torque exceeds 1038 dyne cm. |
| In the text | |
|
Fig. 6 Top panel: torque exerted on IF1 from OF1 (the green line), OF2 (the red line), and OF3 (the blue line) vs. time. Bottom panel: torque exerted on IF1 by OF1, OF2, and OF3 taken together (the black line), by the entire disk (the red line), and by the entire disk, but excluding the torque from the fragments (the blue line) vs. time. We note the difference in scales. |
| In the text | |
|
Fig. 7 Zoomed-in view on IF1 during its inward migration toward the protostar. The black arrows show the gas velocity field superimposed on the gas surface density distribution. The shrinking spatial scales are used to better resolve thefragment. The yellow circles mark the Hill radius of the fragment and the red curves outline the fragment shape as determined by the fragment-tracking method. The color bar shows the gas surface density in log g cm−2. |
| In the text | |
|
Fig. 8 Massaccretion rate through the sink cell (the green line), radial distance of IF1 from the star (the red line), and mass of IF1 (the blue line) as a function of time. |
| In the text | |
|
Fig. 9 Top panel: gravitational torque acting on IF1 from the entire disk including other fragments (the black line) and the radial distance of IF1 (the red line) as a function of time. Bottom panel: gravitational torque (the black line) and the mass of IF1 vs. time (the blue line). |
| In the text | |
|
Fig. 10 Time evolution of |
| In the text | |
|
Fig. 11 Mass of IF1 (top panel), radial distance of IF1 (middle panel), and central temperature of IF1 (bottom panel), all vs. time. The horizontal dashed line shows a threshold temperature of 2000 K, above which molecular hydrogen dissociates and the second collapse is supposed to ensure. The vertical dashed line shows the time instance when the central temperature of IF1 reaches the threshold value. The red circles indicate time instances at which the mass growth rate of IF1 is calculated: (1) 6.6 × 10⁻³ MJup yr−1, (2) 1.45× 10⁻² MJup yr−1, (3) − 1.8 × 10⁻² MJup yr−1, and (4) − 3.3 × 10⁻² MJup yr−1. |
| In the text | |
|
Fig. 12 Top panel: azimuthally averaged surface density and angular velocity profiles of IF1 as a function of the radial distance from the center of the fragment. Bottom panel: the centrifugal radius and the enclosed mass of IF1 as a function of the radial distance from the center of the fragment. The horizontal dashed line marks the radius of the second hydrostatic core Rs.core = 5RJup. The vertical dashed line separates the inner and outer parts of IF1 that form a protoplanetary core and disk plus envelope, respectively, during the second collapse caused by H2 dissociation. |
| In the text | |
|
Fig. 13 Radial distance (top panel), mass (middle panel), and central temperature (bottom panel) of fragment IF1 vs. time in the fiducial model (blue curves), IOB model (red curves), and SM model (green curves). The green circles indicate time instances at which the mass growth rate of IF1 is calculated: (1) 4.0 × 10⁻³ MJup yr−1, (2) 4.8 × 10⁻³ MJup yr−1, (3) − 3.5 × 10⁻³ MJup yr−1, and (4) − 2.6 × 10⁻³ MJup yr−1. |
| In the text | |
|
Fig. 14 Top panel: torques exerted on IF1 by the entire disk (the red solid line) and by the central star (the blue solid line). Bottom panel: the truncated disk and stellar torques exerted on IF1 and calculated using only the material lying in the inner 145 au of the disk. |
| In the text | |
|
Fig. 15 Gas surface density distributions in the SM model at several time instances focusing on IF1. The direction of the gravity force F* acting on IF1 from the star is marked with the red arrow. The direction of the lever arm r* used for the calculation of the torque acting from the star on IF1 is marked with the green arrows. The curved yellow arrows show the angle γ* between r* and F*. The disk rotates counter clockwise. The scale bar is in log g cm−2. |
| In the text | |
|
Fig. 16 Gas surface density distributions in the SM model at several time instances focusing on the close encounter between IF1 and OF4, resulting in the ejection of the latter fragment. IF1 and OF4 are indicated with the yellow and red arrows, respectively. The disk rotates counter clockwise. |
| In the text | |
|
Fig. 17 Radial distances of IF1 and OF4 from the star (the red and blue lines, respectively, together with protostellar accretion rate (the black line), as a function of time in model SM. |
| In the text | |
Current usage metrics show cumulative count of Article Views (full-text article views including HTML views, PDF and ePub downloads, according to the available data) and Abstracts Views on Vision4Press platform.
Data correspond to usage on the plateform after 2015. The current usage metrics is available 48-96 hours after online publication and is updated daily on week days.
Initial download of the metrics may take a while.