Fig. 7
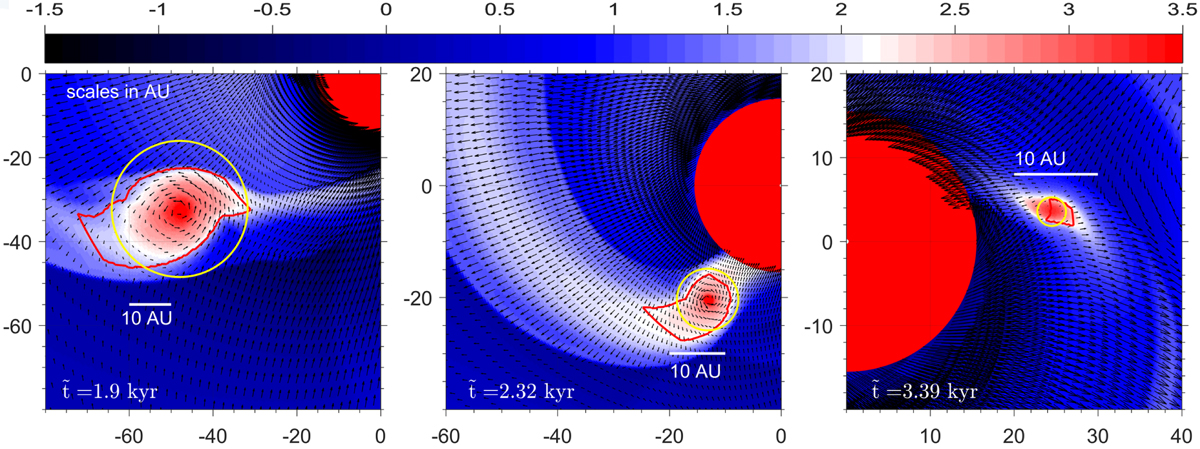
Zoomed-in view on IF1 during its inward migration toward the protostar. The black arrows show the gas velocity field superimposed on the gas surface density distribution. The shrinking spatial scales are used to better resolve thefragment. The yellow circles mark the Hill radius of the fragment and the red curves outline the fragment shape as determined by the fragment-tracking method. The color bar shows the gas surface density in log g cm−2.
Current usage metrics show cumulative count of Article Views (full-text article views including HTML views, PDF and ePub downloads, according to the available data) and Abstracts Views on Vision4Press platform.
Data correspond to usage on the plateform after 2015. The current usage metrics is available 48-96 hours after online publication and is updated daily on week days.
Initial download of the metrics may take a while.