Free Access
Fig. 4
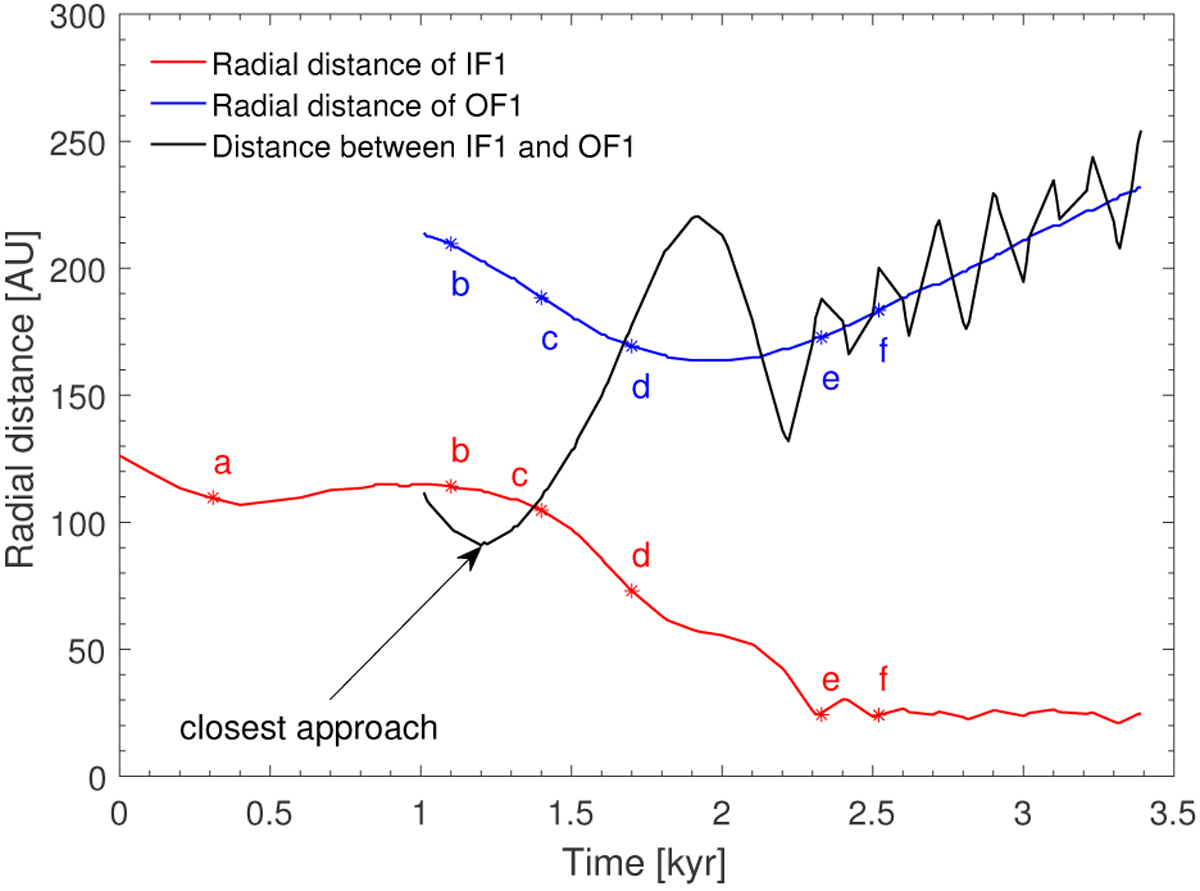
Radial distances of IF1 and OF1 from the protostar (the red and blue lines, respectively) as a function of time. The black line shows the relative distance between IF1 and OF1. The letters indicate the time instances corresponding to panels b–f in Fig. 3.
Current usage metrics show cumulative count of Article Views (full-text article views including HTML views, PDF and ePub downloads, according to the available data) and Abstracts Views on Vision4Press platform.
Data correspond to usage on the plateform after 2015. The current usage metrics is available 48-96 hours after online publication and is updated daily on week days.
Initial download of the metrics may take a while.