Fig. 13
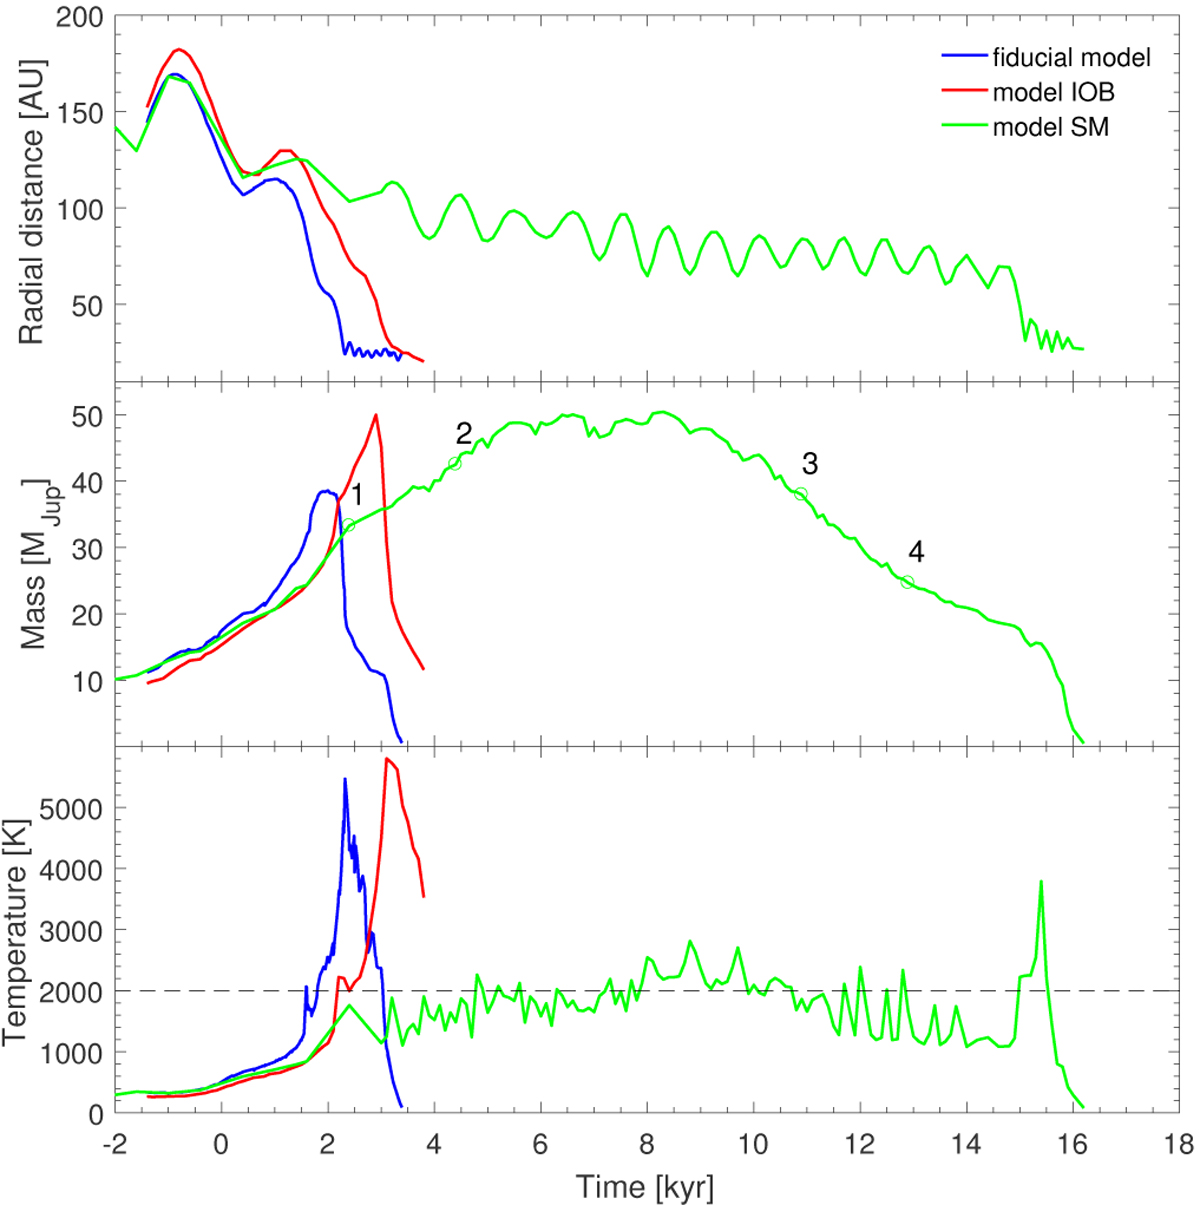
Radial distance (top panel), mass (middle panel), and central temperature (bottom panel) of fragment IF1 vs. time in the fiducial model (blue curves), IOB model (red curves), and SM model (green curves). The green circles indicate time instances at which the mass growth rate of IF1 is calculated: (1) 4.0 × 10⁻³ MJup yr−1, (2) 4.8 × 10⁻³ MJup yr−1, (3) − 3.5 × 10⁻³ MJup yr−1, and (4) − 2.6 × 10⁻³ MJup yr−1.
Current usage metrics show cumulative count of Article Views (full-text article views including HTML views, PDF and ePub downloads, according to the available data) and Abstracts Views on Vision4Press platform.
Data correspond to usage on the plateform after 2015. The current usage metrics is available 48-96 hours after online publication and is updated daily on week days.
Initial download of the metrics may take a while.