Fig. 2
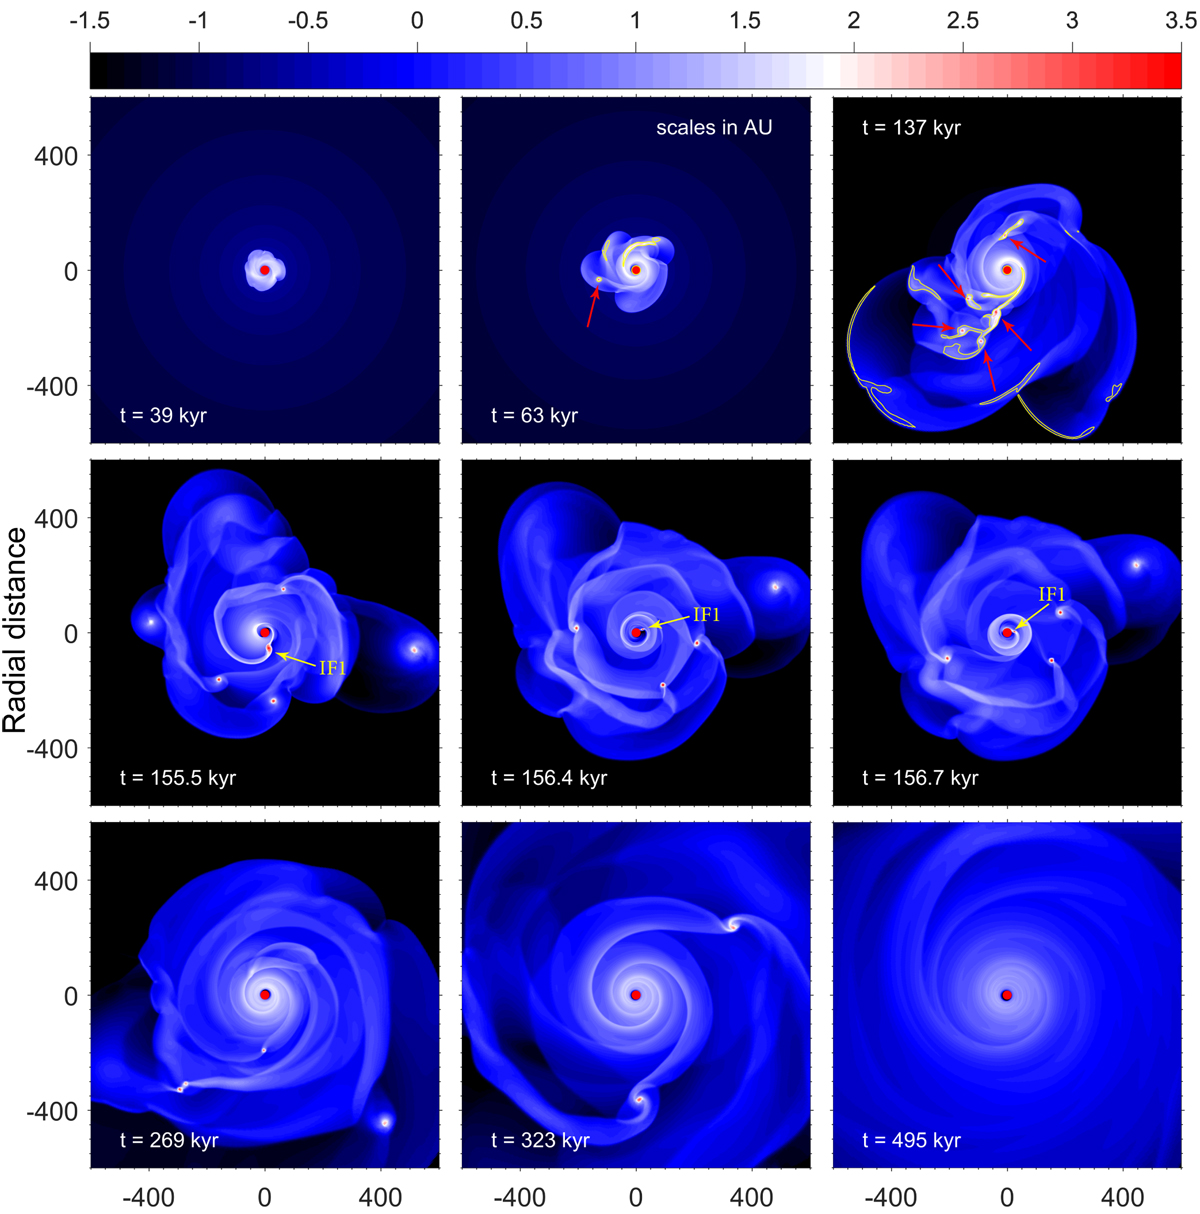
Gas surface density maps (g cm-2, log units) in the fiducial model shown at nine times since the formation of the central protostar. Only the inner 600 × 600 au2 box is shown. The total computational region extends to 14 000 au in the r-direction. The contour lines in the top-left panel outline the regions where the Toomre Q-parameter is less than unity and the red arrows point to the identified fragments in the disk. Fragment IF1 is marked by the yellow arrows in the middle row of panels; its dynamics is considered in detail in Sect. 4.
Current usage metrics show cumulative count of Article Views (full-text article views including HTML views, PDF and ePub downloads, according to the available data) and Abstracts Views on Vision4Press platform.
Data correspond to usage on the plateform after 2015. The current usage metrics is available 48-96 hours after online publication and is updated daily on week days.
Initial download of the metrics may take a while.