Free Access
Fig. 16
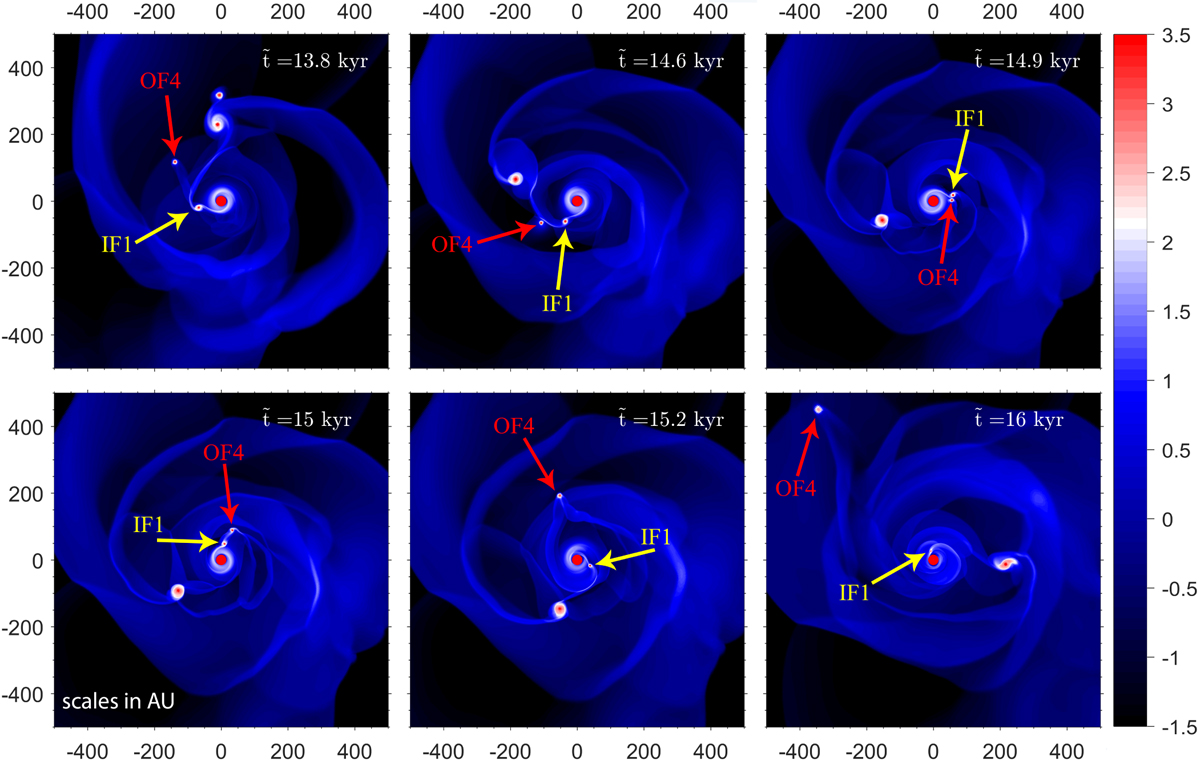
Gas surface density distributions in the SM model at several time instances focusing on the close encounter between IF1 and OF4, resulting in the ejection of the latter fragment. IF1 and OF4 are indicated with the yellow and red arrows, respectively. The disk rotates counter clockwise.
Current usage metrics show cumulative count of Article Views (full-text article views including HTML views, PDF and ePub downloads, according to the available data) and Abstracts Views on Vision4Press platform.
Data correspond to usage on the plateform after 2015. The current usage metrics is available 48-96 hours after online publication and is updated daily on week days.
Initial download of the metrics may take a while.