Fig. 3
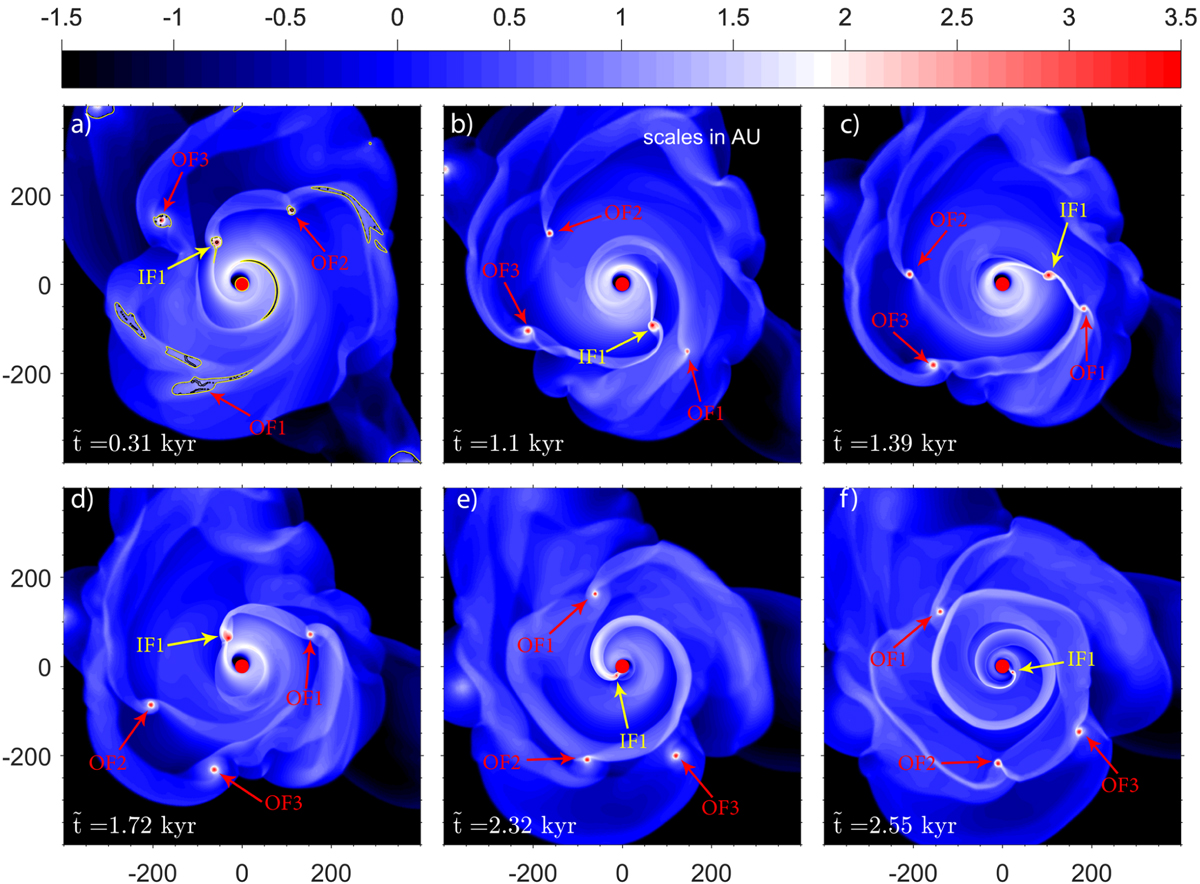
Gas surface density distributions in the fiducial model at several time instances focusing on the inward migration of IF1. The time is counted from t0 = 153.5 kyr. The position of IF1 is marked with the yellow arrows, while the positions of OF1, OF2, and OF3 are marked with the red arrows. The yellow contour lines outline disk regions with the Toomre Q-parameter smaller than unity, while the black contour lines show the disk regions satisfying both the Toomre and Gammie criteria for disk fragmentation. The disk rotates counter clockwise.
Current usage metrics show cumulative count of Article Views (full-text article views including HTML views, PDF and ePub downloads, according to the available data) and Abstracts Views on Vision4Press platform.
Data correspond to usage on the plateform after 2015. The current usage metrics is available 48-96 hours after online publication and is updated daily on week days.
Initial download of the metrics may take a while.