Fig. 6
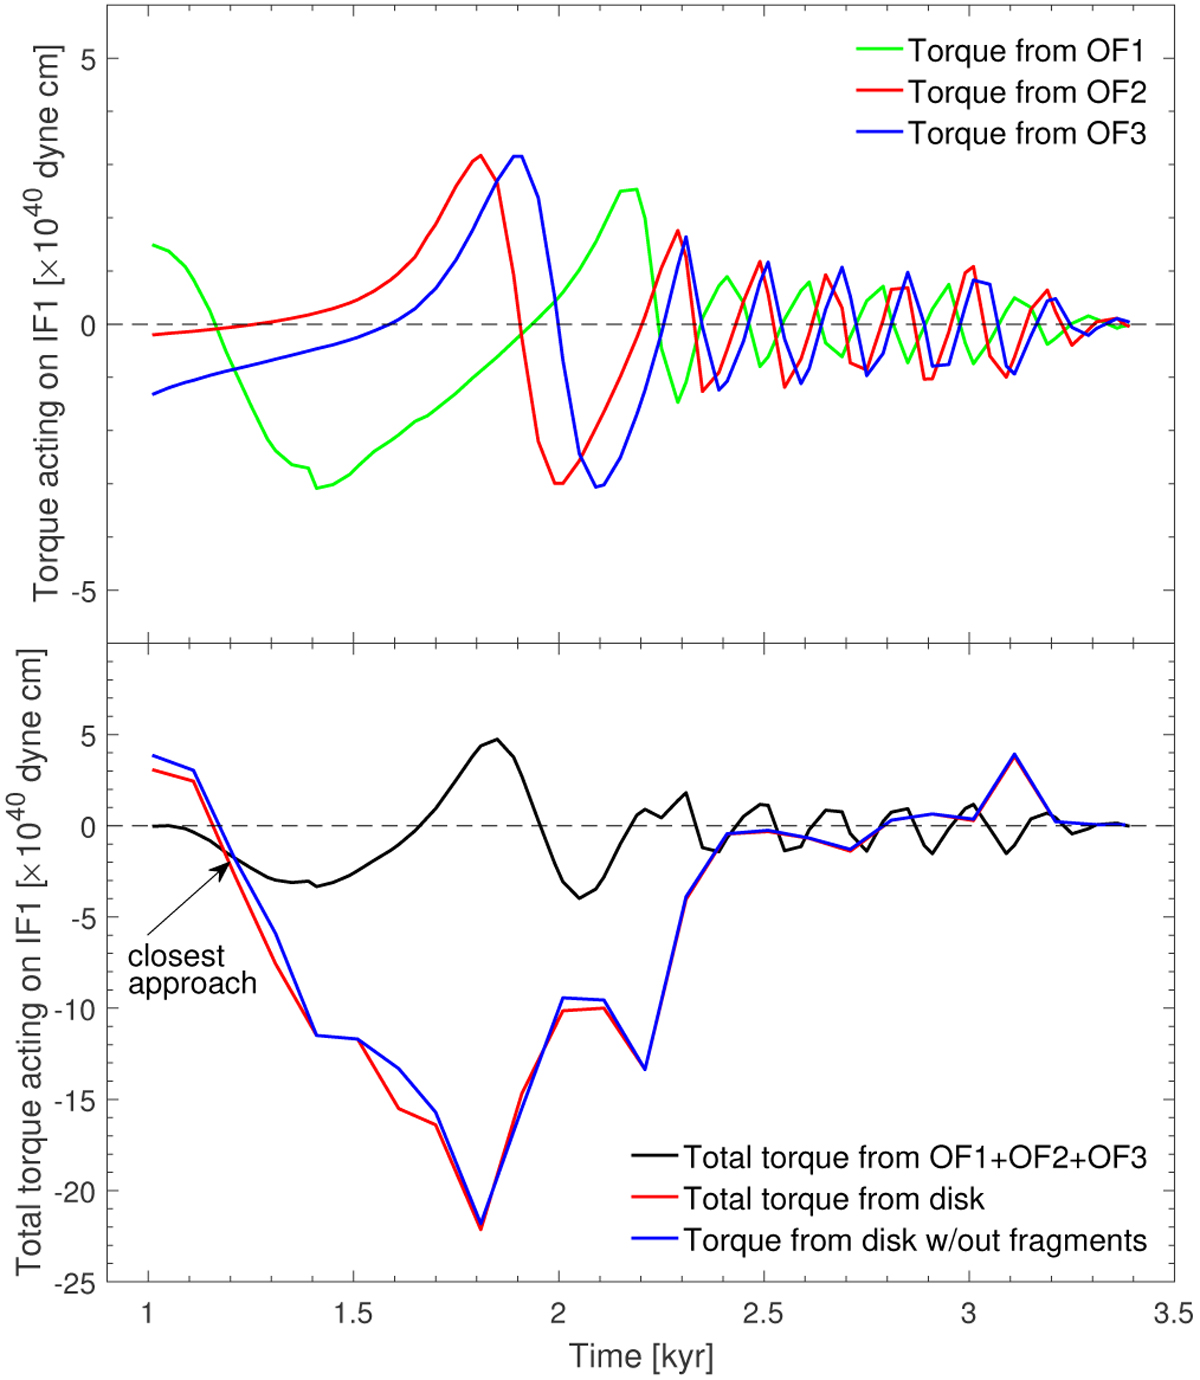
Top panel: torque exerted on IF1 from OF1 (the green line), OF2 (the red line), and OF3 (the blue line) vs. time. Bottom panel: torque exerted on IF1 by OF1, OF2, and OF3 taken together (the black line), by the entire disk (the red line), and by the entire disk, but excluding the torque from the fragments (the blue line) vs. time. We note the difference in scales.
Current usage metrics show cumulative count of Article Views (full-text article views including HTML views, PDF and ePub downloads, according to the available data) and Abstracts Views on Vision4Press platform.
Data correspond to usage on the plateform after 2015. The current usage metrics is available 48-96 hours after online publication and is updated daily on week days.
Initial download of the metrics may take a while.