| Issue |
A&A
Volume 598, February 2017
|
|
|---|---|---|
| Article Number | A10 | |
| Number of page(s) | 132 | |
| Section | Extragalactic astronomy | |
| DOI | https://doi.org/10.1051/0004-6361/201628936 | |
| Published online | 26 January 2017 | |
Barlenses and X-shaped features compared: two manifestations of boxy/peanut bulges
Astronomy Research Unit, University of Oulu, 90014 Oulu, Finland
e-mail: eija.laurikainen@oulu.fi
Received: 14 May 2016
Accepted: 31 August 2016
Aims. We study the morphological characteristics of boxy/peanut-shaped bulges. In particular, we are interested to determine whether most of the flux associated with bulges in galaxies with masses similar to those of the Milky Way at redshift z ~ 0 might belong to the vertically thick inner part of the bar, in a similar manner as in the Milky Way itself. At high galaxy inclinations, these structures are observed as boxy/peanut/X-shaped features, and when the view is near to face-on, they are observed as barlenses. We also study the possibility that bulges in some fraction of unbarred galaxies might form in a similar manner as the bulges in barred galaxies.
Methods. We used the Spitzer Survey of Stellar Structure in Galaxies (S4G) and the Near-IR S0 galaxy Survey (NIRS0S) to compile complete samples of galaxies with barlenses (N = 85) and X-shaped features (N = 88). A sample of unbarred galaxies (N = 41) is also selected. For all 214 galaxies unsharp mask images were created, used to recognize the X-shaped features and to measure their linear sizes. To detect possible boxy isophotes (using the B4-parameter), we also performed an isophotal analysis for the barlens galaxies. We use recently published N-body simulations: the models that exhibit boxy/peanut/X/barlens morphologies are viewed from isotropically chosen directions that cover the full range of galaxy inclinations in the sky. The synthetic images were analyzed in a similar manner as the observations.
Results. This is the first time that the observed properties of barlenses and X-shaped features are directly compared across a wide range of galaxy inclinations. A comparison with the simulation models shows that the differences in their apparent sizes, a/rbar ≳ 0.5 for barlenses and a/rbar ≲ 0.5 for X-shapes, can be explained by projection effects. Observations at various inclinations are consistent with intrinsic abl ≈ aX ≈ 0.5rbar: here intrinsic size means the face-on semimajor axis length for bars and barlenses, and the semilength of the X-shape when the bar is viewed exactly edge-on. While X-shapes are quite common at intermediate galaxy inclinations (for i = 40°−60° their frequency is about half that of barlenses), they are seldom observed at smaller inclinations. This is consistent with our simulation models, which have a small compact classical bulge that produces a steep inner rotation slope, whereas bulgeless shallow rotation curve models predict that X-shapes should be visible even in a face-on geometry. The steep rotation curve models are also consistent with the observed trend that B4 is positive at low inclination and with negative values for i ≳ 40°−60°; this implies boxy isophotes. In total, only about one quarter of the barlenses (with i ≤ 60°) show boxy isophotes.
Conclusions. Our analyses are consistent with the idea that barlenses and X-shaped features are physically the same phenomenon. However, the observed nearly round face-on barlens morphology is expected only when at least a few percent of the disk mass is located in a central component, within a region much smaller than the size of the barlens itself. Barlenses contribute to secular evolution of galaxies, and might even act as a transition phase between barred and unbarred galaxies. We also discuss that the wide range of stellar population ages obtained for the photometric bulges in the literature are consistent with our interpretation.
Key words: Galaxy: bulge / galaxies: bulges / galaxies: evolution / galaxies: structure
© ESO, 2017
1. Introduction
The amount of baryonic mass confined in the bulges of galaxies and the way in which this mass has been accumulated are critical questions to answer when we construct models of galaxy formation and evolution. The answers to these questions depend on how well the different bulge components can be recognized and assigned to possible physical processes that shape those structures. Most of the bulge mass associated with photometric bulges (i.e., the flux above the disk) is generally assumed to reside in classical bulges. These galaxies are relaxed structures that are supported by velocity dispersion, presumably formed by galaxy mergers (White & Rees 1978; Hopkins et al. 2009), or by coalescence of massive star-forming clumps at high redshifts, which have drifted toward the central regions of the galaxies (Bournaud et al. 2008; Elmegreen et al. 2009; see also the review by Kormendy 2016). This picture where prominent classical bulges form has been challenged by the discovery that most of the bulge mass in the Milky Way resides in a boxy/peanut (B/P) bar and also shows evidence of an X-shaped morphology, without any clear evidence of a classical bulge (McWilliam & Zoccali 2010; Nataf et al. 2010; Wegg & Gerhard 2013; Ness & Lang 2016). Whether bar-related inner structures like this might also form most of the bulge mass in external Milky Way-mass galaxies is the topic of this study.
Boxy/peanut (B/P) bulges are easy to distinguish in the edge-on view, and it has been shown that even two-thirds of all disk galaxies of S0-Sd types have B/Ps (Lütticke et al. 2000; Bureau et al. 2006; but see also Yoshino & Yamauchi 2014). Many B/P bulges also show cylindrical rotation (Kormendy & Illingworth 1982; Bureau & Freeman 1999; Falcón-Barroso et al. 2006; Molaeinezhad et al. 2016; Iannuzzi & Athanassoula 2015), which generally confirms their bar origin. It is difficult to verify whether a galaxy is barred in the edge-on view, but it has been shown that at an optimal range of viewing angles, B/Ps are visible even in less inclined galaxies, as revealed by their boxy isophotes (Beaton et al. 2007; Erwin & Debattista 2013, hereafter ED2013). A new morphological feature, a barlens (bl), was recognized by Laurikainen et al. (2011), and it has been suggested (Laurikainen et al. 2014, hereafter L+2014; Athanassoula et al. 2015, hereafter A+2015; see also Laurikainen et al. 2007) that they might be the face-on counterparts of B/P bulges. A barlens has recently been associated with the Milky Way bulge by Bland-Hawthorn & Gerhard (2016).
Because of their fairly round appearance, barlenses are often erroneously associated with classical bulges (see the review by Laurikainen & Salo 2016), but there is cumulative evidence showing that barlenses might indeed form part of the bar. Their optical colors are very similar to the colors of bars (Herrera-Endoqui et al. 2016, hereafter HE+2016), and in particular, their surface brightness profiles are similar to those predicted for the B/P-bulges in hydrodynamical simulation models when viewed face-on (A+2015 ; see also review by Athanassoula 2016). The first indirect observational evidence connecting barlenses with B/P bulges (which often have X-shaped features in unsharp mask images) was based on the axial ratio distribution of the combined sample of their parent galaxies, which appeared to be flat (L+2014). However, it remained unclear why barlenses concentrate in earlier Hubble types than the B/P/X-shaped bulges (peak values are T = −1 and T = + 1, respectively). Is this simply an observational bias when classifying galaxies at low and high inclinations, or might it indicate some intrinsic difference between the parent galaxies hosting barlenses and X-shape features? The latter possibility is suggested by the recent N-body simulations by Salo & Laurikainen (2016), who demonstrated that a steep inner rotation curve leads to a realistic-looking round barlens morphology, with no trace of an X-shape in the face-on geometry. However, reducing the central mass concentration, and thus shifting the galaxy to a later Hubble type, produced more elongated barlenses, which exhibited X-features at a much wider range of galaxy inclinations.
Barred and unbarred galaxies presumably appear in similar galaxy environments (see Aguerri et al. 2009), therefore it is not plausible that bulges in barred galaxies form smoothly by secular evolution and bulges in unbarred galaxies by some violent processes, such as major galaxy mergers. Therefore, our hypothesis that many classical bulges are misclassified B/P/X features can be valid only when an explanation is also found for the bulges of unbarred galaxies, in the same line with the explanation for the barred galaxies. There is observational evidence which hints to that direction: the inner lenses (normalized to galaxy size) in unbarred galaxies are shown to have similar sizes as barlenses in barred galaxies (Laurikainen et al. 2013; Herrera-Endoqui et al. 2015, hereafter HE+2015). Inner lenses in unbarred galaxies might therefore represent evolved bars where the thin bar component has been completely dissolved or where the classical elongated bar never formed. However, whether those lenses are also vertically thick needs to be shown.
In this study the properties of 85 barlenses and their parent galaxies are studied and compared with the properties of 88 galaxies hosting bars with an X-shaped inner feature. An additional sample of 41 unbarred galaxies is also selected. As a database we used the Spitzer Survey of Stellar Structure in Galaxies (Sheth et al. 2010) and the Near-IR S0 galaxy Survey (Laurikainen et al. 2011). The properties of the analyzed features are compared with those obtained for synthetic images, created from two simulation models taken from Salo & Laurikainen (2016). To obtain a fair comparison, the analysis for the synthetic images is done in a similar manner as for the observations.
2. Data and the sample selection
The Spitzer Survey of Stellar Structure in Galaxies (S4G, Sheth et al. 2010) is a sample of 2352 nearby galaxies observed at mid-IR wavelengths, covering all Hubble types and disk inclinations. The galaxies have HI radial velocities Vradio < 3000 km s-1 corresponding to the distance of D < 40 Mpc for H0 = 75 km s-1, and blue photographic magnitudes BT ≤ 15.5 mag. The Near-IR S0 galaxy Survey (NIRS0S, Laurikainen et al. 2011) is a survey of 185 S0-Sa galaxies with magnitudes BT ≤ 12.5 and galaxy inclinations of i ≤ 65° (N = 215 when the galaxies that slightly exceed the magnitude limit are also included). The morphological classifications of the S4G galaxies are taken from Buta et al. (2015) and those of NIRS0S from Laurikainen et al. (2011), who used the same classification criteria as Buta and collaborators. The wavelengths used in the above classifications are 3.6 μm in S4G, and 2.2 μm in NIRS0S: both are fairly dust free regimes, allowing us to recognize the morphological features of the old stellar population.
The quality of the images was explained by Laurikainen et al. (2011) for NIRS0S and by Salo et al. (2015), Querejeta et al. (2015), and Muñoz-Mateos et al. (2015) for the S4G images. The NIRS0S images typically have a pixel resolution of 0.25 arcsec, a FWHM of ~1 arcsec, and a field of view (FOV) of 4−5 arcmin. The images typically reach a surface brightnesses of 23 mag arcsec-2 in Ks, which is equivalent to 27 mag arcsec-2 in the B band. The S4G images have a pixel resolution of 0.75 arcsec and a FWHM of 2.1 arcsec, and they reach a surface brightness of 27 AB (1σ) mag arcsec-2 at 3.6 μm (equivalent to roughly 28 mag arcsec-2 in the B band). For large galaxies the S4G images are mosaics; they cover at least 1.5 × D25, where D25 is the isophotal size of the galaxy in B band.
From the combined S4G + NIRS0S sample all barred galaxies with a barlens (bl) in the classification were selected; there were 84 barlens galaxies. We also added to this category NGC 1433, which clearly has a barlens, although it is missing in the original classification. To spot the X-shaped features, we first applied unsharp masks to all the S4G and NIRS0S galaxies: weak X-features can be recognized from unsharp mask images even when they were not visible in the direct images. We obtained 88 galaxies with identified X-shape features. In 6 of the galaxies both a barlens and an X-shape feature were identified. We also selected a sample of 41 largely unbarred galaxies that have exponential surface brightness profiles similar to those of barlenses. These galaxies can have inner lenses or ring-lenses (34 galaxies), but not all of them have these. A few of them have been classified as weakly barred (AB) by Buta et al. (2015). The final samples are:
-
(1)
galaxies with barlenses(N = 85);
-
(2)
galaxies with X-shaped features (N = 88);
-
(3)
unbarred galaxies (N = 41).
Compared to the total number of galaxies in our starting S4G+NIRS0S sample, the numbers for the barlens and X-shaped galaxies are fairly small. The reason is that S4G, which is a magnitude limited sample, is dominated by low-luminosity late-type galaxies, whereas the B/P/bl features typically appear in bright galaxies with strong bars: about two-thirds of the bright galaxies have bars, and only a half of the bars are strong. It was shown by L+2014 that when we concentrate on galaxies with −3 ≤ T ≤ −2, i < 65°, and BT < 12.5 mag, ~46% of the barred galaxies in our sample have either a barlens or an X-shape feature.
The inclination distribution of the galaxies in our combined sample has previously been studied by L+2014. Although barlenses are preferentially concentrated in galaxies with low inclinations and the X-shapes in galaxies with high inclinations, the parent galaxy inclinations largely overlap. This makes our sample ideal for comparing the properties of these structures. The three selected samples are shown in Tables F.1–F.3, respectively. In the tables we also list the morphological classifications from Buta et al. (2015). When a galaxy does not appear in S4G, the classification is adopted from Laurikainen et al. (2011). For the following galaxies differences appear in the above classifications: for NGC 584 SA(l)0−(NIRS0S)/E(d)(S4G), for NGC 5631 SA(l)0−(NIRS0S)/E0-1(S4G), and for NGC 5646 SA(l)0−(NIRS0S)/E0-1(S4G). For these galaxies both classifications are listed.
The sizes of bars and barlenses are taken from HE+2015 and HE+2016, respectively. The orientation parameters and the scale lengths of the disks are adopted from Salo et al. (2015). For bars we used visual length estimates because they are measured in a homogeneous manner for all galaxies in our sample. HE+2015 and Díaz-García et al. (2016a) have shown that the visual bar length estimates are fairly similar to those obtained from the maximum ellipticity in the bar region.
The manuscript is organized so that the figures discussed, but not shown in the main body of the text, appear in Appendix A. All the other figures related to our sample are presented in Appendices B–E. The tables for the three main galaxy groups explained in Sect. 2 appear in Appendix F.
3. Methods
3.1. Unsharp masks
We obtained unsharp mask images for the complete sample of 214 galaxies. For the galaxies with X-shaped bars we used the same sample as used by L+2014. The images were first convolved with a Gaussian kernel (mean σ ~ 4 arcsec), and the original images were then divided by the convolved images. To show possible low surface brightness structures, special attention was paid to determine best-fit parameters to illustrate the morphologies. Widths of the Gaussian kernels that best illustrated the faint features were found empirically by inspecting a wide range of values for each galaxy. Our Gaussian convolution method avoids possible artifacts that might appear in the simple approach where the images are divided by rebinned images. The original and unsharp mask images are shown together with the surface brightness profiles for the sample of 214 galaxies in Appendix B. The electronic file is organized in the following manner, with an increasing NGC (IC, or ESO) number in each group:
-
1.
strongly barred with a barlens (blB, Fig. B.1);
-
2.
weakly barred:
-
a)
barlens in the classification (blAB, Fig. B.2),
-
b)
no barlens in the classification, but has a barlens-like, surface brightness profile (AB, Fig. B.2);
-
a)
-
2.
unbarred:
-
a)
with an inner lens (Al, Fig. B.3),
-
b)
no inner lens appears, but similar surface brightness, profile as in a barlens (Aexpo, Fig. B.3);
-
a)
-
4.
with bl in classification and X in the unsharp mask (bl-X, Fig. B.4);
-
5.
X-shaped bar (X).
The first three primary groups are selected based on the bar family (B, AB, A), whereas the last two groups appear to be mixtures of strongly and weakly barred galaxies that have similar numbers of both families. NGC 3384 is shown using both Ks and 3.6 μm images, in which bands the galaxy shows a very different morphology in the central regions: in Ks a central peak appears, whereas at 3.6 μm the galaxy has a bright dispersed central region and a drop of flux in the very center.
3.2. Size measurements of the X-shape features
Using the obtained unsharp mask images (in the sky plane), we measured and collected the sizes of the X-shape features, which we present in Table F.2, where the orientation with respect to the thin bar is also given. An example illustration is shown in Fig. 1: the four corners of the X are marked in the image, and the semilengths of the feature along the bar (a) and perpendicular to it (b) are obtained as mean values of the extents of the two sides. To facilitate the measurements, the images were first rotated so that the bar appeared horizontally. The X-shape features are generally clear (see NGC 2654), but particularly in the end-on view the outer tips of the X are very weak. The measurements were repeated three times, and the mean values together with their errors are indicated (standard deviation of measurements divided by  ; typically less than 0.5 arcsec). The barlens sizes are taken from the previous measurements (HE+2016; their Table 2), where they were obtained by fitting ellipses to the points delineating the outer isophotes of the barlenses: this gives the semilengths along the major (a) and minor axis (b) of the barlens, and the orientation of the major axis. The uncertainties were estimated in a similar manner as our uncertainties for the X-shaped dimensions.
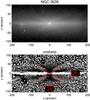 |
Fig. 1 NGC 3628 (upper panel) is used as an example to demonstrate how the sizes of the X-shapes are measured. The unsharp mask image (lower panel) is used, which is rotated so that the bar major axis appears horizontally. The extent of the feature is measured both along the bar direction and perpendicular to it, and the semilenghts are denoted by a and b, respectively. |
3.3. Synthetic images shown at different viewing angles
To create the synthetic images, we used the N-body simulation models from Salo & Laurikainen (2016). These simulations, performed with Gadget-2 (Springel & Hernquist 2005), addressed the influence of central mass concentration on the formation of barlens features. In comparison to the N-body + SPH simulation models by Athanassoula et al. (2013, 2015), the models are much simpler because they only consist of the stellar components: a small pre-existing classical bulge, an exponential disk, and a spherical halo. No gas or star formation were included. At two scale-lengths (hr), the disk accounts for 65% of the total radial force, the initial vertical thickness of the disk is 0.2hr, and the Toomre parameter Q is ~1.3. We selected snapshots from two simulations, both about 3 Gyr after the bar has been formed and stabilized in strength. The two models differ in their bulge-to-disk (B/D) mass ratios at the beginning of the simulation, so that the model with B/D = 0.01 is practically bulgeless, whereas the other model has a small bulge with B/D = 0.08. The effective radius of the bulge was fixed to reff/hr = 0.07, which is the typical observed value for T = 3 galaxies (Salo et al. 2015). Both models develop a B/P/X bulge, and in particular in the model with the higher B/D, the resemblance to the typical face-on barlens morphology is very good. The only difference here to the simulations displayed in Salo & Laurikainen (2016) is that we have increased the number of particles by a factor of 5 to improve the quality of the synthetic images: the behavior of the models is practically unaffected by the increased particle number.
To assemble a representative sample of galaxy orientations in the sky plane, the two simulation snapshots were viewed from 100 isotropically chosen directions. In practice this was done by viewing the galaxy first from its pole (i = 0°) and then spiraling around the galaxy with suitably selected constant steps in azimuthal angle φ and cos i (we used Δφ = 41.4°, and | Δcosi | = 0.02). The angle φ is counted from the direction of the bar major axis. These images for the model with B/D = 0.08 are shown in Fig. 2. Barlenses and X-shape features in the synthetic images were measured in a similar manner as in the observations.
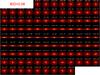 |
Fig. 2 Synthetic images used in comparison with observations from the simulation with B/D = 0.08. The same simulation snapshot is viewed from 100 isotropically chosen directions. The labels in the frames indicate the viewing azimuth φ with respect to the bar major axis and the viewing inclination i. The line-of-nodes are horizontal. The simulation model is explained in Sect. 3.3. |
In Figs. 3, A.1, and A.2 we show how the morphology of the vertically thick inner bar component varies with the viewing angle. In all these figures the left panels show the images, in the middle panels the isophotal contours are overlaid, and the right panels show the unsharp masks of the same images. The line-of-node is always horizontal. The simulation had 5 × 10⁶ disk particles, and to increase the S/N of the synthetic images, three simulation snapshots were superposed after rotating the bar to the same orientation. Moreover, we made use of the reflection symmetry with respect to the equatorial plane, and the m = 2 rotational symmetry with respect to 180° rotation in the equatorial plane. The effective number of disk particles in the synthetic image thus corresponds to 60 × 106. In Fig. 3 the simulation models for B/D = 0.01 and 0.08 are shown at five different inclinations, keeping the azimuthal viewing angle fixed to φ = 90°. In Fig. A.1 the inclination is fixed to i = 90°: in the different panels the azimuthal angle varies from the end-on (φ = 0°) to side-on view (φ = 90°). Also in Fig. A.2 the azimuthal angle varies, but the inclination is fixed to i = 60°.
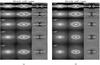 |
Fig. 3 Snapshots of the simulation with a) B/D = 0.01 and b) with B/D = 0.08 are viewed at azimuthal angle φ = 90°, from five galaxy inclinations (i = 90° corresponds the side-on view of the bar). The line-of-node is horizontal. The left panels show the synthetic images, in the middle panel the isophotal contours, separated by 0.5 mags, are overlaid on the images, while the right panels show the unsharp mask images. |
The sizes of the X-shape and barlens features measured from the simulated images are compared with the observations in Sect. 5. Here we emphasize some morphological differences that depend on the viewing angle. Figure 3 shows that in the simulation model with B/D = 0.01 the X-shape is at some level visible at all galaxy inclinations in the unsharp mask images, showing also peanut-shaped isophotes in the direct images. In the model with B/D = 0.01 the size of the X-feature also decreases toward lower galaxy inclinations. However, when B/D = 0.08, the X-shape disappears when the inclination becomes smaller than i = 30°−45° (the isophotes are not boxy anymore either).
When fixing the inclination to i = 90° and allowing the azimuthal angle to vary (Fig. A.1) some morphological differences also appear: as expected, the size of the X-feature shrinks toward the end-on view (φ = 0°). The X-feature is always present in the B/D = 0.01 model, whereas in the model with B/D = 0.08 it disappears in the end-on view. Another comparison with varying azimuthal angle, but this time fixing the inclination to i = 60°, is also interesting: in the bulgeless model the X-shape gradually decreases in size, and finally disappears near the end-on view (Fig. A.2). On the other hand, in the B/D = 0.08 model the X-shape feature rapidly disappears with a decreasing azimuthal angle, and it starts to resemble a barlens: depending on the azimuthal angle, it looks like a spheroidal (φ = 0°), or the “thin bar” appears as two twisted spiral-like features outside the barlens (φ = 30°−40°). Ansae can also be identified in some of those bars at φ = 30°−40°.
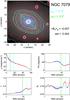 |
Fig. 4 Isophotal analysis performed for the barlens galaxy NGC 7079. In the upper panel the 3.6 μm image is shown in the sky plane with north up and east left: overlaid are the isophotal contours. The blue line indicates the bar length and orientation, and the green ellipse denotes the ellipse fit to the barlens. The four lower panels show the radial profiles from IRAF ellipse: the surface brightness μ (in mag arcsec-2; upper left panel), the position angle (PA; upper right panel), the ellipticity (ϵ; lower left panel), and the B4 parameter (lower right panel) as a function of semimajor axis. B4 is used as proxy for the boxiness: in the small panels, blue and red indicate the regions where B4< −0.005 and B4> 0.005, respectively. The green vertical full line shows the radius of the barlens, and the dashed blue line the bar radius (same colours are used on the contour plot). The labels in the upper right indicate the bar radius (rbar), the semimajor axis length of the barlens (abl), the mean and standard deviation of B4 in the region where the isophotal radius is (0.3–1.0) abl. A similar analysis has been carried out for all 84 barlens galaxies in our sample. |
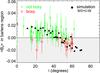 |
Fig. 5 Mean value of B4 parameter in the region of the barlens (isophotal radius in range (0.3–1.0) abl) is displayed as a function of galaxy inclination. The red and green symbols indicate galaxies that have been judged boxy and non-boxy based on visual inspection of the isophotes and the B4 profiles. The filled circles show the same parameter measured from the synthetic images for the simulation model with B/D = 0.08. The error bars in the observation points correspond to ± one standard deviation of B4 in the measurement region. |
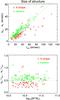 |
Fig. 6 Upper panel: the sizes (a) of barlenses and X-shape features are shown as a function of bar radius (rbar), given in arcseconds. All measurements are in the sky plane. For X-shapes the measurements are from the current study and for barlenses from Laurikainen et al. (2011) and HE+2016. Lower panel: the sizes of barlenses and X-shape features are normalized to the barlength and are drawn as a function of the parent stellar galaxy mass (M ∗), taken from the S4G Pipeline 3 (Muñoz-Mateos et al., 2015). The measured uncertainties are typically smaller than 0.5 arcsec. |
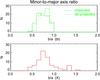 |
Fig. 7 Distributions of the minor-to-major axis ratios (b/a) of barlenses (upper panel), both as measured in the sky plane and after deprojection onto the disk plane. The lower panel shows the b/a ratio for the X-shapes (in the sky plane). |
3.4. Isophotal analysis of barlenses
We made an isophotal analysis for the sample galaxies using the IRAF ellipse routine. It provides the parameters A4 and B4, which are associated with the sin4θ and cos4θ terms of the Fourier expansion of the isophotal shape, respectively. The fourth-order coefficients (A4 and B4) are generally used as descriptors of the isophote deviations from simple ellipses: they are boxy when B4< 0 and A4> 0, and disky when B4> 0 and A4< 0. The best evidence of boxiness can be obtained using the B4 parameter. In the boxy bar region, PA is maintained nearly constant, and ϵ gradually increases toward the outer edge of the bar (see Beaton et al. 2007). In this study the radial profiles of B4, together with the profiles of the position angle (PA) and ellipticity (ϵ = 1−b/a) in the bar regions were derived for all barlens galaxies, of which an example is shown in Fig. 4. In the surface brightness profile the boxy bar forms part of the photometric bulge. When the barlens is boxy, it is marked in Table F.1 (see Appendix F), based on visual inspection of the isophotes and the B4 profile. The table also indicates the mean and standard deviation of B4 in the barlens region. The importance of higher-order Fourier modes for identifying X-shape features, particularly at high galaxy inclinations, has been discussed by Ciambur (2015). However, barlens galaxies in our sample do not have such high galaxy inclinations (the highest galaxy inclination is 72°). We find by visual inspection that only roughly one-quarter (19/79) of the barlenses have boxy isophotes.
In Fig. 5 the obtained ⟨ B4 ⟩ values are shown: red and green indicate our visual detection/non-detection of the boxy isophotes, respectively, which agrees well with the mean ⟨ B4 ⟩. We also show the B4 values for the synthetic images using the simulation model with B/D = 0.08. It appears that in observations and the synthetic images the detection fraction of boxy isophotes increases with galaxy inclination, so that the isophotes start to appear boxy at i ≳ 45°. We have chosen the model with B/D = 0.08 because for this model the vertically thick bar component is observed as a barlens for a wide range of galaxy inclinations. This B/D value is also close to that obtained for the true bulge components of barlens and X-shaped galaxies in the multi-component decompositions by L+2014, which were carried out for a small but representative sample of 29 barlens/X-shaped galaxies. For the B/D = 0.01 model the mean B4 in the inner bar region would be negative for all galaxy inclinations, consistent with its X-shape morphology (see Figs. 3, 14, A.1, and A.2).
Similar figures as Fig. 4 are given for all barlens galaxies in Appendix C.
4. Comparison of barlenses and X-shaped features
The sizes of barlenses and X-shaped features are compared in Fig. 6. The parameters are shown in the sky plane because it is not possible to deproject the highly inclined X-shaped galaxies in a reliable manner. It appears that the sizes of both features correlate with rbar (upper panel) so that the size increases with rbar. However, the X-shaped features are clearly smaller than barlenses (the uncertainty in both bl and X measurements is comparable to the size of the plotting symbols). The scatter is also larger for the X-shape features, which is expected because they appear at larger galaxy inclinations, and because the apparent size also depends on the angle between the X-shape and the bar major axis in a specific viewing angle. For both features the normalized (normalization to rbar) sizes are constant as a function of the parent galaxy mass (lower panel), which means that the size difference is not a mass effect. The galaxy masses are adopted from Muñoz-Mateos et al. (2015), who derived them from the 3.6 μm and 4.5 μm images that were based on mass-to-luminosity ratios from Eskew, Zaritsky & Meidt (2012).
Our size measurements for the X-shape features (a/rbar ~ 0.2–0.5, ⟨ a/rbar ⟩ ~ 0.35) agree well with a/rbar ~ 0.4 given for the B/P structures in the edge-on view by Lütticke et al. (2000), and at intermediate galaxy inclinations by ED2013. We discuss in Sect. 9.1 that the boxy bulges by ED2013 are the same entities as what we call X-shapes, for which reason such an agreement is expected.
Histograms of the minor-to-major axis ratios of barlenses and X-shaped features are compared in Fig. 7. In our combined S4G + NIRS0S sample barlenses have b/a = 0.4–1.0 (upper panel), which agrees with that shown previously for the NIRS0S galaxies by A+2015. The peak value in the sky plane is ~0.75, which in the disk plane is shifted to ~0.85. A majority of the X-shape features appears in the same b/a-range with barlenses (lower panel). However, there is no reason why the ratios should be exactly the same. For example, in the X-shape features a wing extends toward larger b/a. The galaxies in this wing are IC 1711, IC 3806, NGC 4419, NGC 4565, NGC 5145, NGC 5746, NGC 5757, and NGC 5777. Five of these galaxies have high parent galaxy inclinations (i = 70°–80°), in which galaxies the bar most probably is seen nearly end-on. A well-known example of nearly end-on galaxies is NGC 4565, which was also discussed by Kormendy & Barentine (2010). The morphology of the X-shape in NGC 4565 is very similar to our B/D = 0.08 synthetic image in Fig. A.1, seen close to the end-on view (φ = 30°, i = 90°). The three remaining galaxies have lower inclinations (i = 33°, 40°, and 65°, respectively). One of them, NGC 5145, has no detection of a bar, and in the two barred galaxies, IC 3806 and NGC 5757, the X-shaped features are among the weakest detected in our sample.
5. Comparison of observations and synthetic images
We compared the observations and synthetic images to study to which extent galaxy inclination affects the major-to-minor axis ratios and the normalized sizes of barlenses and X-shape features. The comparison is shown in Fig. 8, where the observations are shown on the left, and the synthetic images on the right.
The axis ratios of barlenses and X-shape features (in the sky plane) are shown as a function of galaxy inclination in the lower panels of Fig. 8. The qualitative agreement between the observations and synthetic images is good: b/a gradually decreases toward higher galaxy inclinations until the images are seen nearly edge-on, where b/a increases again. Moreover, barlenses and X-shaped features, both in the observations and in the synthetic images, form a continuation as a function of galaxy inclination. This behavior is independent of the simulation model used.
It is more informative to study the normalized sizes of the structures (upper panels). It appears that the size of a barlens is on average constant at i = 0°–50°, increasing toward higher galaxy inclinations (i = 50°–65°). The X-shapes also have a constant size at low galaxy inclinations, whereas at high inclinations both small and large sizes appear. Qualitatively similar tendencies can also be found for the synthetic images. However, it is important to consider the two models separately: although in both models barlenses have similar sizes, differences appear in the sizes of their X-shaped features. In the bulge model (B/D = 0.08) the X-shapes are observed only at i> 50°, where the sizes are also more similar to those of barlenses. The arrows indicate where barlenses in the face-on view, and X-shape features in the edge-on view in this model, have similar sizes. On the other hand, in the bulgeless model (B/D = 0.01) small X-shapes appear even in almost face-on view (i = 20°–40°). The size gradually increases toward higher galaxy inclinations. Inspecting the morphology of the vertically thick inner bar components in the synthetic images helps to better understand these differences between the two models: the bulge model (B/D = 0.08) lacks small X-shapes in the face-on view because at these inclinations the morphology is turned into a barlens morphology (see Fig. 3). In addition, even at higher galaxy inclinations (i = 60° inspected in Fig. A.2) small X-shapes are not visible if the azimuthal angle of the bar is large.
6. Morphology of barlens galaxies
6.1. Division of barlenses into sub-groups
Barlenses do not form a homogeneous group of features, most probably reflecting the fact that they consist of a combination of orbital families of bars, with a range of different orbital energies. To investigate their morphologies in more detail, barlenses were divided into sub-groups. Our intention is not to classify all barlens galaxies, but instead to pick up prototypical cases with clear morphological characteristics. Examples of these groups are shown in Figs. 9 and 10: the left panels show the original 3.6 μm or Ks-band images, cut in such a manner that they best show the bar region. With the same image cuts we also show the unsharp mask images in the sky-plane and when deprojected to the disk plane. The surface brightness profiles as a function of the isophotal semimajor axis are also shown, together with the profiles along the bar major and minor axis. However, when i> 65°, only the bar major axis profiles are shown. The following sub-groups were recognized:
Group a: a regular thin bar is a characteristic feature; on top of this, a round barlens appears. Outside the central peak, the barlens has an exponential surface brightness profile, both along the bar major and minor axis. The thin bar is prominent and penetrates deep into the central regions of the galaxy. The surface brightness profile along the bar major axis continues without cutoffs until the end of the bar. Good examples of this group are NGC 1015, NGC 1452, NGC 4608, and NGC 4643. As an example we show NGC 4643 in Fig. 9; this has previously also been discussed by L+2014.
Group b: a large barlens dominates the bar; it has a small-scale structure at low surface brightness levels, whose structure is typically elongated along the bar major axis. Prototypical cases are NGC 5101 shown in Fig. 9, and NGC 4314 discussed by L+2014 (see their Fig. 1). Other galaxies belonging to this group are NGC 1512, NGC 4245, NGC 4394, NGC 4596, NGC 5375, and with some reservation also NGC 1640. In many galaxies in this group the thin bar is observed only as tips at the two ends of the bar. In NGC 4314 the thin bar is clumpy at low surface brightness levels.
Group c: barlens has two components, a bright inner disk and a low surface brightness structure outside this feature. The inner disk is still larger than typical nuclear bars or rings, and it is generally oriented along the underlying large-scale disk. Examples are NGC 1398, NGC 2787, NGC 3945, NGC 4262, NGC 4371, NGC 4754, and NGC 3384, and possibly also NGC 3489. As an example we show NGC 1398 (Fig. 9). This is a group of barlens galaxies with the lowest fraction of inner rings or ring-lenses (only 33% have r/rl).
Group d: barlens and the thin bar have lower surface brightnesses than that of the underlying disk. The central regions of all these galaxies are dominated by strong nuclear bars, nuclear rings or lenses, or by a few star-forming clumps as in NGC 7552. The strong star-forming regions are well visible at 3.6 μm wavelength. Good examples are NGC 613, NGC 1097, NGC 1300, NGC 5728, and NGC 7552, of which NGC 1300 is shown in Fig. 9.
Group e: barlens dominates the bar; it is round and covers most of the bar size. The thin bar often tapers out to ansae (appear in classification by Buta et al. 2015) at the two ends of the bar. Examples of strong bars (B) are NGC 936, NGC 1440, NGC 1533, NGC 2983, NGC 3941, NGC 3992, NGC 4548, NGC 4340, NGC4579, NGC 5770, and NGC 6654. Examples of weak bars (AB) are NGC1291, NGC 1326, NGC 2859, and NGC 6782. All these weak bars also have nuclear bars, often surrounded by nuclear rings. With some uncertainty, we also include in this group the galaxies NGC 3892, NGC 3953, and NGC 4143. Our example of strong bars is NGC 4548, and of weak bars NGC 1291 (Fig. 10).
Group f: barlens dominates the bar, which has two tightly wound spiral arms starting from its end. Good examples are NGC 1079, NGC 1350, NGC 2273, NGC 2543, NGC 3368 and NGC 5026. In Fig. 10 we show NGC 2273.
Group g: barlens dominates the bar to such a level that almost no thin bar appears. All these galaxies are weakly barred (AB), and except for NGC 5750, have no inner rings. Examples are NGC 1302, NGC 2293, NGC 4503, NGC 4659, NGC 4984, NGC 5750, and NGC 6684, and with some reservation also NGC 1022. NGC 4503 has no barlens in the classification by Buta et al. (2015), but the galaxy has similar morphology as the other galaxies in this group. NGC 4659 also has an X-shaped feature in the unsharp mask image. The surface brightness profiles of these galaxies resemble those of unbarred early-type galaxies (see Laurikainen et al. 2009, 2010). As an example we show NGC 2293 (Fig. 10).
Galaxies in groups a–d are mainly strongly barred (B), in group e both strong and weak bars appear, whereas galaxies in groups f–g are weakly barred (AB). All the classified galaxies in the different barlens groups are shown in Appendix D.
6.2. Division of barlens parent galaxies into sub-groups
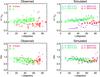 |
Fig. 8 Normalized sizes (a/rbar) and the minor-to-major axis ratios (b/a) of barlenses and X-shaped features of the galaxies are plotted as a function of parent galaxy inclination (left panels). The same parameters for the synthetic images are also shown (right panels). The simulations with a small (B/D = 0.01) and a large bulge (B/D = 0.08) are shown with different symbols. The arrows in the two panels use the model with B/D = 0.08, indicating the normalized barlens size in face-on view (green arrow in the left), and the size of the X-shape when the same model is observed edge-on (red arrow in the right). The measured uncertainties are typically smaller than 0.5 arcsec. |
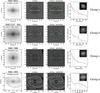 |
Fig. 9 Barlens groups a–d, as explained in Sect. 6.1. The left panels show the 3.6 μm images and the two middle panels the observed (left) and deprojected (right) unsharp mask images. The images are cut to show only the bar region, and the bar is always aligned horizontally. The green circles show the barlenses. In the right panels the surface brightness profiles are shown. The black lines are the isophotal profiles from IRAF ellipse, and the profile cuts along the bar major (blue line) and minor axis (red dashed line) are shown separately in the same panel. However, when the galaxy inclination is larger than 65°, only the major axis profile is shown. The small panels in the upper corners show the images in full size and with the original orientations in the sky. The vertical full and dashed lines indicate the sizes of barlenses and bars, respectively. The red portion of the surface brightness profile indicates the range of the unsharp mask image. For NIRS0S, Ks is shown instead of the 3.6 μm image; this is indicated in the label of the leftmost frame. |
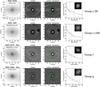 |
Fig. 10 Barlens groups e–g, as explained in Sect. 6.1. The format of the figure is the same as in Fig. 9. |
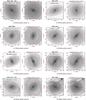 |
Fig. 11 Parent galaxy groups as defined in Sect. 6.2. The galaxies are shown both in the sky (left panels) and when deprojected onto disk plane (right panels). The red ellipse indicates the orientation of the outer disk; this corresponds to the circle in the deprojected image. The images are 3.6 μm images, unless indicated by Ks after the galaxy name. |
Similar as barlenses, their parent galaxies can also be divided into sub-groups, based on their characteristic morphological features. The following groups were recognized (see Fig. 11), ordered according to an increasing dominance of later Hubble types:
Group 1: S0-S0/a, mainly S0°; the thin bar is very weak (1a) or is dominated by ansae at the two ends of the bar (1b). Most of these galaxies have outer lenses (L) or ring-lenses (RL; in 88%; in 100% if uncertain galaxies are excluded). Example galaxies with a shallow thin bar are NGC 1440, NGC 1533, NGC 3266, NGC 3489, NGC 4659, NGC 5750, NGC 5838, and NGC 6684. Bars with ansae are NGC 2787, NGC 2983, NGC 3941, NGC 4143, NGC 4262, NGC 4754, and NGC 7079. Uncertain cases are NGC 1201 and NGC 2293, which galaxies have no L or RL. In Fig. 11 we show NGC 1440 (1a) and NGC 2787 (1b).
Group 2: S0+-S0/a, mainly S0+; an inner lens (or ring-lens) fills the space inside the bar radius. The galaxies in this group almost always also have outer rings (R) or outer lenses (L). Good examples are NGC 1079, NGC 1291, NGC 1302, NGC 1326, NGC 2859, NGC 2968, NGC 3380, NGC 3637, NGC 3945, NGC 4984, NGC 5134, NGC 5701, NGC 5728, and NGC 6782. In the galaxies NGC 1512 and NGC 1350 the region inside the bar radius is somewhat less crowded. As an example we show NGC 2859.
Group 3: S0-S0/a, mainly S0/a; these are strongly barred galaxies in which the bar tapers out into sharp features, which can be arcs or rs-type inner rings. As in group 2, all these galaxies also have outer rings (R) or lenses (L). Good examples are NGC 936, NGC 1015, NGC 4596, NGC 4643, NGC 5101, and NGC 5375, of which we show NGC 4643.
Group 4: S0-Sab, mainly Sa; a strong bar ends up into a prominent fully developed inner ring (r), which is the dominant feature of the galaxy. In some of the galaxies ansae also appear in the bar, but because of a superposition with the prominent inner rings, they are not always clear. Galaxies in this group have a wide range of Hubble types. Good examples are NGC 1452, NGC 4245, NGC 4340, NGC 4371, NGC 4454, NGC 4608, and NGC 5770, of which we show NGC 1452.
Group 5: S0-Sb, mainly Sa, Sab; galaxies in this group have two extremely open spiral arms and a lens-like structure (not an inner lens in the galaxy classification) at the bar radius. In some cases the inner feature is a lens (NGC 4314, shown in Fig. 11), and in some cases the inner feature are spiral arm segments around the bar (NGC 613 and NGC 1097). The lens in NGC 4314 is different from inner lenses in the galaxy classification because it is more elongated along the bar major axis. Other examples of this group are NGC 3368, NGC 4593, and NGC 7552.
Group 6: Sa-Sb; the dominant features are two prominent tightly wound spiral arms, starting from the two ends of the bar. In distinction to the previous group, the inner lens-like structure is missing, and the spiral arms are more tightly wound. Good examples are NGC 1300, NGC 2273, NGC 2543, NGC 4795, and NGC 5026. As an example we show NGC 2273.
Group 7: Sab-Sb; these galaxies have a fully or partly developed inner ring (r) surrounding the bar, and the outer disk is dominated by multiple spiral arms. Good examples are NGC 1433, NGC 3351, NGC 3953, NGC 3992, NGC 4639, NGC 4394, NGC 4902, NGC 5339, NGC 5850, NGC 5957, NGC 7421, IC 1067, and IC 2051. As an example we show NGC 4902: the barlens in this galaxy also shows a weak X-shaped feature in the unsharp mask image.
The galaxies identified in the different barlens parent galaxy groups are shown in Appendix E.
6.3. Cross-correlating barlens groups with their parent galaxies
Statistics of the morphological features in the galaxies with different barlens groups are collected in Table 1, and those in the parent galaxy groups are listed in Table 2. A general tendency is that barlens galaxies very often have inner rings or ring-lenses. For the barlens sample as a whole the percentage is 78%, and the fraction is at least 50% for all sub-groups. This fraction is higher in strongly barred and early-type galaxies and reaches even 100% in the barlens groups a and b. In these particular groups fewer ansae are found than in the other groups (in groups a and b 12–17% have ansae, in comparison to 33–57% in the other groups). On the other hand, the percentage of nuclear features is typically high (25–42% have nuclear bars or rings). The fraction of nuclear features in the barlens group d peaks, where all galaxies have nuclear bars or rings.
Fractions of galaxies with various morphological features in the barlens groups a–g.
The parent galaxy groups show a tendency of increasing galaxy mass from group 1a toward the group 4; the mean mass increases from log (M ∗ /M⊙) = 10.30 ± 0.19 to log (M ∗ /M⊙) = 10.83 ± 0.13. A minimum in the parent galaxy mass appears in group 4, where ⟨ log (M ∗ /M⊙) ⟩ = 10.22 ± 0.10. The uncertainties are stdev/√N. Groups 2 and 6 also have something in common: the bars in these galaxies are typically weak (only 33% belong to the B family, compared to 67–100% of strong bars in the other groups). This is so even though the galaxies are fairly massive, that is, ⟨ log (M ∗/M⊙) ⟩ = 10.58 ± 0.07 and 10.70 ± 0.10 for groups 2 and 6, respectively. Common to these two groups is also that the region inside the bar radius is crowded (even more in group 2), and the bars are often surrounded by inner (78%, 50%) and outer (89%, 50%) rings or ring-lenses. Inner rings and ring-lenses are even more common in groups 3–5 and 7, where all galaxies have such features: in the galaxies of these groups the thin bars are prominent, which might explain the large number of rings. Bars in groups 3–5 and 7 rarely show ansae (0–33% have ansae, in comparison to 17–100% in other groups). Nuclear features have a peak in parent galaxy group 5 (86% have nuclear features).
Barlens and parent galaxy groups are cross-checked in Table 3. The numbers of galaxies in which both groups were identified is fairly small, and there is also a large scatter, but some tendencies can be seen, which we describe below.
-
Group 5 – group d: barlens group d and the parent galaxy group 5 are connected: in both groups the bar has a low surface brightness, and the parent galaxy shows two open spiral arms and a lens-like structure at the bar radius. Most probably, these galaxies are efficient in transferring material towards the central regions of the galaxies as a result of the fairly shallow potential well, which triggers nuclear bars, rings, or lenses, which are typical in these galaxies. The bars never have ansae. These galaxies have the highest masses of the groups studied by us, that is, ⟨ log (M ∗ /M⊙) ⟩ = 10.86 ± 0.15 and ⟨ log (M ∗/M⊙) ⟩ = 10.71 ± 0.14 for groups d and 5, respectively.
-
Group 1b – groups c and e: barlenses that have bright inner disks (barlens group c) and the parent galaxy morphology are also connected. In three-sixth of groups c/e, the thin bar is observed mainly as ansae at the edges of the bar potential (parent galaxy group 1b). The dominant outer features are lenses (L), which appear even in 86% of these galaxies (in comparison to 5–25% in the other parent galaxy groups). On the other hand, inner rings (only 14% have r or rl) and nuclear features (only 14% have nuclear features) are less common than in any of the other parent galaxy groups.
-
Groups 3, 4, and 7 – groups a and b: The parent galaxy groups 3, 4, and 7 are associated with barlens groups a and b (four-sixths, four-sevenths, and four-fifths of the parent galaxy groups, respectively). These are mainly strongly barred galaxies, where the bar is a combination of a prominent classical bar and a prominent barlens. All these galaxies have partly or fully developed inner rings or ring-lenses (100%), whereas outer rings appear only in 33–50% of the galaxies.
7. Morphology of the galaxies with X-shaped bars
An interesting question is whether the parent galaxies of the X-shaped bars have similar morphologies as the galaxies with barlenses. Because the X-shapes appear in galaxies with higher galaxy inclinations, the observations are more susceptible to dust, and therefore any statistics of their structure components is less reliable. However, a general trend is that in a similar manner as barlenses, the galaxies with X-shapes also typically have inner rings and small inner disks (see also Bureau et al. 2006, for X-shapes in the edge-on view). Such an inner disk is particularly prominent in the X-shaped galaxy NGC 4216, with i = 79°, which we show in Fig. A.3.
Cross-checking the parent galaxy (1–7) and barlens (a–g) groups for the galaxies in which both definitions exist.
In Fig. A.4 we show three galaxies with bars that have X-shaped features: below each of these galaxies we show their barlens galaxy counterparts. The first galaxy pair is NGC 7179 (X) and NGC 5101 (bl): both are strongly barred, have a Hubble stage S0/a, and either rl or rs surrounds the thin bar. In the unsharp mask images the thin bars appear mainly as tips in flux at the two ends of the bar potential. Another example pair is IC 1067 (X) and NGC 4643 (bl): in these galaxies the inner rings are complete, and the thin bars appear as classical elongated features that penetrate deep into the central regions of the galaxies. The third pair is NGC 3673 (X) and NGC 2273 (bl): both are early-type spirals that are dominated by a barlens or an X-shaped feature, which end up into two tightly wound spiral arms. The surface brightness profiles of the first two pairs clearly shows that barlenses have central peaks, which their X-shaped counterparts lack. The galaxy with an X-shaped bar in NGC 3673 has a stronger central flux concentration than the other X-shaped bars discussed above, but it is still less prominent than in its barlens galaxy counterpart.
In the simulation models discussed in the literature, the X-shape features are generally associated with strong bars in massive galaxies (Athanassoula 2005; Martinez-Valpuesta et al. 2006), but our examples show that X-features can also appear in weak bars in low-mass galaxies. The weakest X-shapes in our sample appear in NGC 5145 and in the two low-mass galaxies IC 3806 and IC 0335 (see Fig. A.3), which have masses of log (M ∗/M⊙) = 9.49 and log (M ∗/M⊙) = 9.94, respectively. In IC 3806 and NGC 5145 the X-shape appears mainly as four blobs in the four corners of the X-feature. All three galaxies can be considered as bulgeless (meaning that they have no photometric bulge). NGC 5145 has a shallow flux concentration in the surface brightness profile, but it is actually an inner disk in the disk plane. In the unsharp mask images we also identify X-shaped features in a few strongly interacting galaxies (NGC 3227 and NGC 4302), in a warped galaxy (NGC 660), and in some otherwise peculiar galaxies (NGC 3190 and NGC 3628).
Six galaxies in our sample have a barlens in the classification by Buta et al. (2015), and an X-shape feature is identified in our unsharp mask image of these galaxies. These galaxies are NGC 3185, NGC 3380, NGC 4902, NGC 5957, NGC 7421, and IC 1067 (IC 1067 is shown in Fig. A.4). These are naturally also galaxies that appear in the overlapping inclination region of i ~ 45°–60°, where galaxies exhibit both barlenses and X-shaped features. The most face-on of these galaxies are NGC 3185 and IC 1067, with i = 38° and 49°, respectively.
8. Morphology of unbarred galaxies
Unbarred galaxies in our sample were selected based on their inner surface brightness profiles, which resemble those of barlens and X-shaped galaxies as much as possible. As an example we show a pair NGC 3599 (unbarred)/NGC 4643 (bl) in Fig. A.5. Both galaxies have a prominent central peak within 7–10′′ and an exponential sub-section outside that region. In NGC 4643 this sub-section at r ~ 30′′ corresponds to the barlens, and in NGC 3599, a similar sub-section extends to r ~ 20′′. In NGC 4643 the longer and more elongated part of the bar that we call the thin bar is observed as a bump in the surface brightness profile at r ~ 50′′; this bump is naturally lacking in the unbarred galaxy. More examples of the unbarred galaxies are shown in Fig. A.6. All these galaxies have sub-structure in the unsharp mask images, and related to their surface brightness profiles, counterparts among the barlens galaxies can also be found. For example, a fairly good correspondence in the surface brightness profiles exists between the unbarred galaxy NGC 3065 (Fig. A.6, uppermost panel) and the barlens galaxy NGC 1398 (see Fig. 9, barlens group c). Both galaxies have prominent central mass concentrations and shallower surface brightness profiles immediately outside that peak. Additional wiggles in the surface brightness profile of NGC 1398 are due to an inner ring and spiral arms.
We have used the surface brightness profiles of the unbarred galaxies to estimate the sizes of the regions corresponding the structures associated to barlenses in barred galaxies. In some galaxies this is the radius defining the photometric bulge (i.e., the flux above the exponential disk; NGC 4489), whereas in some galaxies it is the exponential sub-section outside the central peak (NGC 3599). These radial distances are marked with dotted vertical lines in Figs. A.5 and A.6.
While deciding where to place that radius, we inspected the original and unsharp mask images to identify the morphological structures behind these profiles. The sizes of these bulges together with the sizes of barlenses are plotted as a function of galaxy mass in Fig. 12. It appears that the sizes of bulges in the unbarred galaxies follow a similar relation as the sizes of barlenses. There are fewer unbarred galaxies in the figure than total unbarred galaxies in our sample because the radius of the bulge was measured only for those galaxies in which it was possible to define it in a reliable manner.
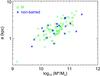 |
Fig. 12 Sizes of barlenses in barred galaxies (green boxes) and in barlens-like structure components in unbarred galaxies (blue stars), plotted as a function of galaxy stellar mass (M∗). The semimajor-axis lengths are given in kpc. |
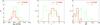 |
Fig. 13 Number histograms of the parent galaxy stellar masses (M∗), Hubble stages (T), and bulge-to-total flux ratios (B/T, taken from S4G Pipeline 4, Salo et al. (2015), are shown separately for barlenses and X-shape features in our samples. In this plot we show only galaxies at i = 45°–60°. |
To further study the nature of bulges of the unbarred galaxies, we examined possible fine-structures in their unsharp mask images. Many types of faint features can be recognized. For example, IC 2764 (Fig. A.6) shows three blobs at r ~ 12′′, which is also the radius where the nearly exponential sub-section of the surface brightness profile ends. Characteristic for NGC 4489 and NGC 3599 (Fig. A.6) is that both galaxies have weak two-armed spiral-like features inside the exponential sub-sections at r ~ 12′′ and 22′′, respectively. In NGC 5311 (see Appendix B) spiral features appear inside r ~ 22′′, which also marks the size of the nuclear lens in the classification by Buta et al. (2015). Moreover, in IC 5267 (Fig. A.6) an elongated feature appears at r = 10′′–15′′. All these galaxies have low inclinations of i = 23°–35°. It is unlikely that the faint features discussed above could form part of a dynamically hot spheroidal component, or in other words, of a classical bulge.
9. Discussion
It is widely accepted that the vertically thick B/P structures are common in the edge-on galaxies (Lütticke et al. 2000; see also the review by Laurikainen & Salo 2016); they appear in about two-thirds of the S0-Sd galaxies in the nearby universe. Many of them also show X-shaped features in unsharp mask images (Bureau et al. 2006), which confirms the bar-like origin of these structures. However, the photometric bulges of barred galaxies in less inclined galaxies have repeatedly been interpreted as classical bulges. In the words of Kormendy & Barentine (2010): “as long as face-on and edge-on galaxies appear to show physical differences we cannot be sure that we understand them”. As a possible solution to this ambiguity, it has been suggested by us that the bulges in barred Milky Way mass galaxies are the face-on counterparts of B/P bulges (L+2014; A+2015). Taking this view would considerably change the paradigm of bulge formation in the Milky Way mass galaxies. However, before such a view can be adopted, a more in-depth understanding of the properties of these features is needed.
9.1. What are barlenses?
Barlenses have been recognized as lens-like structures embedded in bars in low and moderately inclined galaxies that cover nearly half of the bar size (Laurikainen et al. 2011). The given name was somewhat unfortunate because barlenses were assumed to be vertically thick, in a similar manner as the B/P bulges in the edge-on view. This has lead to some confusion in the literature, where barlenses are sometimes considered as structures in the disk plane (note that in Gadotti et al. 2015, a projection to disc plane is meant when referring to a counterpart in the plane of the disk). Their surface brightness profiles, when examined in detail, show that barlenses appear as exponential sub-sections, both along the bar major and minor axis (L+2014, their Fig. 1; A+2015, their Fig. 2; Figs. 9, 10 and A.4 in this work). These exponential sub-sections can penetrate the central regions of the galaxies, but more often, additional central flux concentrations also appear. We have shown examples which indicate that such central concentrations are characteristic to barlenses, but are generally lacking in the X-shaped bars, which is fundamental for understanding the nature of these structures.
Our finding that only ~24% of the barlenses have boxy isophotes is also related to this matter. We have 38 galaxies in common with the sample by ED2013, who discussed boxy bar isophotes at intermediate galaxy inclinations (i> 45°). For 22 of these galaxies they found evidence of boxy isophotes, based on a similar isophotal analysis as carried out by us. ED2013 interpreted this as evidence of B/P bulges. We identified an X-shape feature in 14 of these galaxies (i.e., 64% of the B/Ps by ED2013). For the remaining 8 galaxies we confirm the boxy isophotes. In 16 of the galaxies common with our sample ED2013 did not find any evidence of boxiness, in agreement with our analysis (except for NGC 3489, for which galaxy we find boxy isophotes).
It appears that boxy isophotes at i> 45° are an efficient tool for finding the vertically thick inner bar components, which at these galaxy inclinations are manifested as X-shape features. However, most barlenses, which typically appear at lower galaxy inclinations, do not exhibit boxy isophotes.
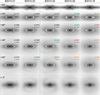 |
Fig. 14 Five simulation models from Salo & Laurikainen (2016) are shown at five different galaxy inclinations. The models differ in the bulge-to-disk mass ratio, which varies from B/D = 0.01 to B/D = 0.16. The labels in the frames for i = 30°–75° indicate the mean and standard deviation of B4 for the B/P/X/bl feature, measured from the region between the two marked isophotes. |
9.2. Barlenses form only in centrally concentrated galaxies
Barlenses have been studied before they were called as such. Laurikainen et al. (2007) called them lenses, which in the structural decompositions were fit with a separate function (usually in addition to the main bar component). In Fourier analysis the same structures were observed as flat or double peaked in the m = 2 density amplitude profiles. The resemblance of these profiles to the simulation models by Athanassoula & Misioritis (2002) caused the authors to suggest that these lenses might be vertically thick inner bar components. That barlenses can be vertically thick was later shown by L+2014 and A+2015. In the first paper the observed axial ratio distribution of the galactic disks in the combined sample of the parent galaxies of barlenses and X-shape features was shown to be flat, as expected if they are the same features seen at different viewing angles. Athanassoula et al. (2015) showed the connection between barlenses and B/Ps using hydrodynamical simulations. They considered the vertically thick inner bar components at face-on view and compared the surface brightness profiles of the model snap-shots with those seen in the observations. In the simulation models the same size was measured for the barlens in the face-on view and for the X-shape feature in the edge-on view. Consistent with this picture is also that even 88% of the B/P bulges in edge-on view show X-shaped features in the unsharp mask images (Bureau et al. 2006). However, it still remained a puzzle why barlenses appeared in earlier Hubble types than the X-shaped features. This is shown even more clearly in our Fig. 13 (middle panel) using the same inclination bin for both types of objects. In this study we furthermore showed that barlenses appear to be systematically larger than the X-shaped features in the same galaxy inclination bin (see Fig. 8).
These apparent ambiguities can be understood as due to the orientation effects and because barlenses form mainly in galaxies with peaked central mass concentrations. Salo & Laurikainen (2016) showed that a steep rotation curve is needed to create a barlens morphology in face-on view, while a more shallow rotation curve may lead to a boxy or even X-shaped face-on morphology. In principle, such central mass concentrations can be associated with classical bulges or other central mass concentrations, which are more pronounced in the early-type galaxies where barlenses generally appear. With our simulation models the effect of the central mass concentration on the bar morphology is illustrated in Fig. 14: we show five models from Salo & Laurikainen (2016) with increasing relative mass, which varies between B/D = 0.01 and 0.16. The models are shown at different galaxy inclinations (keeping the azimuthal angle fixed to φ = 90°). It appears that in the face-on view the barlens morphology becomes increasingly evident when the bulge dominance increases. Furthermore, the galaxy inclination where the barlens becomes evident depends on B/D: with large B/D the barlens is visible even at fairly high galaxy inclinations, whereas with low B/D it can be seen only in a nearly face-on view. We note that the effective radius of the bulge is fixed to the same value in all these models, which is lower than 10% of the barlens radius: thus the direct contribution of the bulge flux to the apparent barlens morphology is insignificant.
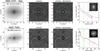 |
Fig. 15 Two galaxies in our sample, NGC 5701 and NGC 7552, which have detailed stellar population analysis in the literature. The two galaxies are in an almost face-on view, for which reason the deprojected image is almost the same as the non-deprojected image. The format is the same as in Fig. 9. |
Further observational evidence for our interpretation can be found from the bulge-disk-bar decompositions made for the S4G sample by Salo et al. (2015). In Fig. 13 we separately show the galaxies with barlenses and X-shape features: it appears that barlens galaxies are more centrally concentrated (right panel) even though they are not more massive than the galaxies with X-shaped bars (left panel). The comparison is made within an inclination bin i = 45°–60° where both features appear. Although in these decompositions even four components were used, the inner bar components were not fitted separately. More sophisticated decompositions were made by L+2014, who used a sample of 29 galaxies and fit in addition to bars, bulges, and disks also the inner bar component (bl or X) with a separate function. They found that most of the photometric bulge consists of barlenses or X-shaped features with ⟨ B(X - feature) /T) ⟩ = 0.08 ± 0.02 and ⟨ B(barlens) /T ⟩ = 0.18 ± 0.11. For the central peaks they found B/T = 0.08 ± 0.01 and 0.12 ± 0.02 for the X-shapes and barlenses, respectively (the original paper has fewer decimals). These values are not far from those used in our simulation models with B/D = 0.01 and 0.08 (i.e., B/T = 0.01 and 0.09, respectively). Again, this comparison qualitatively shows that barlenses have at least slightly higher central flux concentrations than the X-shaped bars.
The morphology of the Milky Way (Hubble type T = 3) bar/bulge, which shows an X-shape in a nearly end-on view (φ ~ 30°), has been reconstructed by Wegg et al. (2015) based on the best-fitting star count model in the near-IR. More recently, the X-shape has also been detected directly by Ness & Lang (2016). The morphology of the Milky Way bulge has been compared with that of the barlens galaxies in our sample, NGC 4314 (T = 1), by Bland-Hawthorn & Gerhard (2016; see their Figs. 9 and 10): the authors suggested that in the face-on view the projected bar/bulge of the Milky Way would resemble the barlens morphology of NGC 4314 (i = 20°). In the Milky Way the normalized size of the X-feature is 0.3 (aX/rbar = 1.5/5.0), which is the same as the sizes of the X-shape features in our sample. However, because we observe the Milky Way boxy bulge nearly end-on, it is possible that its relative size is underestimated. Both galaxies also have small inner disks (i.e., disky pseudobulges) that are embedded in the vertically thick inner bar component.
9.3. Optical colors of barlenses
Optical colors of barlenses have recently been studied by HE+2016, and it is interesting to inspect whether these barlens groups have any association with those colors. HE+2016 used Sloan Digital Sky Survey images (u,g,r,i,z) to study the colors of 43 barlens galaxies. Major and minor axis profiles along the bar were derived using the (g−r) and (i−z) color index maps. The authors found that barlenses on average have colors similar to those of the surrounding vertically thin bars. Barlenses were divided into sub-groups based on the color profiles of the major axes. The largest group were those with completely flat color profiles (10 out of 43 galaxies). Interestingly, all these galaxies are early-type systems (7 SO°-SO+, and 3 SO/a). It appears that barlenses of these galaxies have strong thin bars, i.e., they belong to our barlens groups a, b, or c. The most frequent bar type is a classical rectangular bar (i.e., barlens group a). The galaxies with dusty barlenses (8 out of 43) are typically early-type spirals. Prominent nuclear rings appear in 4 of the galaxies: these systems belong either to our barlens group a (N = 1) or b (N = 3) and to our parent galaxy groups 4 or 5. The fractions of inner rings and ring-lenses (91 and 100%, respectively) in these galaxies are exceptionally high. Of the four galaxies that have both a barlens and an X-shaped feature, the barlens structure is either dusty (2 galaxies), or has a blue nuclear region (2 galaxies).
One of the results of this comparison is that the early-type galaxies in our sample, with prominent barlenses, do not have redder central regions (compared to the color of the thin bar): if such red central regions (with sizes of barlenses) were seen, they might be interpreted as prominent classical bulges. It is also interesting that barlenses in the early-type spirals can be dusty, even though the mean colors of the barlenses correspond to the colors of typical elliptical galaxies. This means that barlenses are capable of capturing gas and convert it into stars, i.e., not all gas is transferred to the nuclear regions of the galaxies. However, colors give us only indications of the mean stellar populations, and spectroscopy is needed to distinguish possible ranges of stellar ages and metallicities in these structures.
9.4. Individual galaxies with detailed spectroscopy available in the literature
Considering that the Milky Way might have a barlens in face-on view (if it were possible to observe it face-on), it is worth looking at in which way the stellar populations and kinematics of its bulge have been interpreted in the literature. Recent reviews of the Milky Way bulge are given by Bland-Hawthorn & Gerhard (2016), Di Matteo et al. (2015), Shen & Li (2016), and González & Gadotti (2016). We also consider similar properties of two external galaxies that form part of our barlens galaxy sample, which have been studied in detail in the literature.
Milky Way (MW):
for the Milky Way bulge the early stellar population analysis pointed to a fairly massive classical bulge. The stars of the bulge were found to be metal poor and older than 10 Gyr (Terndrup et al. 1988; Ortolan et al. 1995; Zoccali et al. 2003; Brown et al. 2010). These stars were also more α-enhanced than the thick-disk stars of the same metallicity (McWilliam & Rich 1994; Rich & Origlia 2005; Zoccali et al. 2006; Lecureur et al. 2007; Hill et al. 2011; Johnson et al. 2011). These observations led to the idea that the Milky Way bulge is a fairly massive classical bulge that formed in a rapid event at high redshift, out of the gas that was not yet enriched by the cycle of star formation and feedback. The idea that the bulge could have been formed through bar-buckling episodes was therefore abandoned.
However, this picture has changed more recently. The Milky Way bulge has been found to have an X-shaped morphology (McWilliam & Zoccali 2010; Nataf et al. 2010; Wegg & Gerhard 2013; González et al. 2015). The bulge also rotates cylindrically (Howard et al. 2008; Kunder et al. 2012), as expected for a vertically thick bar component. Nearly 50% of the stellar mass at r< 10 kpc was indeed in place already at high redshift, but the most metal-rich stars ([Fe/H] > −0.4 dex) show a range of stellar ages of 3–12 Gyr. The age decreases with increasing metallicity (Bensby et al. 2013; Ness et al. 2014). Such observations are not expected in classical bulges. Although even 60% of the stars in the Milky Way bulge are metal poor, the dynamical models for the bulge do not predict a massive classical bulge (Shen et al. 2010; Di Matteo et al. 2015; see review by Shen & Li 2016): the Milky Way bulge is today interpreted to mainly form part of the bar so that at most 10% of the total galaxy mass belongs to a classical bulge, or perhaps there is no classical bulge at all.
A problem in this interpretation is how to explain the observed age, metallicity, and σ-gradients in the vertical direction (Zoccali et al. 2008; González et al. 2011; Johnson et al. 2011, 2013): the most metal-rich and youngest stars appear at low galactic latitudes, whereas the fraction of dynamically hotter, metal-poor stars (−1 < [Fe/H] < −0.5 dex) increases toward higher galactic latitudes. It has been speculated that bar buckling would dilute such stellar population gradients, but they can be explained by assuming that the oldest stars at high galactic latitudes correspond to those originally formed in the thick disk (Ness et al. 2014; Di Matteo 2016). For external galaxies, metallicity gradients in the vertical direction have not been much studied yet.
We can compare the observations of the Milky Way bulge with the stellar populations and kinematics of two barlens galaxies, NGC 5701 and NGC 7552, studied by Seidel et al. (2015). The IR-images of these galaxies, their unsharp mask images, and the surface brightness profiles are shown in Fig 15.
NGC 5701 [(R′1)SA (rl,bl)0/a]:
this galaxy belongs to our barlens group b (Fig. 9) and parent galaxy group 2 (Fig. 11). Integral-field spectroscopy was made by Seidel et al. (2015) using a field of view of 36′′, which covers most of the barlens size with a radius r = 25′′ in our definition. We used this radius to evaluate the stellar population measurements by Seidel et al. The optical colors have been studied by HE+2016: this galaxy shows flat (g−r) and (i−z) color profiles throughout the bar major axis, which colors are also typical for the elliptical galaxies. Using a full spectral fitting, Seidel et al. found flat (old) age and metallicity profiles in the barlens region (their Fig. 6). Deviations from this only appear in the innermost 4′′, where nuclear spiral arms reside (Erwin & Sparke 2002), which is also observed as a sigma drop in the same region. Seidel et al. also divided the stars into three sub-populations with different stellar ages (their Fig. 8). It appears that the mass of the barlens is dominated by the old stellar population (70–85% of the mass have ages >10 Gyr). However, outside r = 5–10′′, the intermediate-age (1.5–10 Gyr) stellar population becomes increasingly greater toward the edge of the barlens. The barlens region has a metallicity gradient: the metallicity extends from solar or slightly sub-solar ([Fe/H] ~ 0−–0.2) from the center to the outer parts. This corresponds to the intermediate metallicities observed in the Milky Way bulge.
NGC 7552 [(R′)SB(r ,bl,nr)a)]:
this galaxy belongs to our barlens group d (Fig. 9) and parent galaxy group 5 (Fig. 11). Much structure is visible in the unsharp mask image in the barlens region at r< 30′′: a nuclear star-forming ring appears at r< 5′′, and a weak ring-like feature at r ~ 20′′. These features are also observed in the stellar populations, metallicities, and kinematics, as analyzed by Seidel et al. (2015). The nuclear starburst is dominated by stars younger than 1.5 Gyr, with solar-to-subsolar metallicities. The outer ring-like feature contains a non-negligible amount of old stars (~14 Gyr), with lower metallicities than the stars in the inner parts of the galaxy. Although old stars (>10 Gyr) appear throughout the barlens, the fraction of intermediate age stars (1.5–10 Gyr) exceeds this fraction in many regions. Moreover, very young stars (<1.5 Gyr) appear throughout the barlens. This galaxy also has a metallicity gradient: the metallicities in the barlens region are similar to or slightly lower than those in NGC 5701. The rotation curve in the barlens region also shows a double hump, which feature is generally associated with B/P bulges.
The interpretation that massive classical bulges appear in external Milky Way mass early-type galaxies is mainly based on photometry (bulges have high Sérsic indexes and B/T values) and on the observation that their stars are on average as old as those in elliptical galaxies. Based on the mass-weighted mean stellar ages of the above two barlens galaxies (excluding the nuclear starburst in NGC 7552), we could in principle make the same conclusion. In NGC 5701 the bulge stars are also old when we use the light-weighted stellar ages. The typical stellar ages of ~10 Gyr or older are similar to those observed in the Milky Way bulge (Sanchez-Blázquez et al. 2011, hereafter SB+2011, and references there). Moreover, the metallicites of these galaxies are similar to those of the Milky Way bulge (in NGC 5701 it is slightly higher than in the Milky Way bulge). However, when we consider the stellar populations in more detail, we find that both galaxies have a range of stellar ages and metallicity gradients that are again similar to those found in the Milky Way bulge. NGC 7552 also has kinematic evidence associating the barlens with a vertically thick bar component.
As in the Milky Way, the stellar populations of the barlenses in NGC 5701 and NGC 7552 are difficult to interpret by means of classical bulges although 80% (in NGC 5701) and 50% (in NGC 5772) of their stars were formed at high redshifts. In the Milky Way bulge this fraction is ~60%. In photometric decompositions the values of the Sérsic index and B/T mainly depend on how the decompositions are made (see L+2014): low values are obtained when both the thin bar and the barlens are fit with separate functions. This is what needs to be done when we are interested in isolating bulges that do not form part of the bar itself.
Kinematic evidence of a B/P bulge has also been found for the barlens galaxy NGC 1640 in our sample by Méndez-Abreu et al. (2014): they used the h4 coefficient of the Gauss-Hermite parametrization of the line-of-sight velocity distribution and showed that NGC 1640 has a double minimum before the end of the bar, which the authors interpreted as evidence of a vertically thick bar component. Similarly, kinematic evidence of B/P was found by Méndez-Abreu et al. (2008) for NGC 98, which galaxy we would classify as having a barlens (but it does not form part of our sample because it is located at too large a distance). It appears that a detailed stellar population, kinematics, and morphological analysis is needed for more galaxies with barlens and X-shaped bars.
9.5. Stellar populations and kinematics in the samples of barred and unbarred galaxies
We can also examine what is known about stellar populations of bulges in major galaxy samples. B/P bulges in the edge-on S0-Sa galaxies have been studied by Williams et al. (2011) and Williams et al. (2012). They found that the main body of the B/P bulges lack a correlation between metallicity gradient and velocity dispersion σ, although such a correlation exists in elliptical galaxies and is indeed expected in highly relaxed systems. In many studies photometric bulges in the S0-Sbc galaxies are found to be old on average (>10 Gyr), similar to those in elliptical galaxies (Proctor & Sansom 2002; Falcón-Barroso et al. 2006; McArthur et al. 2009). Bars and photometric bulges also seem to have similar stellar populations that are dominated by old metal-rich stars (Perez et al. 2011, SB+2011). The mass-weighted age-gradients are flat at all radii, and the metallicity decreases from the center outwards (Sánchez-Blázquez et al. 2014, hereafter SB+2014). Bulges also have older stars and higher metallicities than the disks (SB+2014), although relatively old stars (age <4 Gyr) dominate even the disks in spiral galaxies (Morelli et al. 2015). These stellar population ages of bulges and bars are consistent with the colors obtained for barlenses by HE+2016.
However, as discussed in the previous section, photometric bulges can also have young stellar populations, which is obvious either by comparing the mean mass and light-weighted ages or by dividing the stellar ages into different bins, as was done, for example, by Seidel et al. (2015). Young stellar ages particularly dominate the bulges of low surface brightness galaxies (Morelli et al. 2012). The stellar populations of bulges in the Calar Alto Legacy Integral Field Spectroscopy Area (CALIFA) survey of ~300 galaxies, which covers the redshifts of z = 0.005–0.03, and the galaxy mass range of log (M ∗/M⊙) = 9.1–11.8, has recently been analyzed by González-Delgado et al. (2015). They found that the photometric bulges in Sa-Sb galaxies and in the cores of E/S0 galaxies have similar old metal-rich stars. They also found, however, that the light-weighted mean stellar ages of the bulges in Sa – Sb galaxies are only ~6 Gyr old, compared to ~10 Gyr obtained from the mass-weighted stellar ages. Only in Sc−Scd Hubble types both the light- and mass-weighted stellar population ages of bulges are younger than those of the bulges in earlier Hubble types.
Stellar population studies of barred and unbarred galaxies have shown apparently controversial results, but as discussed by Laurikainen & Salo (2016), a critical point is how the bulge is defined. More metal-rich and α-enhanced bulges in barred galaxies are found by Pérez & Sánchez-Blázquez (2011), who considered as bulges the central regions with similar sizes as nuclear rings. It is well known that the central regions of barlenses frequently have nuclear features (Laurikainen et al. 2011; discussed also in this study): in case of nuclear rings, they are star-forming regions, whereas nuclear bars typically have old stellar populations. Therefore, relying on these regions would not tell us anything about the stellar populations of possible spheroidals or B/P bulges of bars. On the other hand, similar stellar populations in barred and unbarred galaxies have been found by SB+2014 for 62 face-on galaxies, and also by Jablonka et al. (2007) for 32 edge-on galaxies, without restricting the research to the innermost regions of bars. These two studies used synthetic stellar population methods in their analysis. It is worth noting that the above results do not rule out the possibility that bulges in unbarred galaxies were formed in similar processes as the vertically thick inner bar components.
Kinematics of bulges have generally been studied only in small galaxy regions that do not yet cover the sizes of barlenses (see the review by Falcón-Barroso 2016; and Méndez-Abreu 2016). In Atlas3D (Emsellem et al. 2011; Cappellari et al. 2007) most of the bulges were found to be fast rotating, which is consistent with the idea that they are features of the disk. Only 15% of the bulges in Atlas3D have signatures of B/Ps in terms of double-humped rotation curves or twisting isophotes (Krajnović et al. 2011). However, when is restricting to barlenses and X-shaped structures, as identified in our study, even 36% of the X-shapes and 56% of barlenses in Atlas3D have boxy or twisted isophotes. Most probably, the kinematic analysis performed for the Atlas3D has recognized only a small fraction of possible B/P/X-shaped bulges in that sample.
For the kinematics of unbarred galaxies, the recent study by Holmes et al. (2015), based on the CALIFA survey, is interesting. The authors used Hα velocity fields to search for bar-like non-circular flows in barred and unbarred systems. Weakly barred (AB) systems are typically below their detection limit, but still, clear non-circular flows were detected in a few unbarred galaxies, which have no photometric evidence of a bar. These galaxies are not interacting systems and have no isophotal twists. When we consider that only strong amplitudes were detected, most probably this study only covered the top of the iceberg. These photometrically unbarred galaxies could be similar to the unbarred galaxies studied by us. They are not classified as barred, but their photometric bulges might be similar to the inner parts of strong bars, which are manifested as B/P/X in the edge-on view and as barlenses in face-on view.
9.6. How relevant is the idea that bulges in the Milky Way-mass galaxies are mainly inner parts of bars?
We have discussed that the stars of bulges in the Milky Way mass S0s and early-type spirals in the CALIFA survey (González-Delgado et al. 2015) are older and more metal rich than the stars of their disks. A large majority of the stars in bulges are as old as in the cores of elliptical galaxies. Excluding the nuclear regions, bars and bulges also have similar mean stellar population ages and metallicities (SB+2014). Detailed analyses of some individual barlens galaxies have also shown that the photometric bulges have a range of stellar ages between 1.5–14 Gyr, which means that the masses of bulges must have been accumulated in a long period of time, or at least more than one starburst event has occurred. In barlens galaxies the photometric bulge consists mostly of the barlens itself. The observation that their mass correlates with the galaxy mass (González-Delgado et al. 2015) is also consistent with the idea that bulges were not formed in a single event. When galaxies are evolved in isolation, their central mass concentrations are lower than in galaxies of clusters, but even in isolated galaxies, bulges have old stellar populations (i.e., are red in g−i) (Fernández Lorenzo et al. 2006). Because bars and photometric bulges are mainly made of the same stellar populations, it is possible that bars have played an important role in accumulating the central mass concentrations in galaxies in some process that lifts the stars to higher vertical distances, i.e., makes B/P/bl bulges.
The stellar populations and metallicities of the formed bulge depend on the possible interaction between the thin bar and the thick disk, in addition to the formation and evolution of the bar itself, and also on how efficiently the bar collects gas from the surrounding disk. It has been shown by the simulation models that when a barlens forms, a range of stellar population ages appears in the barlens. In the models by Athanassoula et al. (2013), analyzed by A+2015, barlenses form first in the oldest stellar population, to which mass are added later stars that formed from the gas that is gradually accumulated by the bar and the barlens. A different approach was taken by Athanassoula et al. (2016b), who studied mergers of two disk galaxies with hot gaseous halos, which eventually became Milky Way-mass galaxies with B/T = 0.1–0.2 for the classical bulge. The classical bulge that formed during a violent relaxation has the oldest stars, while the stars in the barlens are younger and cover a range of stellar ages (7.8–8.6 Gyr), which stars were mainly formed during the assembling of the disk. These simulations are also qualitatively consistent with the barlens observations, although the barlenses discussed in our study can also have younger stars, probably related to later gas accretion to these galaxies. However, it is good to recall that even based on stellar populations, there is no unambiguous way of distinguishing barlenses and classical bulges: classical bulges formed by wet minor mergers can also have young stellar populations, or old stars in the central regions of bars might appear that originated from the thick disks. Furthermore, although promising, even the above major-merger simulations, with relatively small B/T, still have a problem of making too much of a bulge during the violent relaxation phase (see also the review by Brooks & Christensen 2016).
It is predicted by the cosmological simulation models (de Buhr et al. 2012) that bars that form inside the dark matter halos at z = 1–1.3 buckle at z = 0.5–0.7, thus forming B/P bulges. These bars are long-lasting and are maintained until z = 0. In principle, earlier bar formation is also possible, but their formation is restricted by large gas portions observed in high-redshift galaxies (gas cannot cool to form stars), and also by a threshold in the relative disk-to-halo mass needed to trigger the disk instability. The epoch predicted for the formation of boxy bulges by de Buhr et al. (2012) is close to z ~ 1, when most of the central mass concentration in galaxies seems to be assembled (van Dokkum et al. 2013). Although the Hubble sequence might be in place at some level already at z = 2.5 (Wuyts et al. 2011), many galaxies at z = 1–3 still have an irregular clumpy appearance (Abraham et al. 1996; van den Berg et al. 1996; Elmegreen et al. 2007). Based on Fourier analyses of bars, Salo & Laurikainen (2016) have shown using stacked S4G density profiles that the bars with barlenses or X-shaped features are mode centrally concentrated than bars in general, indicating that bars and bulges in these galaxies are coupled (see also Díaz-García et al. 2016b, for barred and unbarred galaxies).
Using a volume-limited sample, Aguerri et al. (2009) have shown that the local galaxy densities of barred and unbarred galaxies are similar, which in our view calls for an explanation for the formation of bulges in unbarred galaxies. Living in similar environments with barred galaxies, their formative processes cannot be completely different. In this study we have discussed potential candidates of unbarred galaxies that might have bar-like potential wells. This type of bar potentials in unbarred galaxies was discussed from the theoretical point of view by Patsis et al. (2002): these bulges follow similar orbital families as the vertically thick bar components, but are lacking the more extended vertically thin bar components. It seems that there is room for the interpretation that most of the bulge mass in the Milky Way-mass galaxies resides in bars.
10. Summary and conclusions
We used the Spitzer Survey of Stellar Structure in Galaxies (S4G, Sheth et al. 2010) and the Near-IR S0 galaxy survey (NIRS0S, Laurikainen et al. 2011) to compare the properties of barlenses and X-shaped features in the infrared. The sample consists of 88 X-shape features identified in the unsharp mask images, and 85 barlenses that appear in the classifications by Buta et al. (2015) and Laurikainen et al. (2011). Additionally, 41 unbarred galaxies were selected with surface brightness profiles similar to the other galaxies studied by us. The observations were also compared with synthetic images using N-body simulation models.
Unsharp mask images were created for all 214 galaxies, which were used to measure the sizes and ellipticities of the X-shape features and to inspect the low surface brightness features of bars. We also carried out an isophotal analysis for barlenses, from which we obtained the radial profiles of the position angles (PA), ellipticities (ϵ), and B4 cosine terms. Synthetic images were created using two simulation models taken from Salo & Laurikainen (2016), one representing a bulgeless galaxy (B/D = 0.01), and another where the galaxy had a small bulge (B/D = 0.08) at the beginning of the simulation. The model images were rotated so that a full range of galaxy inclinations in the sky was obtained, which images were measured in a similar manner as the observations. The following results were obtained.
-
1.
Barlenses in the combined S4G+NIRS0S sample have sizes of a/rbar ~ 0.5, confirming the previous result by A+2015 for NIRS0S. We find that the X-shape features appear smaller by almost a factor two than barlenses, which is the case even at i = 45°–65°, where both features appear. We showed that this size difference is mainly a projection effect, and arises because barlenses form in more centrally concentrated galaxies: observations and simulations show very similar trends, even when the intrinsic sizes of barlenses and X-shape features are the same in the models. Our simulation models with different bulge masses suggest that to observe an X-shape at i ≲ 40°, the central mass concentration needs to be low. This is consistent with the observation that the X-shaped features predominantly appear in galaxies with smaller B/T than the barlenses.
-
2.
Minor-to-major axis ratios of barlenses appear at b/a = 0.5–1.0, in agreement with those given by A+2015 for NIRS0S. Our analysis also showed that the b/a-distribution for the X-shaped features is similar, although not necessarily the same as for barlenses. A comparison with the synthetic images showed very similar b/a variations as a function of galaxy inclination.
-
3.
We showed that only 24% of the barlenses have boxy isophotes, which fraction steadily increases for higher galaxy inclination. This was shown using the B4 parameter, which becomes on average negative for i ≳ 50°. A remarkably similar trend was obtained for the vertically thick bar component in our simulation model with B/D = 0.08. We also verified that the observations of B/P bulges of bars by ED2013 are consistent with this picture. Moreover, at intermediate galaxy inclinations, we found six galaxies with a barlens in the classification by Buta et al. (2015) and an X-shaped feature in our unsharp mask image.
-
4.
Barlenses were divided into morphological sub-groups based on the fine structures that were visible in the unsharp mask images. Barlenses can be round featureless structures, or they can have additional low surface brightness features along the bar major axis. Most of the barlenses appear in strong bars of bright galaxies, but they are recognized also in weakly barred galaxies. Our group g, representing the weakest bars of the barlenses in our sample, are morphologically close to unbarred galaxies. Examples of galaxies with X-shaped features detected in weak bars in low-mass galaxies are IC 3806, IC 335, and NGC 5145.
-
5.
The sizes of bulges in unbarred galaxies were measured by mimicking the barlens regions of typical barlens galaxies. We found that the sizes of these photometric bulges correlate with the galaxy mass in a similar manner as the sizes of barlenses. We speculate that these bulges in unbarred galaxies might form in nearly bar-like potentials, as predicted by Patsis et al. (2002).
-
6.
The parent galaxies of barlenses were also divided into sub-groups. Characteristic features are inner rings and ring-lenses, which appear in 50–100% of the barlens galaxies. The fractions of inner disks (disky pseudobulges) and ansae (at the two ends of the bar) vary among the different parent galaxy groups. Galaxy mass steadily increases from groups 1 to 4, which is also associated with a decreasing fraction of early-type galaxies among these groups. Morphological counterparts of some barlens parent galaxies were identified among the galaxies with X-shaped bars.
In summary, we have shown evidence that barlenses at low galaxy inclinations are physically the same inner bar components as B/P/X-shape features in more inclined galaxies. Whether these structures are barlenses or show boxy/peanut/X-shaped features depends, in addition to the galaxy orientation, also on the central mass concentration of the parent galaxy. This was shown by directly comparing the properties of barlenses and X-shaped features, and was also verified by our simulation models.
For two barlens galaxies we discussed the detailed stellar populations and kinematics from the literature in the context of the identified barlenses. The properties of these galaxies were also compared with those of the Milky Way bulge. We conclude that the stellar populations of barlenses in these galaxies are similar to those of the Milky Way bulge.
Acknowledgments
We acknowledge Panos Patsis for valuable discussions while prepearing this manuscript, and the anonymous referee, whose comments have considerably increased the quality of this paper. We also acknowledge the Spitzer Space Telescope of the allocated observing for the S4G-project, and also of the observing time allocated to NIRS0S project during 2003–2009, based on observations made with several telescopes. They include the New Technology Telescope (NTT), operated at the Southern European Observatory (ESO), William Herschel Telescope (WHT), the Italian Telescopio Nazionale Galileo (TNG), and the Nordic Optical Telescope (NOT), operated on the island of La Palma. This work was also supported by the DAGAL network: Programme (Marie Curie Actions) of the European Unions Seventh Framework Programme FP7/2007-2013 under REA grant agreement number PITN-GA-2011-289313. We also acknowledge Riku Rautio for participating in making some of the X-shaped measurements.
References
- Abraham, R., Tanvir, N. R., Santiago, B. X., et al. 1996, MNRAS, 279, 47 [Google Scholar]
- Athanassoula, E. 2005, MNRAS, 358, 1477 [NASA ADS] [CrossRef] [Google Scholar]
- Athanassoula, E. 2016, in Galactic Bulges (Switzerland: Springer International Publishing), Astrophys. Space Sci. Libr., 418, 391 [NASA ADS] [CrossRef] [Google Scholar]
- Athanassoula, E., & Misioritis, A. 2002, MNRAS, 330, 35 [NASA ADS] [CrossRef] [Google Scholar]
- Athanassoula, E., Machado, R. E. G., & Rodionov, S. A. 2013, MNRAS, 429, 1949 [NASA ADS] [CrossRef] [Google Scholar]
- Athanassoula, E., Laurikainen, E., Salo, H., & Bosma, A. 2015, MNRAS, 454, 3843 (A+2015) [NASA ADS] [CrossRef] [Google Scholar]
- Athanassoula, E., Rodionov, S. A., Peschen, J. C., & Lambert, J. C. 2016, ApJ, 821, 90 [NASA ADS] [CrossRef] [Google Scholar]
- Aguerri, J. A. L., Méndez-Abreu, J., & Corsini, E. M. 2009, A&A, 495, 491 [NASA ADS] [CrossRef] [EDP Sciences] [Google Scholar]
- Beaton, R. L., Majewski, S. R., Guhathakurta, P., et al. 2007, ApJ, 658, 91 [Google Scholar]
- Bensby, T., Yee, J. C., Feltzing, S., et al. 2013, A&A, 549, A147 [NASA ADS] [CrossRef] [EDP Sciences] [Google Scholar]
- Bland-Hawthorn, J., & Gerhard, O. 2016, ARA&A, 54, 529 [NASA ADS] [CrossRef] [EDP Sciences] [Google Scholar]
- Bournaud, F., Daddi, E., Elmegreen, B. G., et al. 2008, A&A, 486, 741 [NASA ADS] [CrossRef] [EDP Sciences] [Google Scholar]
- Bureau, M., & Freeman, K. C. 1999, AJ, 118, 126 [NASA ADS] [CrossRef] [Google Scholar]
- Bureau, M., Aronica, G., Athanassoula, E., et al. 2006, MNRAS, 370, 753 [NASA ADS] [CrossRef] [Google Scholar]
- Brown, T. M., Sahu, K., Anderson, J., et al. 2010, ApJ, 725, L19 [NASA ADS] [CrossRef] [Google Scholar]
- Brooks, A., & Christensen C. 2016, in Galactic Bulges (Switzerland: Springer International Publishing), Astrophys. Space Sci. Libr., 418, 317 [Google Scholar]
- Buta, R. J., Sheth, K., Athanassoula, E., et al. 2015, ApJS, 217, 32 [NASA ADS] [CrossRef] [Google Scholar]
- Cappellari, M., Emsellem, E., Bacon, R., et al. 2007, MNRAS, 379, 418 [NASA ADS] [CrossRef] [Google Scholar]
- Ciambur, B. C. 2015, ApJ, 810, 120 [NASA ADS] [CrossRef] [Google Scholar]
- de Buhr, J., Ma, C.-P., & White, S. 2015, MNRAS, 426, 983 [NASA ADS] [CrossRef] [Google Scholar]
- Díaz-García, S., Salo, H., Laurikainen, E., & Herrera-Endoqui, M. 2016a, A&A, 587, A160 [NASA ADS] [CrossRef] [EDP Sciences] [Google Scholar]
- Díaz-García, S., Salo, H., & Laurikainen, E. 2016b, A&A, accepted [Google Scholar]
- Di Matteo, P. 2016, PASA, DOI: 10.1051/0004-6361/10.1017/pas.2016 [Google Scholar]
- Di Matteo, P., Gómez, A., Haywood, M., et al. 2015, A&A, 577, A1 [NASA ADS] [CrossRef] [EDP Sciences] [Google Scholar]
- Elmegreen, B. G., Elmegreen, D. M., Knapen, J. H., et al. 2007, ApJ, 670, 97 [Google Scholar]
- Elmegreen, B. G., Elmegreen, D. M., Fernandez, M., & Lemonias, J. 2009, A&A, 692, 12 [Google Scholar]
- Emsellem, E., Cappellari, M., Krajnović, D., et al. 2011, MNRAS, 414, 888 [NASA ADS] [CrossRef] [Google Scholar]
- Erwin, P., & Debattista, V. 2013, MNRAS, 431, 3060 (ED2013) [NASA ADS] [CrossRef] [Google Scholar]
- Erwin, P., & Sparke, L. S. 2002, AJ, 124, 65 [NASA ADS] [CrossRef] [Google Scholar]
- Eskew, M., Zaritsky, D., & Meidt, S. 2012, AJ, 143, 139 [NASA ADS] [CrossRef] [Google Scholar]
- Falcón-Barroso, J., Bacon, R., Bureau, M., et al. 2006, MNRAS, 369, 529 [NASA ADS] [CrossRef] [Google Scholar]
- Fernández Lorenzo, M., Sulentic, J., Verdes-Montenegro, L., et al. 2014, ApJ, 788, 39 [Google Scholar]
- Gadotti, D., Seidel, M., Sánchez-Blázquez, P., et al. 2015, A&A, 584, A90 [NASA ADS] [CrossRef] [EDP Sciences] [Google Scholar]
- González, O., & Gadotti, D. 2016, in Galactic Bulges (Switzerland: Springer International Publishing), Astrophys. Space Sci. Libr., 418, 199 [NASA ADS] [CrossRef] [Google Scholar]
- González, O. A., Rejkuba, M., Zoccali, M., et al. 2011, A&A, 530, A54 [NASA ADS] [CrossRef] [EDP Sciences] [Google Scholar]
- González, O. A., Zoccali, M., Debattista, V. P., et al. 2015, A&A, 583, L5 [NASA ADS] [CrossRef] [EDP Sciences] [Google Scholar]
- González-Delgado, R. M., García-Benito, R., Pérez, E., et al. 2015, A&A, 581, A103 [NASA ADS] [CrossRef] [EDP Sciences] [Google Scholar]
- Herrera-Endoqui, M., Díaz-García, S., Laurikainen, E., & Salo, H. 2015, A&A, 582, A86 (HE+2015) [NASA ADS] [CrossRef] [EDP Sciences] [Google Scholar]
- Herrera-Endoqui, M., Salo, H., Laurikainen, E., & Knapen, J. 2016, A&A, accepted (HE+2016) [Google Scholar]
- Hill, V., Lecureur, A., Gómez, A., et al. 2011, A&A, 534, A80 [NASA ADS] [CrossRef] [EDP Sciences] [Google Scholar]
- Holmes, L., Spekkens, K., Sánchez, S. F., et al. 2015, MNRAS, 451, 4397 [NASA ADS] [CrossRef] [Google Scholar]
- Hopkins, P., Somerville, R., Cox, T., et al. 2009, MNRAS, 397, 802 [NASA ADS] [CrossRef] [Google Scholar]
- Howard, C. D., Rich, R. M., Reitzel, D. B., et al. 2008, ApJ, 688, 1060 [NASA ADS] [CrossRef] [Google Scholar]
- Iannuzzi, F., & Athanassoula, E. 2015, MNRAS, 450, 2514 [NASA ADS] [CrossRef] [Google Scholar]
- Jablonka, P., Gorgas, J., & Goudfrooij, P. 2007, A&A, 474, 763 [NASA ADS] [CrossRef] [EDP Sciences] [Google Scholar]
- Johnson, C. I., Rich, R. M., Fulbright, J. P., et al. 2011, ApJ, 732, 108 [NASA ADS] [CrossRef] [Google Scholar]
- Johnson, C. I., Rich, R. M., Kobayashi, C., et al. 2013, ApJ, 765, 157 [NASA ADS] [CrossRef] [Google Scholar]
- Kormendy, J. 2016, in Galactic Bulges (Switzerland: Springer International Publishing), Astrophys. Space Sci. Libr., 418, 431 [NASA ADS] [CrossRef] [Google Scholar]
- Kormendy, J., & Barentine, J. C. 2010, ApJ, 715, 176 [Google Scholar]
- Kormendy, J., & Illingworth, G. 1982, ApJ, 256, 460 [NASA ADS] [CrossRef] [Google Scholar]
- Krajnović, D., Emsellem, E., Cappellari, M., et al. 2011, MNRAS, 414, 2923 [NASA ADS] [CrossRef] [Google Scholar]
- Kunder, A., Koch, A., Rich, R. M., et al. 2012, AJ, 143, 57 [NASA ADS] [CrossRef] [Google Scholar]
- Laurikainen, E., & Salo, H. 2016, in Galactic Bulges (Switzerland: Springer International Publishing), Astrophys. Space Sci. Libr., 418, 77 [NASA ADS] [CrossRef] [Google Scholar]
- Laurikainen, E., Salo, H., Buta, R., & Knapen, J. H. 2007, MNRAS, 381, 401 [NASA ADS] [CrossRef] [Google Scholar]
- Laurikainen, E., Salo, H., Buta, R., & Knapen, J. H. 2009, ApJ, 692, 34 [Google Scholar]
- Laurikainen, E., Salo, H., Buta, R., Knapen, J. H., & Comerón, S. 2010, MNRAS, 405, 1089 [NASA ADS] [Google Scholar]
- Laurikainen, E., Salo, H., Buta, R., & Knapen, J. 2011, MNRAS, 418, 1452 [NASA ADS] [CrossRef] [Google Scholar]
- Laurikainen, E., Salo, H., Athanassoula, E., et al. 2013, MNRAS, 430, 3489 [NASA ADS] [CrossRef] [Google Scholar]
- Laurikainen, E., Salo, H., Athanassoula, E., & Bosma, A. 2014, MNRAS, 444, 80 (L+2014) [Google Scholar]
- Lecureur, A., Hill, V., Zoccali, M., et al. 2007, A&A, 465, 799 [NASA ADS] [CrossRef] [EDP Sciences] [Google Scholar]
- Lütticke, R., Dettmar, R.-J., & Pohlen, M. 2000, A&AS, 145, 405 [NASA ADS] [CrossRef] [EDP Sciences] [Google Scholar]
- Martinez-Valpuesta, I., Shlosman, I., & Heller, C. 2006, ApJ, 637, 214 [NASA ADS] [CrossRef] [Google Scholar]
- McArthur, L., González, J., & Courteau, S. 2009, MNRAS, 395, 28 [NASA ADS] [CrossRef] [Google Scholar]
- McWilliam, A, & Rich, R. M. 1994, ApJS, 91, 749 [NASA ADS] [CrossRef] [Google Scholar]
- McWilliam, A., & Zoccali, M. 2010, ApJ, 724, 1491 [NASA ADS] [CrossRef] [Google Scholar]
- Méndez-Abreu, J. 2016, in Galactic Bulges (Springer International Publishing Switzerland), Astrophys. Space Sci. Libr., 418, 15 [NASA ADS] [CrossRef] [Google Scholar]
- Méndez-Abreu, J., Corsini, E. M., Debattista, V. P., et al. 2008, ApJ, 679, 73 [Google Scholar]
- Méndez-Abreu, J., Debattista, V. P., Corsini, E. M., & Aguerri, J. A. L. 2014, A&A, 572, A25 [NASA ADS] [CrossRef] [EDP Sciences] [Google Scholar]
- Molaeinezhad, A., Falcón-Barroso, J., Martínez-Valpuesta, I., et al. 2016, MNRAS, 456, 692 [NASA ADS] [CrossRef] [Google Scholar]
- Morelli, L., Corsini, E. M., Pizzella, A., et al. 2008, MNRAS, 452, 1128 [Google Scholar]
- Morelli, L., Corsini, E. M., Pizzella, A., et al. 2012, MNRAS, 423, 962 [NASA ADS] [CrossRef] [Google Scholar]
- Muñoz-Mateos, J. C., Sheth, K., Regan, M., et al. 2015, ApJS, 219, 3 [NASA ADS] [CrossRef] [Google Scholar]
- Nataf, D. M., Udalski, A., Gould, A., et al. 2010, ApJ, 721, L28 [NASA ADS] [CrossRef] [Google Scholar]
- Ness, M., & Lang, D. 2016, AJ, 152, 14 [NASA ADS] [CrossRef] [Google Scholar]
- Ness, M., Debattista, V. P., Bensby, T., et al. 2014, ApJ, 787, L19 [NASA ADS] [CrossRef] [Google Scholar]
- Ortolani, S., Renzini, A., Gilmozzi, R., et al. 1995, Nature, 377, 701 [NASA ADS] [CrossRef] [Google Scholar]
- Patsis, P. A., Athanassoula, E., Grosbøl, P., & Skokos, Ch. 2002, MNRAS, 335, 1049 [NASA ADS] [CrossRef] [Google Scholar]
- Pérez, I., & Sánchez-Blázquez, P. 2011, A&A, 529, A64 [NASA ADS] [CrossRef] [EDP Sciences] [Google Scholar]
- Proctor, R. N., & Sansom, A. E. 2002, MNRAS, 333, 517 [NASA ADS] [CrossRef] [Google Scholar]
- Querejeta, M., Meidt, S. E., Schinnerer, E., et al. 2016, ApjS, 219, 5 [Google Scholar]
- Rich, R. M., & Origlia, L. 2005, ApJ, 634, 1293 [NASA ADS] [CrossRef] [MathSciNet] [Google Scholar]
- Salo, H., & Laurikainen, E. 2016, ApJL, submitted [Google Scholar]
- Salo, H., Laurikainen, E., Laine, J., et al. 2015, ApJS, 219, 4 [NASA ADS] [CrossRef] [Google Scholar]
- Sánchez-Blázquez, P., Ocvirk, P., Gibson, B. K., et al. 2011, MNRAS, 415, 709 (SB+2011) [NASA ADS] [CrossRef] [Google Scholar]
- Sánchez-Blázquez, P., Rosales-Ortega, F. F., Méndez-Abreu, J., et al. 2014, A&A, 570, A6 (SB+2014) [NASA ADS] [CrossRef] [EDP Sciences] [Google Scholar]
- Seidel, M. K., Cacho, R., Rioz-Lara, T., et al. 2015, MNRAS, 446, 2837 [NASA ADS] [CrossRef] [Google Scholar]
- Shen, J., & Li, Z. 2016, in Galactic Bulges (Switzerland, Springer International Publishing), Astrophys. Space Sci. Libr., 418, 233 [NASA ADS] [CrossRef] [Google Scholar]
- Sheth, K., Regan, M., Hinz, J. L., et al. 2010, PASP, 122, 1397 [NASA ADS] [CrossRef] [Google Scholar]
- Springel, V., & Hernquist, L. 2005, ApJ, 622, L9 [NASA ADS] [CrossRef] [Google Scholar]
- Terndrup, D., Elias, J., Gregory, B., et al. 1988, AJ, 96, 884 [NASA ADS] [CrossRef] [Google Scholar]
- van den Berg, S., Abraham, R., Ellis, R., et al. 1996, Astron. Lett., 112, 359 [Google Scholar]
- van Dokkum, P. G., Leja, J., Nelson, E. J., et al. 2013, ApJ, 771, 35 [Google Scholar]
- Wegg, C., & Gerhard, O. 2013, MNRAS, 435, 1874 [Google Scholar]
- Wegg, C., Gerhard, O., & Portail, M. 2015, MNRAS, 450, 4050 [NASA ADS] [CrossRef] [Google Scholar]
- White, S. D., & Rees, M. J. 1978, MNRAS, 183, 341 [NASA ADS] [CrossRef] [Google Scholar]
- Williams, M. J., Zamojski, M. A., Bureau, M., et al. 2011, MNRAS, 414, 2163 [NASA ADS] [CrossRef] [Google Scholar]
- Williams, M. J., Bureau, M., & Kuntschner, H. 2012, MNRAS, 427, 99 [Google Scholar]
- Wuyts, S., Förster Schreiber, N. M., van der Wel, A., et al. 2011, ApJ, 742, 96 [NASA ADS] [CrossRef] [Google Scholar]
- Zoccali, M., Renzini, A., Ortolani, S., et al. 2003, A&A, 399, 931 [NASA ADS] [CrossRef] [EDP Sciences] [Google Scholar]
- Zoccali, M., Lecureur, A., Barbuy, B., et al. 2006, A&A, 457, L1 [NASA ADS] [CrossRef] [EDP Sciences] [Google Scholar]
- Zoccali, M., Hill, V., Lecureur, A., et al. 2008, A&A, 486, 177 [NASA ADS] [CrossRef] [EDP Sciences] [Google Scholar]
- Yoshino, A., & Yamauchi, C. 2014, MNRAS, 446, 3749 [Google Scholar]
Appendix A: Figures discussed in the text
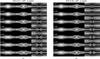 |
Fig. A.1 Same as Fig. 3, except that the inclination is fixed to i = 90°, and the viewing azimuth is varied. In the upper panels the bar is seen end-on (φ = 0°), and in the lowest panels side-on (φ = 90°). |
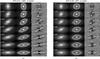 |
Fig. A.2 Same as Fig. A.1, except that the inclination is fixed to i = 60°. In the different panels the azimuthal angle φ varies. |
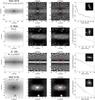 |
Fig. A.3 Four X-shaped galaxies: NGC 4216 has a prominent inner disk. The three other galaxies have the weakest X-shaped features in our sample. They are shown in the same format as Fig. 9, except that the deprojected images are not shown. The red cross in the right middle panel shows our measurement of the X-feature. |
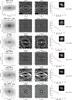 |
Fig. A.4 Three galaxy pairs, in which the parent galaxies of a barlens and an X-shape feature have similar morphologies: NGC 7179 (X) /NGC 5101 (bl), IC 1067 (X)/NGC 4643 (bl), and NGC 3673 (X)/NGC 2273 (bl). Because of the large galaxy inclination, the deprojected images for NGC 7179 and NGC 3673 are not shown. IC 1067 has both a barlens and an X-shaped feature. The format is the same as in Fig. 9. |
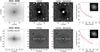 |
Fig. A.5 Our selection criterion for the unbarred galaxies: original images, unsharp mask images, and the surface brightness profiles for an unbarred (NGC 3599) and a barlens (NGC 4643) galaxy are compared. We note the similar central flux concentrations and the subsequent, nearly exponential subsections in their surface brightness profiles. The dotted vertical line in the profile of NGC 3599 marks the extent of the barlens-like structure. The dashed and full vertical lines in the profile of NGC 4643 show the sizes of the barlens and the bar, respectively. The same format is adopted as in Fig. 9. |
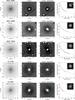 |
Fig. A.6 Selected sub-sample of the unbarred galaxies, representative of the surface brightness profiles and innermost morphologies in the unsharp mask images. The same format is adopted as in Fig. 9. The meaning of the dotted vertical line is the same as in Fig. A.5. |
Appendix B: Complete sample of 214 galaxies
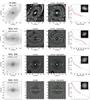 |
Fig. B.1 Strongly barred with a barlens blB. |
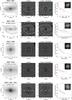 |
Fig. B.1 continued. |
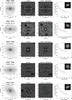 |
Fig. B.1 continued. |
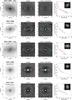 |
Fig. B.1 continued. |
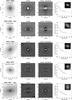 |
Fig. B.1 continued. |
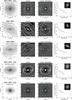 |
Fig. B.1 continued. |
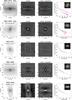 |
Fig. B.1 continued. |
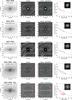 |
Fig. B.1 continued. |
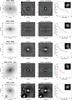 |
Fig. B.1 continued. |
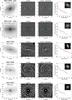 |
Fig. B.1 continued. |
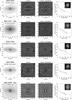 |
Fig. B.1 continued. |
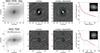 |
Fig. B.1 continued. |
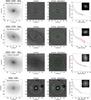 |
Fig. B.2 Weakly barred: a) barlens in the classification blAB, b) no barlens in the classification, but has a barlens-like, surface brightness profile (AB). |
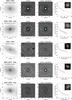 |
Fig. B.2 continued. |
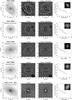 |
Fig. B.2 continued. |
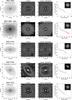 |
Fig. B.2 continued. |
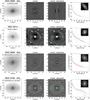 |
Fig. B.2 continued. |
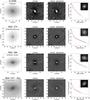 |
Fig. B.2 continued. |
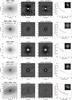 |
Fig. B.2 continued. |
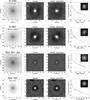 |
Fig. B.3 Non-barred: a) with an inner lens Al, b) no inner lens appears, but similar surface brightness profile as in a barlens (Aexpo). |
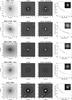 |
Fig. B.3 continued. |
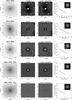 |
Fig. B.3 continued. |
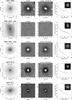 |
Fig. B.3 continued. |
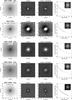 |
Fig. B.3 continued. |
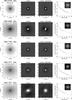 |
Fig. B.3 continued. |
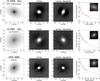 |
Fig. B.3 continued. |
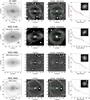 |
Fig. B.4 Classified as barlens. Also X-shape in unsharp mask bl−X. |
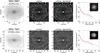 |
Fig. B.4 continued. |
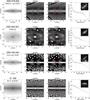 |
Fig. B.4 Bar with X-shape X. |
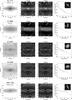 |
Fig. B.4 continued. |
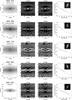 |
Fig. B.4 continued. |
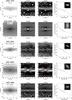 |
Fig. B.4 continued. |
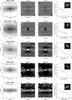 |
Fig. B.4 continued. |
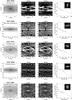 |
Fig. B.4 continued. |
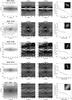 |
Fig. B.4 continued. |
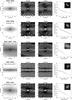 |
Fig. B.4 continued. |
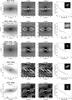 |
Fig. B.4 continued. |
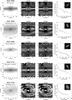 |
Fig. B.4 continued. |
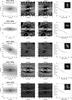 |
Fig. B.4 continued. |
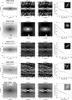 |
Fig. B.4 continued. |
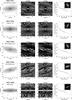 |
Fig. B.4 continued. |
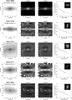 |
Fig. B.4 continued. |
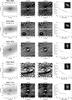 |
Fig. B.4 continued. |
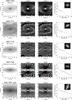 |
Fig. B.4 continued. |
 |
Fig. B.4 continued. |
Appendix C: Isophotal analysis of barlenses
Appendix D: Barlens groups
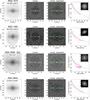 |
Fig. D.1 Barlens Group a. |
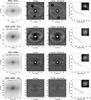 |
Fig. D.2 Barlens Group b. |
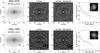 |
Fig. D.2 continued. |
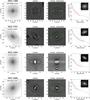 |
Fig. D.3 Barlens Group c. |
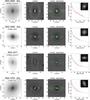 |
Fig. D.3 continued. |
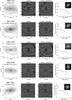 |
Fig. D.4 Barlens Group d. |
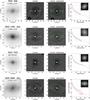 |
Fig. D.5 Barlens Group e: with strong bar (B). |
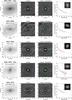 |
Fig. D.5 continued. |
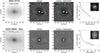 |
Fig. D.5 continued. |
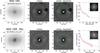 |
Fig. D.6 Barlens Group e: with weak bar (AB). |
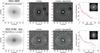 |
Fig. D.6 continued. |
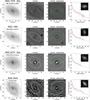 |
Fig. D.7 Barlens Group f. |
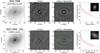 |
Fig. D.7 continued. |
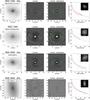 |
Fig. D.8 Barlens Group g. |
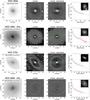 |
Fig. D.8 continued. |
Appendix E: Parent galaxy groups
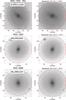 |
Fig. E.1 Parent galaxy Group 1a. S0−S0 /a, mainly S00. Weak thin bar. |
 |
Fig. E.1 continued. |
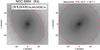 |
Fig. E.1 continued. |
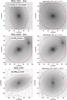 |
Fig. E.2 Parent galaxy Group 1b. S0−S0 /a, mainly S00. Thin bar dominated by ansae. |
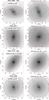 |
Fig. E.2 continued. |
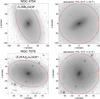 |
Fig. E.2 continued. |
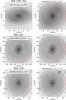 |
Fig. E.3 Parent galaxy Group 2. S0−S0 /a, mainly S0+. Growded inside the bar radius. |
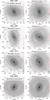 |
Fig. E.3 continued. |
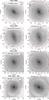 |
Fig. E.3 continued. |
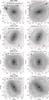 |
Fig. E.3 continued. |
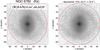 |
Fig. E.3 continued. |
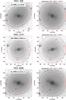 |
Fig. E.4 Parent galaxy Group 3. S0−S0 /a, mainly S0 /a. Bar ends to sharp features. |
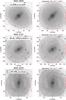 |
Fig. E.4 continued. |
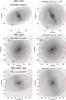 |
Fig. E.5 Parent galaxy Group 4. S0−Sab, mainly Sa. Bar ends to inner ring. |
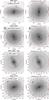 |
Fig. E.5 continued. |
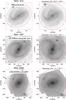 |
Fig. E.6 Parent galaxy Group 5. S0−Sb, mainly Sa, Sab. Open spirals, lens-like feature. |
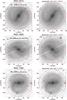 |
Fig. E.6 continued. |
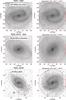 |
Fig. E.7 Parent galaxy Group 6 Sa−Sb. Bar ends to wounded spirals. |
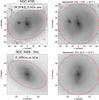 |
Fig. E.7 continued. |
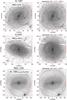 |
Fig. E.8 Parent galaxy Group 7 Sab−Sb. Inner ring, multiple arms. |
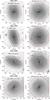 |
Fig. E.8 continued. |
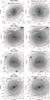 |
Fig. E.8 continued. |
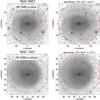 |
Fig. E.8 continued. |
Appendix F: Main galaxy sub-samples
Barlens galaxy sample.
Sample of galaxies with X-shape features.
Galaxies without barlenses or X-shaped features, mainly unbarred.
All Tables
Fractions of galaxies with various morphological features in the barlens groups a–g.
Cross-checking the parent galaxy (1–7) and barlens (a–g) groups for the galaxies in which both definitions exist.
All Figures
|
Fig. 1 NGC 3628 (upper panel) is used as an example to demonstrate how the sizes of the X-shapes are measured. The unsharp mask image (lower panel) is used, which is rotated so that the bar major axis appears horizontally. The extent of the feature is measured both along the bar direction and perpendicular to it, and the semilenghts are denoted by a and b, respectively. |
| In the text | |
|
Fig. 2 Synthetic images used in comparison with observations from the simulation with B/D = 0.08. The same simulation snapshot is viewed from 100 isotropically chosen directions. The labels in the frames indicate the viewing azimuth φ with respect to the bar major axis and the viewing inclination i. The line-of-nodes are horizontal. The simulation model is explained in Sect. 3.3. |
| In the text | |
|
Fig. 3 Snapshots of the simulation with a) B/D = 0.01 and b) with B/D = 0.08 are viewed at azimuthal angle φ = 90°, from five galaxy inclinations (i = 90° corresponds the side-on view of the bar). The line-of-node is horizontal. The left panels show the synthetic images, in the middle panel the isophotal contours, separated by 0.5 mags, are overlaid on the images, while the right panels show the unsharp mask images. |
| In the text | |
|
Fig. 4 Isophotal analysis performed for the barlens galaxy NGC 7079. In the upper panel the 3.6 μm image is shown in the sky plane with north up and east left: overlaid are the isophotal contours. The blue line indicates the bar length and orientation, and the green ellipse denotes the ellipse fit to the barlens. The four lower panels show the radial profiles from IRAF ellipse: the surface brightness μ (in mag arcsec-2; upper left panel), the position angle (PA; upper right panel), the ellipticity (ϵ; lower left panel), and the B4 parameter (lower right panel) as a function of semimajor axis. B4 is used as proxy for the boxiness: in the small panels, blue and red indicate the regions where B4< −0.005 and B4> 0.005, respectively. The green vertical full line shows the radius of the barlens, and the dashed blue line the bar radius (same colours are used on the contour plot). The labels in the upper right indicate the bar radius (rbar), the semimajor axis length of the barlens (abl), the mean and standard deviation of B4 in the region where the isophotal radius is (0.3–1.0) abl. A similar analysis has been carried out for all 84 barlens galaxies in our sample. |
| In the text | |
|
Fig. 5 Mean value of B4 parameter in the region of the barlens (isophotal radius in range (0.3–1.0) abl) is displayed as a function of galaxy inclination. The red and green symbols indicate galaxies that have been judged boxy and non-boxy based on visual inspection of the isophotes and the B4 profiles. The filled circles show the same parameter measured from the synthetic images for the simulation model with B/D = 0.08. The error bars in the observation points correspond to ± one standard deviation of B4 in the measurement region. |
| In the text | |
|
Fig. 6 Upper panel: the sizes (a) of barlenses and X-shape features are shown as a function of bar radius (rbar), given in arcseconds. All measurements are in the sky plane. For X-shapes the measurements are from the current study and for barlenses from Laurikainen et al. (2011) and HE+2016. Lower panel: the sizes of barlenses and X-shape features are normalized to the barlength and are drawn as a function of the parent stellar galaxy mass (M ∗), taken from the S4G Pipeline 3 (Muñoz-Mateos et al., 2015). The measured uncertainties are typically smaller than 0.5 arcsec. |
| In the text | |
|
Fig. 7 Distributions of the minor-to-major axis ratios (b/a) of barlenses (upper panel), both as measured in the sky plane and after deprojection onto the disk plane. The lower panel shows the b/a ratio for the X-shapes (in the sky plane). |
| In the text | |
|
Fig. 8 Normalized sizes (a/rbar) and the minor-to-major axis ratios (b/a) of barlenses and X-shaped features of the galaxies are plotted as a function of parent galaxy inclination (left panels). The same parameters for the synthetic images are also shown (right panels). The simulations with a small (B/D = 0.01) and a large bulge (B/D = 0.08) are shown with different symbols. The arrows in the two panels use the model with B/D = 0.08, indicating the normalized barlens size in face-on view (green arrow in the left), and the size of the X-shape when the same model is observed edge-on (red arrow in the right). The measured uncertainties are typically smaller than 0.5 arcsec. |
| In the text | |
|
Fig. 9 Barlens groups a–d, as explained in Sect. 6.1. The left panels show the 3.6 μm images and the two middle panels the observed (left) and deprojected (right) unsharp mask images. The images are cut to show only the bar region, and the bar is always aligned horizontally. The green circles show the barlenses. In the right panels the surface brightness profiles are shown. The black lines are the isophotal profiles from IRAF ellipse, and the profile cuts along the bar major (blue line) and minor axis (red dashed line) are shown separately in the same panel. However, when the galaxy inclination is larger than 65°, only the major axis profile is shown. The small panels in the upper corners show the images in full size and with the original orientations in the sky. The vertical full and dashed lines indicate the sizes of barlenses and bars, respectively. The red portion of the surface brightness profile indicates the range of the unsharp mask image. For NIRS0S, Ks is shown instead of the 3.6 μm image; this is indicated in the label of the leftmost frame. |
| In the text | |
|
Fig. 10 Barlens groups e–g, as explained in Sect. 6.1. The format of the figure is the same as in Fig. 9. |
| In the text | |
|
Fig. 11 Parent galaxy groups as defined in Sect. 6.2. The galaxies are shown both in the sky (left panels) and when deprojected onto disk plane (right panels). The red ellipse indicates the orientation of the outer disk; this corresponds to the circle in the deprojected image. The images are 3.6 μm images, unless indicated by Ks after the galaxy name. |
| In the text | |
|
Fig. 12 Sizes of barlenses in barred galaxies (green boxes) and in barlens-like structure components in unbarred galaxies (blue stars), plotted as a function of galaxy stellar mass (M∗). The semimajor-axis lengths are given in kpc. |
| In the text | |
|
Fig. 13 Number histograms of the parent galaxy stellar masses (M∗), Hubble stages (T), and bulge-to-total flux ratios (B/T, taken from S4G Pipeline 4, Salo et al. (2015), are shown separately for barlenses and X-shape features in our samples. In this plot we show only galaxies at i = 45°–60°. |
| In the text | |
|
Fig. 14 Five simulation models from Salo & Laurikainen (2016) are shown at five different galaxy inclinations. The models differ in the bulge-to-disk mass ratio, which varies from B/D = 0.01 to B/D = 0.16. The labels in the frames for i = 30°–75° indicate the mean and standard deviation of B4 for the B/P/X/bl feature, measured from the region between the two marked isophotes. |
| In the text | |
|
Fig. 15 Two galaxies in our sample, NGC 5701 and NGC 7552, which have detailed stellar population analysis in the literature. The two galaxies are in an almost face-on view, for which reason the deprojected image is almost the same as the non-deprojected image. The format is the same as in Fig. 9. |
| In the text | |
|
Fig. A.1 Same as Fig. 3, except that the inclination is fixed to i = 90°, and the viewing azimuth is varied. In the upper panels the bar is seen end-on (φ = 0°), and in the lowest panels side-on (φ = 90°). |
| In the text | |
|
Fig. A.2 Same as Fig. A.1, except that the inclination is fixed to i = 60°. In the different panels the azimuthal angle φ varies. |
| In the text | |
|
Fig. A.3 Four X-shaped galaxies: NGC 4216 has a prominent inner disk. The three other galaxies have the weakest X-shaped features in our sample. They are shown in the same format as Fig. 9, except that the deprojected images are not shown. The red cross in the right middle panel shows our measurement of the X-feature. |
| In the text | |
|
Fig. A.4 Three galaxy pairs, in which the parent galaxies of a barlens and an X-shape feature have similar morphologies: NGC 7179 (X) /NGC 5101 (bl), IC 1067 (X)/NGC 4643 (bl), and NGC 3673 (X)/NGC 2273 (bl). Because of the large galaxy inclination, the deprojected images for NGC 7179 and NGC 3673 are not shown. IC 1067 has both a barlens and an X-shaped feature. The format is the same as in Fig. 9. |
| In the text | |
|
Fig. A.5 Our selection criterion for the unbarred galaxies: original images, unsharp mask images, and the surface brightness profiles for an unbarred (NGC 3599) and a barlens (NGC 4643) galaxy are compared. We note the similar central flux concentrations and the subsequent, nearly exponential subsections in their surface brightness profiles. The dotted vertical line in the profile of NGC 3599 marks the extent of the barlens-like structure. The dashed and full vertical lines in the profile of NGC 4643 show the sizes of the barlens and the bar, respectively. The same format is adopted as in Fig. 9. |
| In the text | |
|
Fig. A.6 Selected sub-sample of the unbarred galaxies, representative of the surface brightness profiles and innermost morphologies in the unsharp mask images. The same format is adopted as in Fig. 9. The meaning of the dotted vertical line is the same as in Fig. A.5. |
| In the text | |
|
Fig. B.1 Strongly barred with a barlens blB. |
| In the text | |
|
Fig. B.1 continued. |
| In the text | |
|
Fig. B.1 continued. |
| In the text | |
|
Fig. B.1 continued. |
| In the text | |
|
Fig. B.1 continued. |
| In the text | |
|
Fig. B.1 continued. |
| In the text | |
|
Fig. B.1 continued. |
| In the text | |
|
Fig. B.1 continued. |
| In the text | |
|
Fig. B.1 continued. |
| In the text | |
|
Fig. B.1 continued. |
| In the text | |
|
Fig. B.1 continued. |
| In the text | |
|
Fig. B.1 continued. |
| In the text | |
|
Fig. B.2 Weakly barred: a) barlens in the classification blAB, b) no barlens in the classification, but has a barlens-like, surface brightness profile (AB). |
| In the text | |
|
Fig. B.2 continued. |
| In the text | |
|
Fig. B.2 continued. |
| In the text | |
|
Fig. B.2 continued. |
| In the text | |
|
Fig. B.2 continued. |
| In the text | |
|
Fig. B.2 continued. |
| In the text | |
|
Fig. B.2 continued. |
| In the text | |
|
Fig. B.3 Non-barred: a) with an inner lens Al, b) no inner lens appears, but similar surface brightness profile as in a barlens (Aexpo). |
| In the text | |
|
Fig. B.3 continued. |
| In the text | |
|
Fig. B.3 continued. |
| In the text | |
|
Fig. B.3 continued. |
| In the text | |
|
Fig. B.3 continued. |
| In the text | |
|
Fig. B.3 continued. |
| In the text | |
|
Fig. B.3 continued. |
| In the text | |
|
Fig. B.4 Classified as barlens. Also X-shape in unsharp mask bl−X. |
| In the text | |
|
Fig. B.4 continued. |
| In the text | |
|
Fig. B.4 Bar with X-shape X. |
| In the text | |
|
Fig. B.4 continued. |
| In the text | |
|
Fig. B.4 continued. |
| In the text | |
|
Fig. B.4 continued. |
| In the text | |
|
Fig. B.4 continued. |
| In the text | |
|
Fig. B.4 continued. |
| In the text | |
|
Fig. B.4 continued. |
| In the text | |
|
Fig. B.4 continued. |
| In the text | |
|
Fig. B.4 continued. |
| In the text | |
|
Fig. B.4 continued. |
| In the text | |
|
Fig. B.4 continued. |
| In the text | |
|
Fig. B.4 continued. |
| In the text | |
|
Fig. B.4 continued. |
| In the text | |
|
Fig. B.4 continued. |
| In the text | |
|
Fig. B.4 continued. |
| In the text | |
|
Fig. B.4 continued. |
| In the text | |
|
Fig. B.4 continued. |
| In the text | |
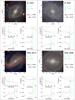 |
Fig. C.1 See caption of Fig. 4. |
| In the text | |
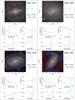 |
Fig. C.2 See caption of Fig. 4. |
| In the text | |
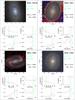 |
Fig. C.3 See caption of Fig. 4. |
| In the text | |
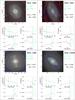 |
Fig. C.4 See caption of Fig. 4. |
| In the text | |
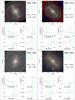 |
Fig. C.5 See caption of Fig. 4. |
| In the text | |
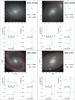 |
Fig. C.6 See caption of Fig. 4. |
| In the text | |
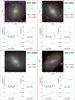 |
Fig. C.7 See caption of Fig. 4. |
| In the text | |
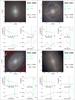 |
Fig. C.8 See caption of Fig. 4. |
| In the text | |
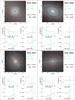 |
Fig. C.9 See caption of Fig. 4. |
| In the text | |
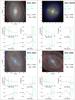 |
Fig. C.10 See caption of Fig. 4. |
| In the text | |
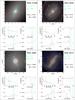 |
Fig. C.11 See caption of Fig. 4. |
| In the text | |
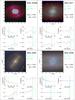 |
Fig. C.12 See caption of Fig. 4. |
| In the text | |
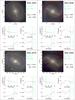 |
Fig. C.13 See caption of Fig. 4. |
| In the text | |
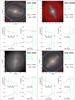 |
Fig. C.14 See caption of Fig. 4. |
| In the text | |
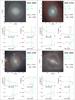 |
Fig. C.15 See caption of Fig. 4. |
| In the text | |
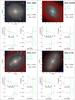 |
Fig. C.16 See caption of Fig. 4. |
| In the text | |
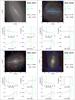 |
Fig. C.17 See caption of Fig. 4. |
| In the text | |
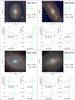 |
Fig. C.18 See caption of Fig. 4. |
| In the text | |
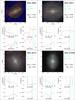 |
Fig. C.19 See caption of Fig. 4. |
| In the text | |
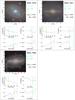 |
Fig. C.20 See caption of Fig. 4. |
| In the text | |
|
Fig. D.1 Barlens Group a. |
| In the text | |
|
Fig. D.2 Barlens Group b. |
| In the text | |
|
Fig. D.2 continued. |
| In the text | |
|
Fig. D.3 Barlens Group c. |
| In the text | |
|
Fig. D.3 continued. |
| In the text | |
|
Fig. D.4 Barlens Group d. |
| In the text | |
|
Fig. D.5 Barlens Group e: with strong bar (B). |
| In the text | |
|
Fig. D.5 continued. |
| In the text | |
|
Fig. D.5 continued. |
| In the text | |
|
Fig. D.6 Barlens Group e: with weak bar (AB). |
| In the text | |
|
Fig. D.6 continued. |
| In the text | |
|
Fig. D.7 Barlens Group f. |
| In the text | |
|
Fig. D.7 continued. |
| In the text | |
|
Fig. D.8 Barlens Group g. |
| In the text | |
|
Fig. D.8 continued. |
| In the text | |
|
Fig. E.1 Parent galaxy Group 1a. S0−S0 /a, mainly S00. Weak thin bar. |
| In the text | |
|
Fig. E.1 continued. |
| In the text | |
|
Fig. E.1 continued. |
| In the text | |
|
Fig. E.2 Parent galaxy Group 1b. S0−S0 /a, mainly S00. Thin bar dominated by ansae. |
| In the text | |
|
Fig. E.2 continued. |
| In the text | |
|
Fig. E.2 continued. |
| In the text | |
|
Fig. E.3 Parent galaxy Group 2. S0−S0 /a, mainly S0+. Growded inside the bar radius. |
| In the text | |
|
Fig. E.3 continued. |
| In the text | |
|
Fig. E.3 continued. |
| In the text | |
|
Fig. E.3 continued. |
| In the text | |
|
Fig. E.3 continued. |
| In the text | |
|
Fig. E.4 Parent galaxy Group 3. S0−S0 /a, mainly S0 /a. Bar ends to sharp features. |
| In the text | |
|
Fig. E.4 continued. |
| In the text | |
|
Fig. E.5 Parent galaxy Group 4. S0−Sab, mainly Sa. Bar ends to inner ring. |
| In the text | |
|
Fig. E.5 continued. |
| In the text | |
|
Fig. E.6 Parent galaxy Group 5. S0−Sb, mainly Sa, Sab. Open spirals, lens-like feature. |
| In the text | |
|
Fig. E.6 continued. |
| In the text | |
|
Fig. E.7 Parent galaxy Group 6 Sa−Sb. Bar ends to wounded spirals. |
| In the text | |
|
Fig. E.7 continued. |
| In the text | |
|
Fig. E.8 Parent galaxy Group 7 Sab−Sb. Inner ring, multiple arms. |
| In the text | |
|
Fig. E.8 continued. |
| In the text | |
|
Fig. E.8 continued. |
| In the text | |
|
Fig. E.8 continued. |
| In the text | |
Current usage metrics show cumulative count of Article Views (full-text article views including HTML views, PDF and ePub downloads, according to the available data) and Abstracts Views on Vision4Press platform.
Data correspond to usage on the plateform after 2015. The current usage metrics is available 48-96 hours after online publication and is updated daily on week days.
Initial download of the metrics may take a while.