Free Access
Fig. 13
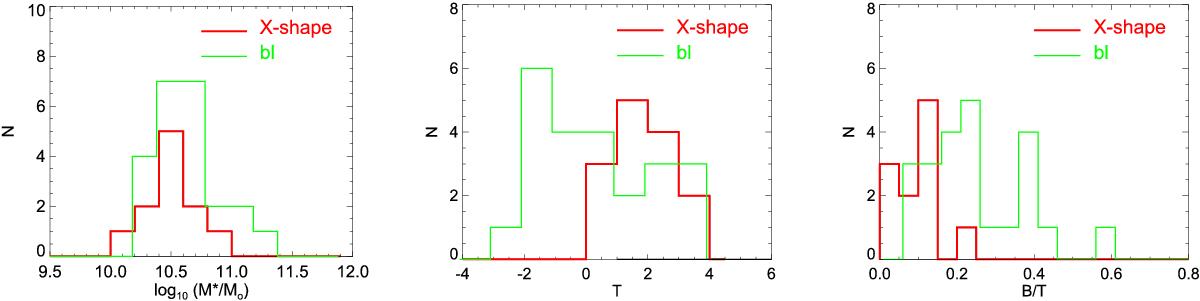
Number histograms of the parent galaxy stellar masses (M∗), Hubble stages (T), and bulge-to-total flux ratios (B/T, taken from S4G Pipeline 4, Salo et al. (2015), are shown separately for barlenses and X-shape features in our samples. In this plot we show only galaxies at i = 45°–60°.
Current usage metrics show cumulative count of Article Views (full-text article views including HTML views, PDF and ePub downloads, according to the available data) and Abstracts Views on Vision4Press platform.
Data correspond to usage on the plateform after 2015. The current usage metrics is available 48-96 hours after online publication and is updated daily on week days.
Initial download of the metrics may take a while.