Fig. 9
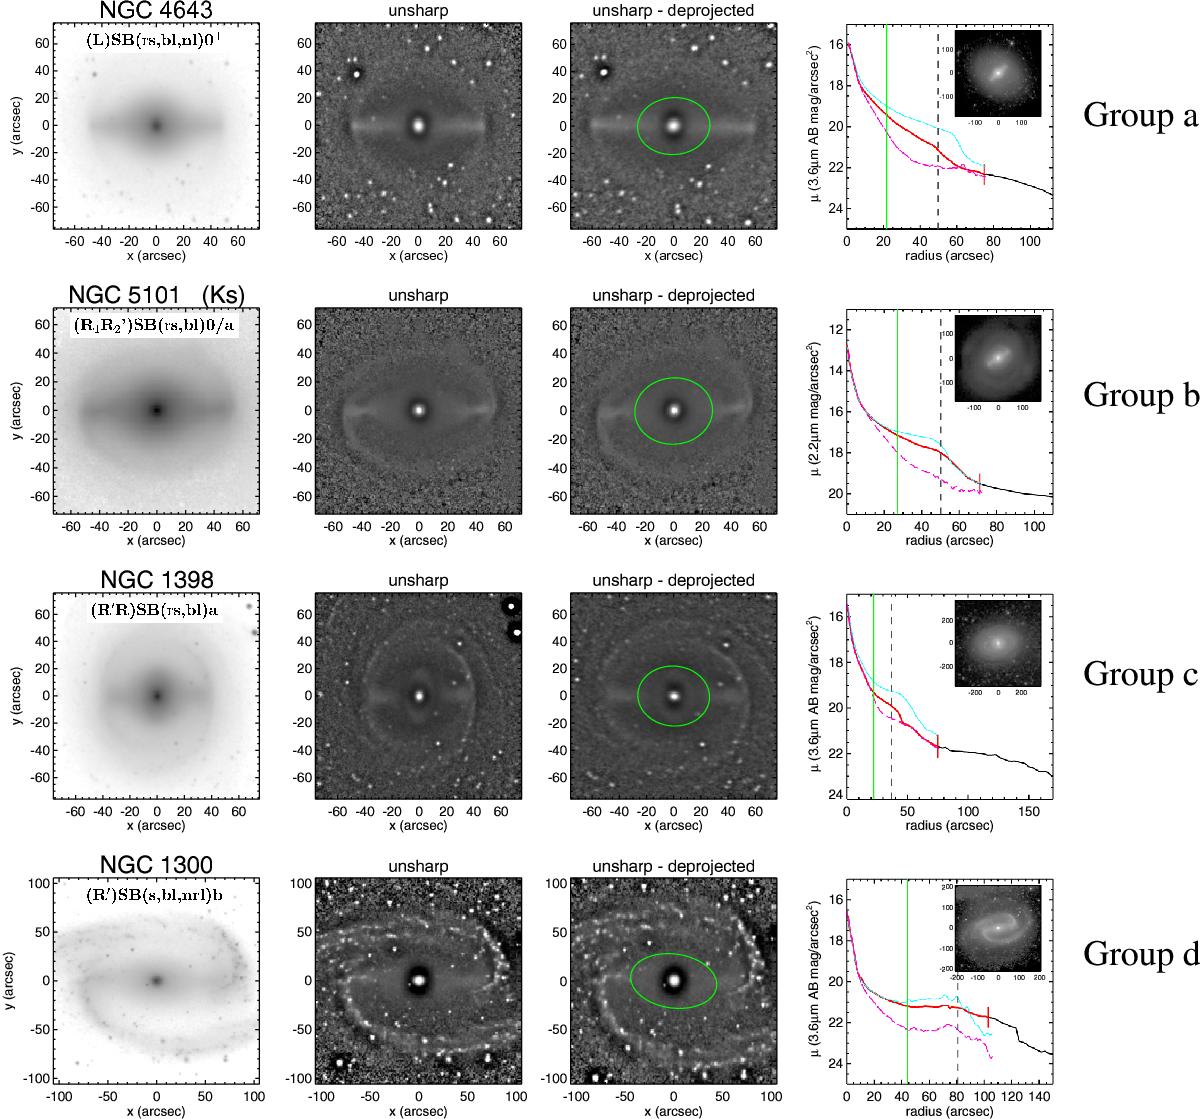
Barlens groups a–d, as explained in Sect. 6.1. The left panels show the 3.6 μm images and the two middle panels the observed (left) and deprojected (right) unsharp mask images. The images are cut to show only the bar region, and the bar is always aligned horizontally. The green circles show the barlenses. In the right panels the surface brightness profiles are shown. The black lines are the isophotal profiles from IRAF ellipse, and the profile cuts along the bar major (blue line) and minor axis (red dashed line) are shown separately in the same panel. However, when the galaxy inclination is larger than 65°, only the major axis profile is shown. The small panels in the upper corners show the images in full size and with the original orientations in the sky. The vertical full and dashed lines indicate the sizes of barlenses and bars, respectively. The red portion of the surface brightness profile indicates the range of the unsharp mask image. For NIRS0S, Ks is shown instead of the 3.6 μm image; this is indicated in the label of the leftmost frame.
Current usage metrics show cumulative count of Article Views (full-text article views including HTML views, PDF and ePub downloads, according to the available data) and Abstracts Views on Vision4Press platform.
Data correspond to usage on the plateform after 2015. The current usage metrics is available 48-96 hours after online publication and is updated daily on week days.
Initial download of the metrics may take a while.