Fig. 14
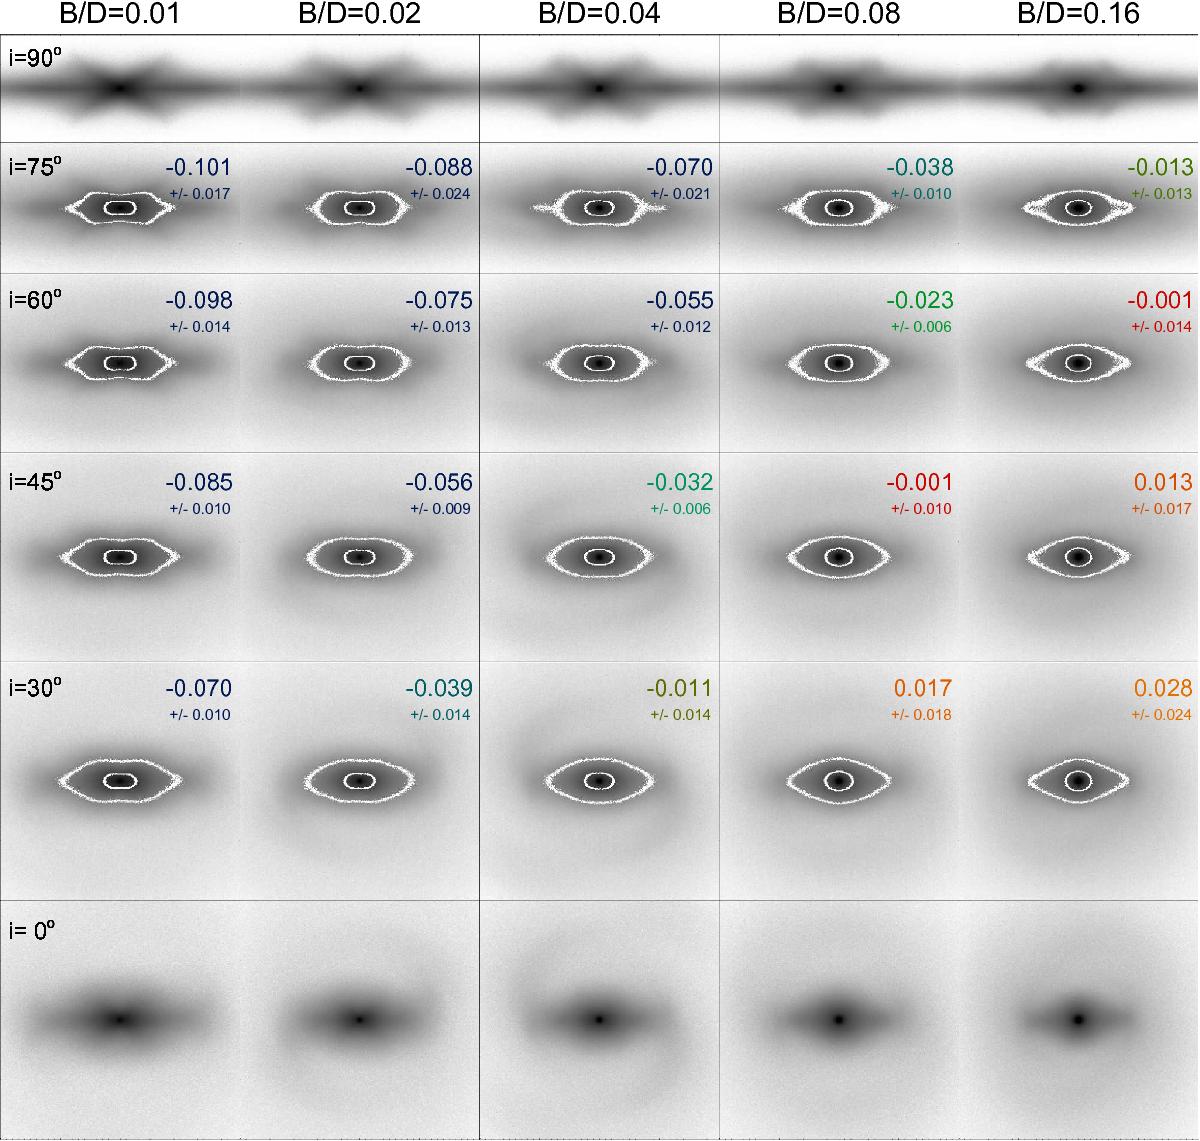
Five simulation models from Salo & Laurikainen (2016) are shown at five different galaxy inclinations. The models differ in the bulge-to-disk mass ratio, which varies from B/D = 0.01 to B/D = 0.16. The labels in the frames for i = 30°–75° indicate the mean and standard deviation of B4 for the B/P/X/bl feature, measured from the region between the two marked isophotes.
Current usage metrics show cumulative count of Article Views (full-text article views including HTML views, PDF and ePub downloads, according to the available data) and Abstracts Views on Vision4Press platform.
Data correspond to usage on the plateform after 2015. The current usage metrics is available 48-96 hours after online publication and is updated daily on week days.
Initial download of the metrics may take a while.