Fig. 4
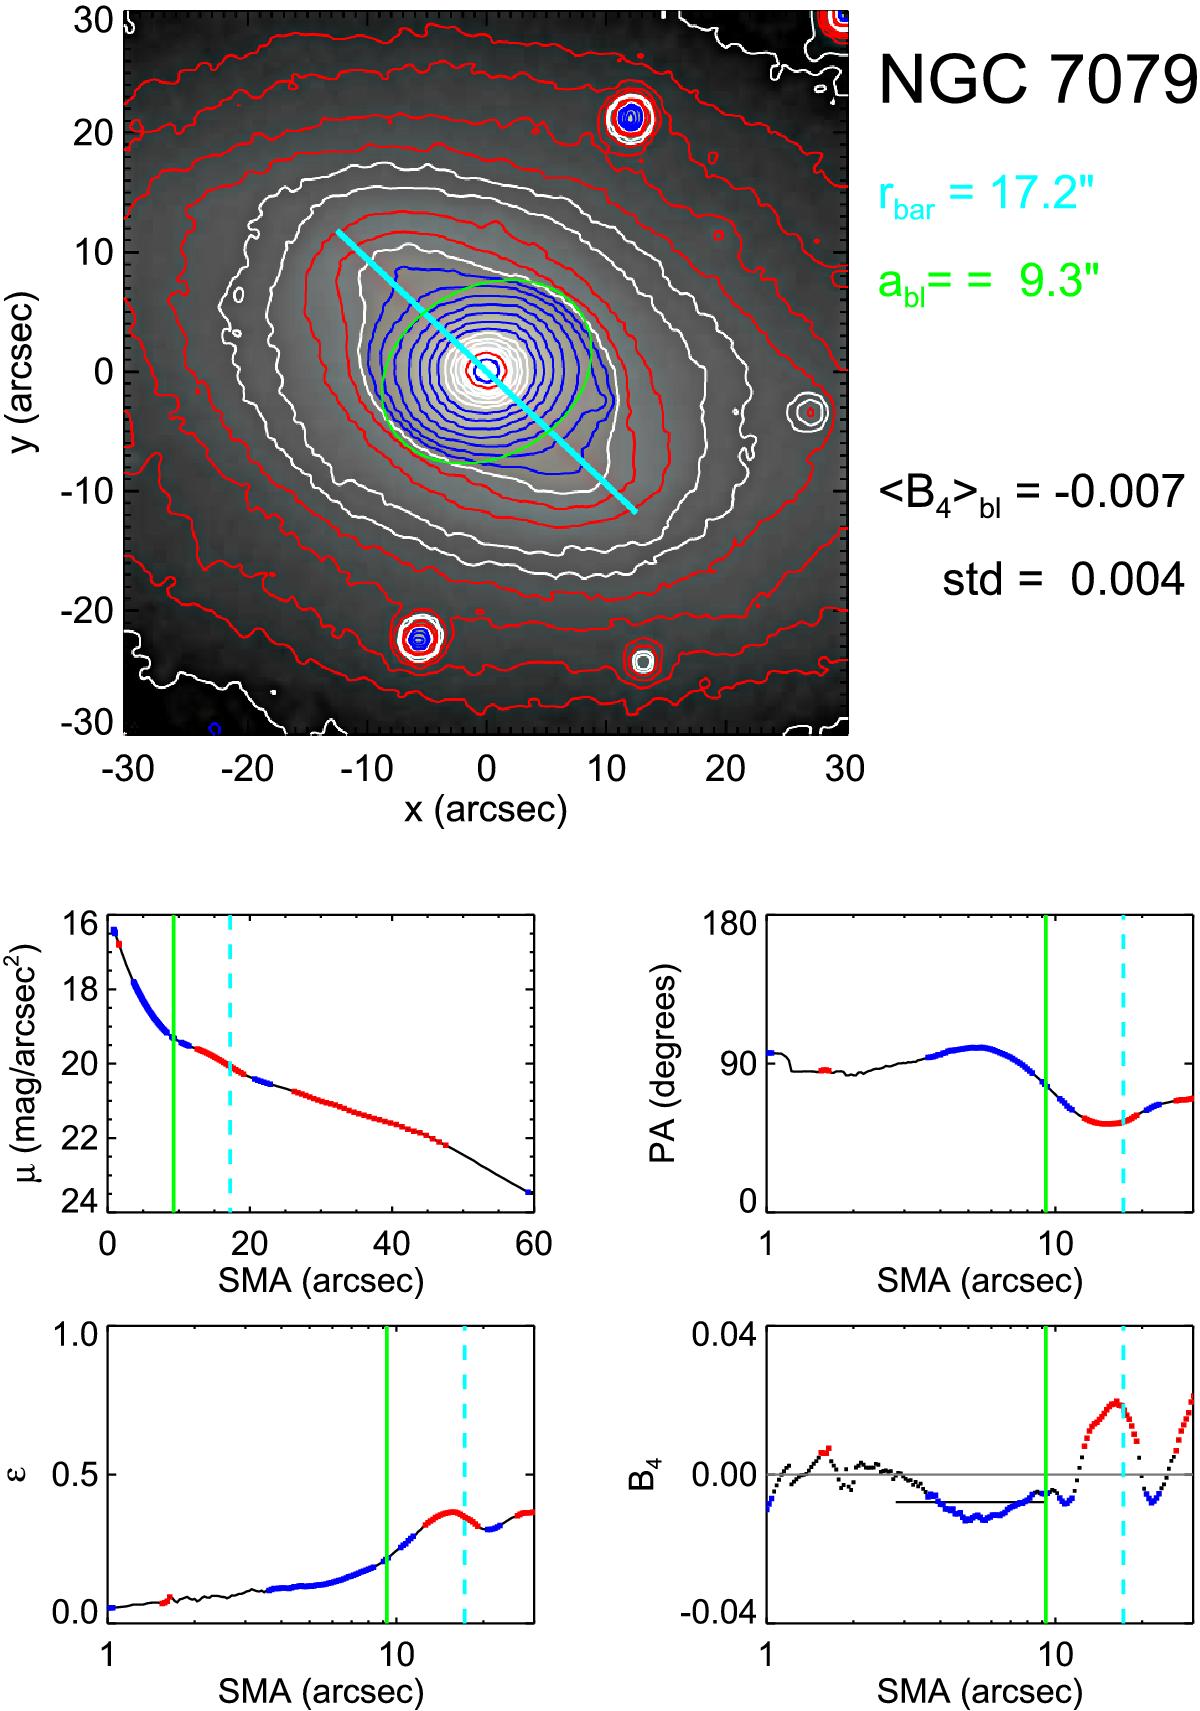
Isophotal analysis performed for the barlens galaxy NGC 7079. In the upper panel the 3.6 μm image is shown in the sky plane with north up and east left: overlaid are the isophotal contours. The blue line indicates the bar length and orientation, and the green ellipse denotes the ellipse fit to the barlens. The four lower panels show the radial profiles from IRAF ellipse: the surface brightness μ (in mag arcsec-2; upper left panel), the position angle (PA; upper right panel), the ellipticity (ϵ; lower left panel), and the B4 parameter (lower right panel) as a function of semimajor axis. B4 is used as proxy for the boxiness: in the small panels, blue and red indicate the regions where B4< −0.005 and B4> 0.005, respectively. The green vertical full line shows the radius of the barlens, and the dashed blue line the bar radius (same colours are used on the contour plot). The labels in the upper right indicate the bar radius (rbar), the semimajor axis length of the barlens (abl), the mean and standard deviation of B4 in the region where the isophotal radius is (0.3–1.0) abl. A similar analysis has been carried out for all 84 barlens galaxies in our sample.
Current usage metrics show cumulative count of Article Views (full-text article views including HTML views, PDF and ePub downloads, according to the available data) and Abstracts Views on Vision4Press platform.
Data correspond to usage on the plateform after 2015. The current usage metrics is available 48-96 hours after online publication and is updated daily on week days.
Initial download of the metrics may take a while.