Fig. 3
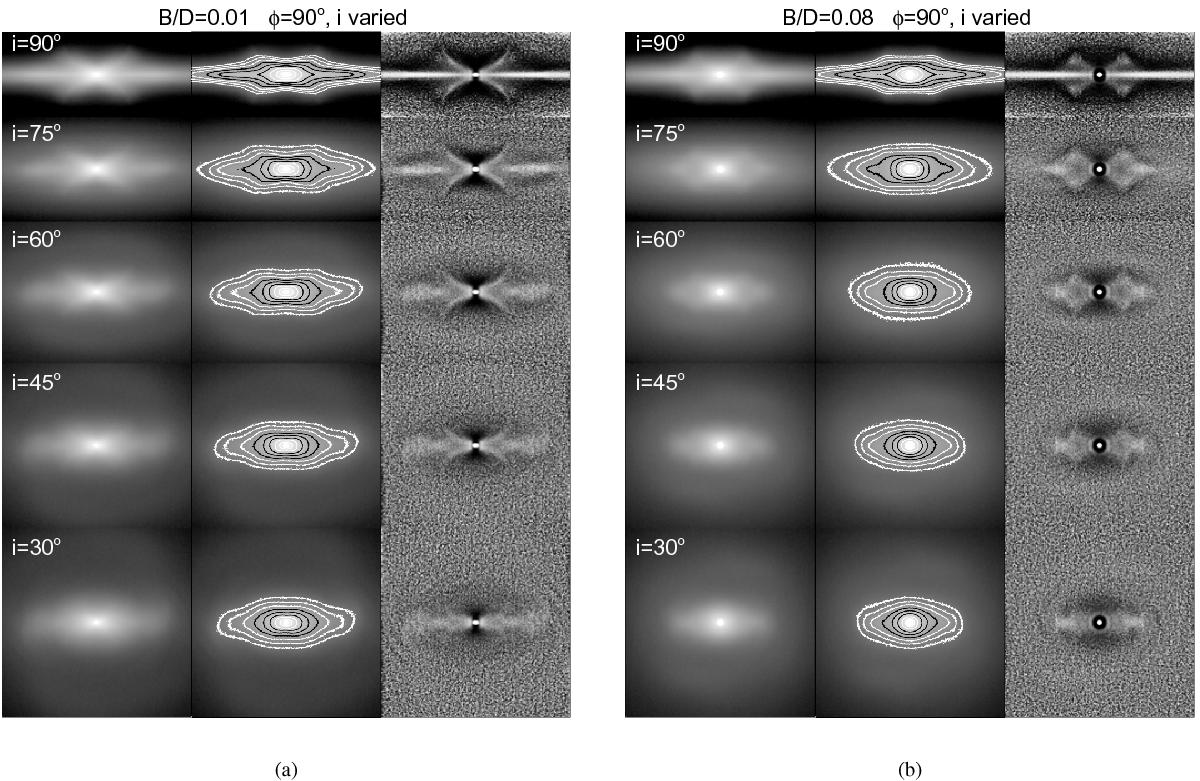
Snapshots of the simulation with a) B/D = 0.01 and b) with B/D = 0.08 are viewed at azimuthal angle φ = 90°, from five galaxy inclinations (i = 90° corresponds the side-on view of the bar). The line-of-node is horizontal. The left panels show the synthetic images, in the middle panel the isophotal contours, separated by 0.5 mags, are overlaid on the images, while the right panels show the unsharp mask images.
Current usage metrics show cumulative count of Article Views (full-text article views including HTML views, PDF and ePub downloads, according to the available data) and Abstracts Views on Vision4Press platform.
Data correspond to usage on the plateform after 2015. The current usage metrics is available 48-96 hours after online publication and is updated daily on week days.
Initial download of the metrics may take a while.