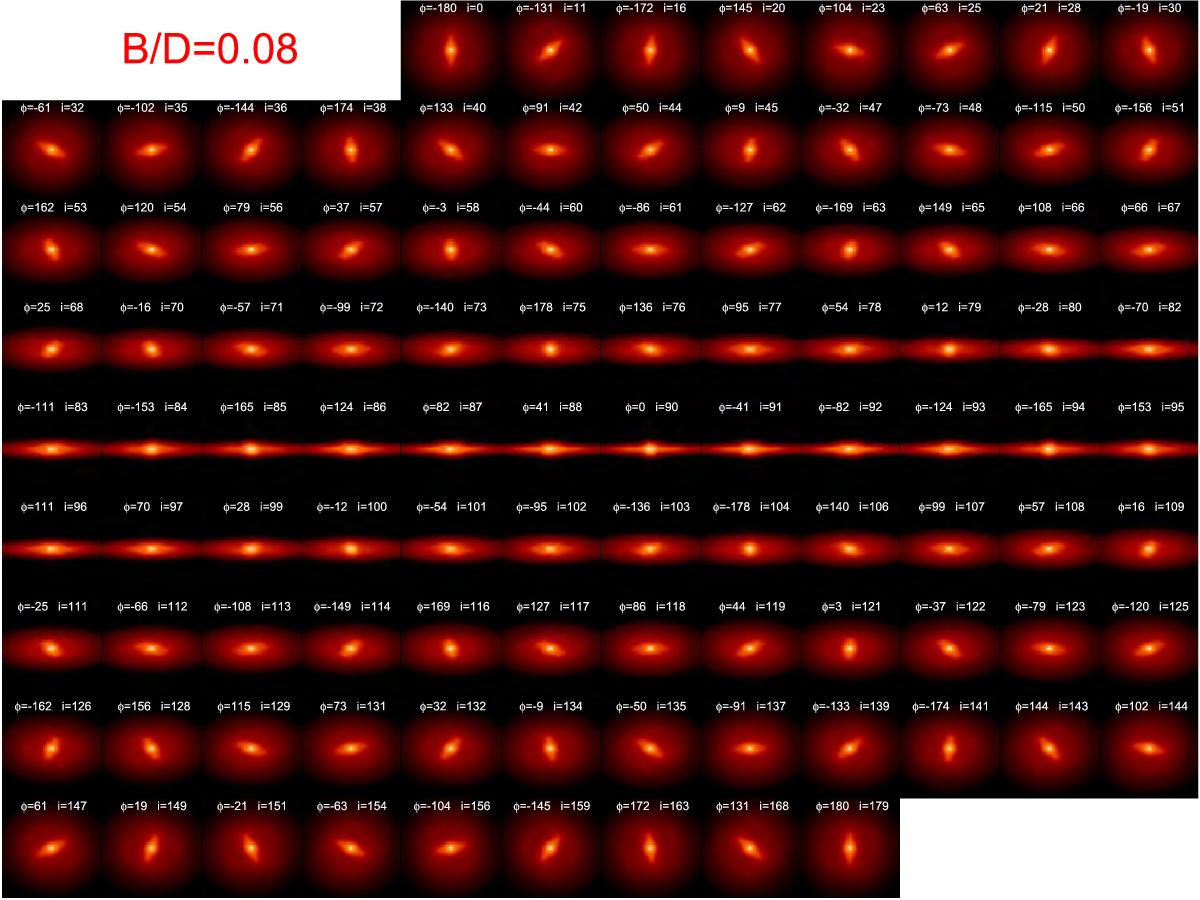
Fig. 2

Synthetic images used in comparison with observations from the simulation with B/D = 0.08. The same simulation snapshot is viewed from 100 isotropically chosen directions. The labels in the frames indicate the viewing azimuth φ with respect to the bar major axis and the viewing inclination i. The line-of-nodes are horizontal. The simulation model is explained in Sect. 3.3.
Current usage metrics show cumulative count of Article Views (full-text article views including HTML views, PDF and ePub downloads, according to the available data) and Abstracts Views on Vision4Press platform.
Data correspond to usage on the plateform after 2015. The current usage metrics is available 48-96 hours after online publication and is updated daily on week days.
Initial download of the metrics may take a while.


