Fig. 5
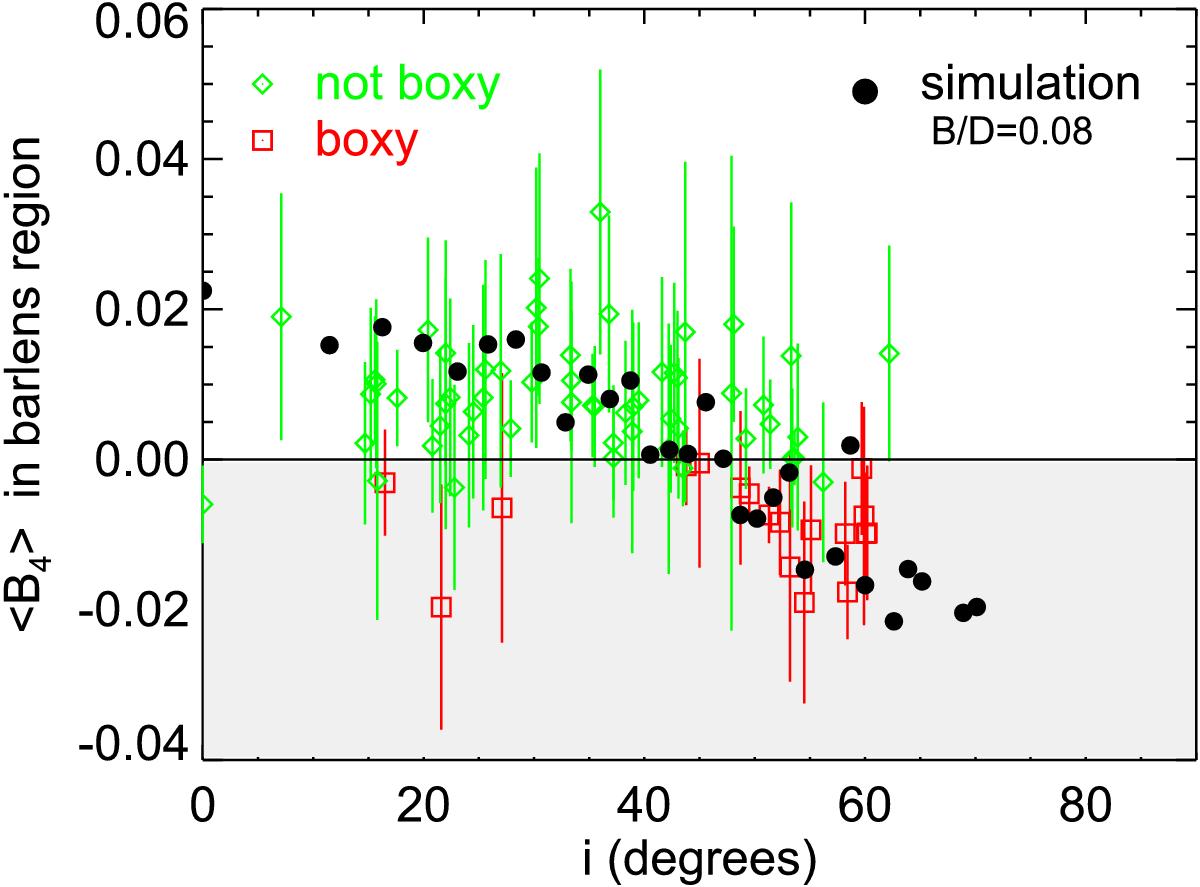
Mean value of B4 parameter in the region of the barlens (isophotal radius in range (0.3–1.0) abl) is displayed as a function of galaxy inclination. The red and green symbols indicate galaxies that have been judged boxy and non-boxy based on visual inspection of the isophotes and the B4 profiles. The filled circles show the same parameter measured from the synthetic images for the simulation model with B/D = 0.08. The error bars in the observation points correspond to ± one standard deviation of B4 in the measurement region.
Current usage metrics show cumulative count of Article Views (full-text article views including HTML views, PDF and ePub downloads, according to the available data) and Abstracts Views on Vision4Press platform.
Data correspond to usage on the plateform after 2015. The current usage metrics is available 48-96 hours after online publication and is updated daily on week days.
Initial download of the metrics may take a while.