| Issue |
A&A
Volume 595, November 2016
|
|
|---|---|---|
| Article Number | A80 | |
| Number of page(s) | 23 | |
| Section | Extragalactic astronomy | |
| DOI | https://doi.org/10.1051/0004-6361/201628160 | |
| Published online | 03 November 2016 | |
Submillimeter H2O and H2O+emission in lensed ultra- and hyper-luminous infrared galaxies at z ~ 2–4 ⋆,⋆⋆
1 Purple Mountain Observatory/Key Lab of Radio Astronomy, Chinese Academy of Sciences, 210008 Nanjing, PR China
e-mail: This email address is being protected from spambots. You need JavaScript enabled to view it.
2 Institut d’Astrophysique Spatiale, CNRS, Univ. Paris-Sud, Université Paris-Saclay, Bât. 121, 91405 Orsay Cedex, France
3 Graduate University of the Chinese Academy of Sciences, 19A Yuquan Road, Shijingshan District, 10049 Beijing, PR China
4 CNRS, UMR 7095, Institut d'Astrophysique de Paris, 75014 Paris, France
5 UPMC Univ. Paris 06, UMR 7095, Institut d’Astrophysique de Paris, 75014 Paris, France
6 Universidad de Alcalá, Departamento de Fisica y Matemáticas, Campus Universitario, 28871 Alcalá de Henares, Madrid, Spain
7 Institut de Radioastronomie Millimétrique (IRAM), 300 rue de la Piscine, 38406 Saint-Martin-d’ Hères, France
8 Leiden Observatory, Leiden University, PO Box 9513, 2300 RA Leiden, The Netherlands
9 Max Planck Institut für Radioastronomie, Auf dem Hgel 69, 53121 Bonn, Germany
10 Department of Earth and Space Sciences, Chalmers University of Technology, Onsala Space Observatory, 43992 Onsala, Sweden
11 Department of Physics and Astronomy, Rutgers, The State University of New Jersey, 136 Frelinghuysen Road, Piscataway, NJ 08854-8019, USA
12 Astronomy Department, Cornell University, 220 Space Sciences Building, Ithaca, NY 14853, USA
13 Department of Physics and Astronomy, University of California, Irvine, Irvine, CA 92697, USA
14 Joint ALMA Observatory, 3107 Alonso de Córdova, Vitacura, Santiago, Chile
15 Universitat Wien, Institut für Astrophysik, Türkenschanzstrasse 17, 1180 Wien, Austria
16 School of Physics and Astronomy, University of Nottingham, University Park, Nottingham NG7 2RD, UK
17 Institute for Astronomy, University of Edinburgh, Royal Observatory, Blackford Hill, Edinburgh, EH9 3HJ, UK
18 European Southern Observatory, Karl Schwarzschild Straße 2, 85748 Garching, Germany
19 Kapteyn Astronomical Institute, University of Groningen, 9700 AV Groningen, The Netherlands
20 School of Physics and Astronomy, Cardiff University, The Parade, Cardiff CF24 3AA, UK
Received: 19 January 2016
Accepted: 20 July 2016
Abstract
We report rest-frame submillimeter H2O emission line observations of 11 ultra- or hyper-luminous infrared galaxies (ULIRGs or HyLIRGs) at z ~ 2–4 selected among the brightest lensed galaxies discovered in the Herschel-Astrophysical Terahertz Large Area Survey (H-ATLAS). Using the IRAM NOrthern Extended Millimeter Array (NOEMA), we have detected 14 new H2O emission lines. These include five 321–312ortho-H2O lines (Eup/k = 305 K) and nine J = 2 para-H2O lines, either 202–111(Eup/k = 101 K) or 211–202(Eup/k = 137 K). The apparent luminosities of the H2O emission lines are μLH2O ~ 6–21 × 108 L⊙ (3 <μ< 15, where μ is the lens magnification factor), with velocity-integrated line fluxes ranging from 4–15 Jy km s-1. We have also observed CO emission lines using EMIR on the IRAM 30 m telescope in seven sources (most of those have not yet had their CO emission lines observed). The velocity widths for CO and H2O lines are found to be similar, generally within 1σ errors in the same source. With almost comparable integrated flux densities to those of the high-J CO line (ratios range from 0.4 to 1.1), H2O is found to be among the strongest molecular emitters in high-redshift Hy/ULIRGs. We also confirm our previously found correlation between luminosity of H2O (LH2O) and infrared (LIR) that LH2O ~ LIR1.1–1.2, with ournew detections. This correlation could be explained by a dominant role of far-infrared pumping in the H2O excitation. Modelling reveals that the far-infrared radiation fields have warm dust temperature Twarm ~ 45–75 K, H2O column density per unit velocity interval NH2O /ΔV ≳ 0.3 × 1015 cm-2 km-1 s and 100 μm continuum opacity τ100> 1 (optically thick), indicating that H2O is likely to trace highly obscured warm dense gas. However, further observations of J ≥ 4 H2O lines are needed to better constrain the continuum optical depth and other physical conditions of the molecular gas and dust. We have also detected H2O+ emission in three sources. A tight correlation between LH2O and LH2O+ has been found in galaxies from low to high redshift. The velocity-integrated flux density ratio between H2O+ and H2O suggests that cosmic rays generated by strong star formation are possibly driving the H2O+ formation.
Key words: galaxies: high-redshift / galaxies: ISM / infrared: galaxies / submillimeter: galaxies / radio lines: ISM / ISM: molecules
Herschel is an ESA space observatory with science instruments provided by European-led Principal Investigator consortia and with important participation from NASA.
The reduced spectra as FITS files are only available at the CDS via anonymous ftp to cdsarc.u-strasbg.fr (130.79.128.5) or via http://cdsarc.u-strasbg.fr/viz-bin/qcat?J/A+A/595/A80
© ESO, 2016
1. Introduction
After molecular hydrogen (H2) and carbon monoxide (CO), the water molecule (H2O) can be one of the most abundant molecules in the interstellar medium (ISM) in galaxies. It provides some important diagnostic tools for various physical and chemical processes in the ISM (e.g. van Dishoeck et al. 2013, and references therein). Prior to the Herschel Space Observatory (Pilbratt et al. 2010), in extragalactic sources, non-maser H2O rotational transitions were only detected by the Infrared Space Observatory (ISO, Kessler et al. 1996) in the form of far-infrared absorption lines (González-Alfonso et al. 2004, 2008). Observations of local infrared bright galaxies by Herschel have revealed a rich spectrum of submillimeter (submm) H2O emission lines (submm H2O refers to rest-frame submillimeter H2O emission throughout this paper if not otherwise specified). Many of these lines are emitted from high-excitation rotational levels with upper-level energies up to Eup/k = 642 K (e.g. van der Werf et al. 2010; González-Alfonso et al. 2010, 2012, 2013; Rangwala et al. 2011; Kamenetzky et al. 2012; Spinoglio et al. 2012; Meijerink et al. 2013; Pellegrini et al. 2013; Pereira-Santaella et al. 2013). Excitation analysis of these lines has revealed that they are probably excited through absorption of far-infrared photons from thermal dust emission in warm dense regions of the ISM (e.g. González-Alfonso et al. 2010). Therefore, unlike the canonical CO lines that trace collisional excitation of the molecular gas, these H2O lines represent a powerful diagnostic of the far-infrared radiation field.
Using the Herschel archive data, Yang et al. (2013, hereafter Y13) have undertaken a first systematic study of submm H2O emission in local infrared galaxies. H2O was found to be the strongest molecular emitter after CO within the submm band in those infrared-bright galaxies, even with higher flux density than that of CO in some local ULIRGs (velocity-integrated flux density of H2O(321–312)is larger than that of CO(5–4)in four galaxies out of 45 in the Y13 sample). The luminosities of the submm H2O lines (LH2O) are near-linearly correlated with total infrared luminosity (LIR, integrated over 8–1000 μm) over three orders of magnitude. The correlation is revealed to be a straightforward result of far-infrared pumping: H2O molecules are excited to higher energy levels through absorbing far-infrared photons, then the upper level molecules cascade toward the lines we observed in an almost constant fraction (Fig. 1). Although the galaxies dominated by active galactic nuclei (AGN) have somewhat lower ratios of LH2O /LIR, there does not appear to be a link between the presence of an AGN and the submm H2O emission (Y13). The H2O emission is likely to trace the far-infrared radiation field generated in star-forming nuclear regions in galaxies, explaining its tight correlation with far-infrared luminosity.
Besides detections of the H2O lines in local galaxies from space telescopes, redshifted submm H2O lines in high-redshift lensed Ultra- and Hyper-Luminous InfraRed Galaxies (ULIRGs, 1013L⊙>LIR ≥ 1012 L⊙; HyLIRGs, LIR ≥ 1013 L⊙) can also be detected by ground-based telescopes in atmospheric windows with high transmission. Strong gravitational lensing boosts the flux and allows one to detect the H2O emission lines easily. Since our first detection of submm H2O in a lensed Herschel source at z = 2.3 (Omont et al. 2011) using the IRAM NOrthern Extended Millimeter Array (NOEMA), several individual detections at high-redshift have also been reported (Lis et al. 2011; van der Werf et al. 2011; Bradford et al. 2011; Combes et al. 2012; Lupu et al. 2012; Bothwell et al. 2013; Omont et al. 2013; Vieira et al. 2013; Weiß et al. 2013; Rawle et al. 2014). These numerous and easy detections of H2O in high-redshift lensed ULIRGs show that its lines are the strongest submm molecular lines after CO and may be an important tool for studying these galaxies.
We have carried out a series of studies focussing on submm H2O emission in high-redshift lensed galaxies since our first detection. Through the detection of J = 2 H2O lines in seven high-redshift lensed Hy/ULIRGs reported by Omont et al. (2013, hereafter O13), a slightly super-linear correlation between LH2O and LIR (LH2O∝LIR1.2) from local ULIRGs and high-redshift lensed Hy/ULIRGs has been found. This result may imply again that far-infrared pumping is important for H2O excitation in high-redshift extreme starbursts. The average ratios of LH2O to LIR for the J = 2 H2O lines in the high-redshift sources tend to be 1.8 ± 0.9 times higher than those seen locally (Y13). This shows that the same physics with infrared pumping should dominate H2O excitation in ULIRGs at low and high redshift, with some specificity at high-redshift probably linked to the higher luminosities.
Modelling provides additional information about the H2O excitation. For example, through LVG modelling, Riechers et al. (2013) argue that the excitation of the submm H2O emission in the z ~ 6.3 submm galaxy is far-infrared pumping dominated. Modelling of the local Herschel galaxies of Y13 has been carried out by González-Alfonso et al. (2014, hereafter G14). They confirm that far-infrared pumping is the dominant mechanism responsible for the submm H2O emission (except for the ground-state emission transitions, such as para-H2O transition 111–000 ) in the extragalactic sources. Moreover, collisional excitation of the low-lying (J ≤ 2) H2O lines could also enhance the radiative pumping of the (J ≥ 3) high-lying lines. The ratio between low-lying and high-lying H2O lines is sensitive to the dust temperature (Td) and H2O column density (NH2O). From modelling the average of local star-forming- and mild-AGN-dominated galaxies, G14 show that the submm H2O emission comes from regions with NH2O ~ (0.5–2) × 1017 cm-2 and a 100 μm continuum opacity of τ100 ~ 0.05–0.2, where H2O is mainly excited by warm dust with a temperature range of 45–75 K. H2O lines thus provide key information about the properties of the dense cores of ULIRGs, that is, their H2O content, the infrared radiation field and the corresponding temperature of dust that is warmer than the core outer layers and dominates the far-infrared emission.
Observations of the submm H2O emission, together with appropriate modelling and analysis, therefore allows us to study the properties of the far-infrared radiation sources in great detail. So far, the excitation analysis combining both low- and high-lying H2O emission has only been done in a few case studies. Using H2O excitation modelling considering both collision and far-infrared pumping, González-Alfonso et al. (2010) and van der Werf et al. (2011) estimate the sizes of the far-infrared radiation fields in Mrk 231 and APM 08279+5255 (APM 08279 hereafter), which are not resolved by the observations directly, and suggest their AGN dominance based on their total enclosed energies. This again demonstrates that submm H2O emission is a powerful diagnostic tool which can even transcend the angular resolution of the telescopes.
The detection of submm H2O emission in the Herschel-ATLAS1 (Eales et al. 2010, H-ATLAS hereafter) sources through gravitational lensing allows us to characterise the far-infrared radiation field generated by intense star-forming activity, and possibly AGN, and learn the physical conditions in the warm dense gas phase in extreme starbursts in the early Universe. Unlike standard dense gas tracers such as HCN, which is weaker at high-redshift compared to that of local ULIRGs (Gao et al. 2007), submm H2O lines are strong and even comparable to high-J CO lines in some galaxies (Y13; O13). Therefore, H2O is an efficient tracer of the warm dense gas phase that makes up a major fraction of the total molecular gas mass in high-redshift Hy/ULIRGs (Casey et al. 2014). The successful detections of submm H2O lines in both local (Y13) and the high-redshift universe (O13) show the great potential of a systematic study of H2O emission in a large sample of infrared galaxies over a wide range in redshift (from local up to z ~ 4) and luminosity (LIR~1010–1013 L⊙). However, our previous high-redshift sample was limited to seven sources and to one J = 2 para-H2O line (Eup/k = 100–127 K) per source (O13). In order to further constrain the conditions of H2O excitation, to confirm the dominant role of far-infrared pumping and to learn the physical conditions of the warm dense gas phase in high-redshift starbursts, it is essential to extend the studies to higher excitation lines. We thus present and discuss here the results of such new observations of a strong J = 3 ortho-H2O line with Eup/k = 304 K in six strongly lensed H-ATLAS galaxies at z ~ 2.8–3.6, where a second lower-excitation J = 2 para-H2O line was also observed (Fig. 1 for the transitions and the corresponding Eup).
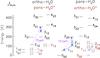 |
Fig. 1 Energy level diagrams of H2O and H2O+ shown in black and red, respectively. Dark blue arrows are the submm H2O transitions we have observed in this work. Pink dashed lines show the far-infrared pumping path of the H2O excitation in the model we use, with the wavelength of the photon labeled. The light blue dashed arrow is the transition from para-H2O energy level 220 to 211 along the cascade path from 220 to 111. Rotational energy levels of H2O and H2O+, as well as fine structure component levels of H2O+ are also shown in the figure. |
We describe our sample, observation and data reduction in Section 2. The observed properties of the high-redshift submm H2O emission are presented in Sect. 3. Discussions of the lensing properties, LH2O -LIR correlation, H2O excitation, comparison between H2O and CO, AGN contamination will be given in Sect. 4. Section 5 describes the detection of H2O+ lines. We summarise our results in Sect. 6. A flat ΛCDM cosmology with H0 = 71 km s-1 Mpc-1, ΩM = 0.27, ΩΛ = 0.73 (Spergel et al. 2003) is adopted throughout this paper.
2. Sample and observation
Our sample consists of eleven extremely bright high-redshift sources with F500 μm> 200 mJy discovered by the H-ATLAS survey (Eales et al. 2010). Together with the seven similar sources reported in our previous H2O study (O13), they include all the brightest high-redshift H-ATLAS sources (F500 μm> 170 mJy), but two, imaged at 880 μm with SMA by Bussmann et al. (2013, hereafter B13). In agreement with the selection according to the methods of Negrello et al. (2010), the detailed lensing modelling performed by B13 has shown that all of them are strongly lensed, but one, G09v1.124 (Ivison et al. 2013, see below). The sample of our present study is thus well representative of the brightest high-redshift submillimeter sources with F500 μm> 200 mJy (with apparent total infrared luminosity ~5–15 × 1013 L⊙ and z ~ 1.5–4.2) found by H-ATLAS in its equatorial (“GAMA”) and north-galactic-pole (“NGP”) fields, in ~300 deg2 with a density ~0.05 deg-2. In our previous project (O13), we observed H2O in seven strongly lensed high-redshift H-ATLAS galaxies from the B13 sample. In this work, in order to observe the high-excitation ortho-H2O(321–312)line with rest frequency of 1162.912 GHz with the IRAM/NOEMA, we selected the brightest sources at 500 μm with z ≳ 2.8 so that the redshifted lines could be observed in a reasonably good atmospheric window at νobs ≲ 300 GHz. Eight sources with such redshift were selected from the B13H-ATLAS sample.
Observation log.
B13 provide lensing models, magnification factors (μ) and inferred intrinsic properties of these galaxies and list their CO redshifts which come from Harris et al. (2012); Harris et al. (in prep.); Lupu et al. (in prep.); Krips et al. (in prep.) and Riechers et al. (in prep.).
In our final selection of the sample to be studied in the H2O(321–312)line, we then removed two sources, SDP 81 and G12v2.30, that were previously observed in H2O (O13; and also ALMA Partnership, Vlahakis et al. 2015, for SDP 81), because the J = 2 H2O emission is too weak and/or the interferometry could resolve out some flux considering the lensing image. The observed high-redshift sample thus consists of two GAMA-field sources: G09v1.97 and G12v2.43, and four sources in the H-ATLAS NGP field: NCv1.143, NAv1.195, NAv1.177 and NBv1.78 (Tables 1 and 2). Among the six remaining sources at redshift between 2.8 and 3.6, only one, NBv1.78, has been observed previously in a low-excitation line, para-H2O(202–111)(O13). Therefore, we have observed both para-H2O line 202–111or 211–202and ortho-H2O(321–312)in the other five sources, in order to compare their velocity-integrated flux densities.
Previously observed properties of the sample.
In addition, we also observed five sources mostly at lower redshifts in para-H2O lines 202–111or 211–202(Tables 1 and 2) to complete the sample of our H2O low-excitation study. They are three strongly lensed sources, G09v1.40, NAv1.56 and SDP11, a hyper-luminous cluster source G09v1.124 (Ivison et al. 2013), and a z ~ 3.7 source, NCv1.268 for which we did not propose a J = 3 H2O observation, considering its large linewidth which could bring difficulties in line detection.
As our primary goal is to obtain a detection of the submm H2O lines, we carried out the observations in the compact, D configuration of NOEMA. The baselines extended from 24 to 176 m, resulting in a synthesised beam with modest/low resolution of ~1.0″ × 0.9′′ to ~5.6′′ × 3.3′′ as shown in Table 1. The H2O observations were conducted from January 2012 to December 2013 in good atmospheric conditions (seeing of 0.3 ′′–1.5 ′′) stability and reasonable transparency (PWV ≤ 1 mm). The total on source time was ~1.5–8 h per source. 2 mm, 1.3 mm and 0.8 mm bands covering 129–174, 201–267 and 277–371 GHz, respectively, were used. All the central observation frequencies were chosen based on previous redshifts given by B13 according to the previous CO detections (Table 2). In all cases but one, the frequencies of our detections of H2O lines are consistent with these CO redshifts. The only exception is G09v1.40 where our H2O redshift disagrees with the redshift of z = 2.0894 ± 0.0009 given by Lupu et al. (in prep.), which is quoted by B13. We find z = 2.0925 ± 0.0001 in agreement with previous CO(3–2)observations (Riechers et al., in prep.). We used the WideX correlator which provided a contiguous frequency coverage of 3.6 GHz in dual polarisation with a fixed channel spacing of 1.95 MHz.
The phase and bandpass were calibrated by measuring standard calibrators that are regularly monitored at the IRAM/NOEMA, including 3C 279, 3C 273, MWC349 and 0923+392. The accuracy of the flux calibration is estimated to range from ~10% in the 2 mm band to ~20% in the 0.8 mm band. Calibration, imaging, cleaning and spectra extraction were performed within the GILDAS2 packages CLIC and MAPPING.
To compare the H2O emission with the typical molecular gas tracer, CO, we also observed the sources for CO lines using the EMIR receiver at the IRAM 30 m telescope. The CO data will be part of a systematic study of molecular gas excitation in H-ATLAS lensed Hy/ULIRGs, and a full description of the data and the scientific results will be given in a following paper (Yang et al., in prep.). The global CO emission properties of the sources are listed in Table 3 where we list the CO fluxes and linewidths. A brief comparison of the emission between H2O and CO lines will be given in Sect. 4.3.
3. Results
A detailed discussion of the observation results for each source is given in Appendix A, including the strength of the H2O emission, the image extension of H2O lines and the continuum (Fig. A.1), the H2O spectra and linewidths (Fig. 2) and their comparison with CO (Table 3). We give a synthesis of these results in this section.
Observed CO line properties using the IRAM 30 m/EMIR.
3.1. General properties of the H2O emissions
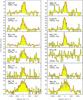 |
Fig. 2a Spatially integrated spectra of H2O in the six sources with both J = 2 para-H2O and J = 3 ortho-H2O lines observed. The red lines represent the Gaussian fitting to the emission lines. The H2O(202–111)spectrum of NBv1.78 is taken from O13. Except for H2O(321–312)in NAv1.195, all the J = 2 and J = 3 H2O lines are well detected, with a high S/N and similar profiles in both lines for the same source. |
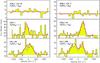 |
Fig. 2b Spatially integrated spectra of H2O of the five sources with only one J = 2 para-H2O line observed. The red lines represent the Gaussian fitting to the emission lines. Except for the H2O line in G09v1.124, all the J = 2 H2O lines are well detected. |
Observed properties of H2O emission lines.
To measure the linewidth, velocity-integrated flux density and the continuum level of the spectra from the source peak and from the entire source, we extract each spectrum from the CLEANed image at the position of the source peak in a single synthesis beam and the spectrum integrated over the entire source. Then we fit them with Gaussian profiles using MPFIT (Markwardt 2009).
We detect the high-excitation ortho-H2O(321–312)in five out of six observed sources, with high signal to noise ratios (S/N > 9) and velocity-integrated flux densities comparable to those of the low-excitation J = 2 para-H2O lines (Table 4 and Figs. 2 and A.1). We also detect nine out of eleven J = 2 para-H2O lines, either 202–111or 211–202 , with S/N ≥ 6 in terms of their velocity-integrated flux density, plus one tentative detection of H2O(202–111)in SDP11. We present the values of velocity-integrated H2O flux density detected at the source peak in a single synthesised beam, IH2Opk, and the velocity-integrated H2O flux density over the entire source, IH2O (Table 4). The detected H2O lines are strong, with IH2O= 3.7–14.6 Jy km s-1. Even considering gravitational lensing correction, this is consistent with our previous finding that high-redshift Hy/ULIRGs are very strong H2O emitters, with H2O flux density approaching that of CO (Tables 3 and 4 and Sect. 4.3). The majority of the images (7/11 for J = 2 lines and 3/4 for J = 3) are marginally resolved with IH2Opk/IH2O ~ 0.4–0.7. They show somewhat lensed structures. The others are unresolved with IH2Opk/IH2O > 0.8. All continuum emission flux densities (Sν(ct)pk for the emission peak and Sν(ct) for the entire source) are very well detected (S/N ≥ 30), with a range of total flux density of 9–64 mJy for Sν(ct). Figure A.1 shows the low-resolution images of H2O and the corresponding dust continuum emission at the observing frequencies. Because the positions of the sources were derived from Herschel observation, which has a large beamsize (>17′′) comparing to the source size, the position of most of the sources are not perfectly centred at these Herschel positions as seen in the maps. The offsets are all within the position error of the Herschel measurement (Fig. A.1). G09v1.124 is a complex HyLIRG system including two main components eastern G09v1.124-W and western G09v1.124-T as described in Ivison et al. (2013). In Fig. A.3, we identified the two strong components separated about 10′′, in agreement with Ivison et al. (2013). The J = 2 H2O and dust continuum emissions in NBv1.78, NCv1.195, G09v1.40, SDP 11 and NAv1.56, as well as the J = 3 ortho-H2O and the corresponding dust continuum emissions in G09v1.97, NCv1.143 and NAv1.177, are marginally resolved as shown in Fig. A.1. Their images are consistent with the corresponding SMA images (B13) in terms of their spatial distribution. The rest of the sources are not resolved by the low-resolution synthesised beams. The morphological structure of the H2O emission is similar to the continuum for most sources as shown in Fig. A.1. The ratio Sν(ct)pk/Sν(ct) and Sν(H2O)pk/Sν(H2O) are in good agreement within the error. However, for NCv1.143 in which Sν(ct)pk/Sν(ct) = 0.55 ± 0.01 and Sν(H2O)pk/Sν(H2O) = 0.74 ± 0.16, the J = 3 ortho-H2O emission appears more compact than the dust continuum. Generally it seems unlikely that we have a significant fraction of missing flux for our sources. Nevertheless, the low angular resolution (~1″ at best) limits the study of spatial distribution of the gas and dust in our sources. A detailed analysis of the images for each source is given in Appendix A.
The majority of the sources have H2O (and CO) linewidths between 210 and 330 km s-1, while the four others range between 500 and 700 km s-1 (Table 4). Except NCv1.268, which shows a double-peaked line profile, all H2O lines are well fit by a single Gaussian profile (Fig. 2). The line profiles between the J = 2 and J = 3 H2O lines do not seem to be significantly different, as shown from the linewidth ratios ranging from 1.26 ± 0.14 to 0.84 ± 0.16. The magnification from strong lensing is very sensitive to the spatial configuration, in other words, differential lensing, which could lead to different line profiles if the different velocity components of the line are emitted at different spatial positions. Since there is no visible differential effect between their profiles, it is possible that the J = 2 and J = 3 H2O lines are from similar spatial regions.
In addition to H2O, within the 3.6 GHz WideX band, we have also tentatively detected H2O+ emission in 3 sources: NCv1.143, G09v1.97 and G15v2.779 (see Sect. 5).
3.2. Lensing properties
All our sources are strongly gravitationally lensed (except G09v1.124, see Appendix A.11), which increases the line flux densities and allows us to study the H2O emission in an affordable amount of observation time. However, the complexity of the lensed images complicates the analysis. As mentioned above, most of our lensed images are either unresolved or marginally resolved. Thus, we will not discuss here the spatial distribution of the H2O and dust emissions through gravitational lensing modelling. However, we should keep in mind that the correction of the magnification is a crucial part of our study. In addition, differential lensing could have a significant influence when comparing H2O emission with dust and even comparing different transitions of same molecular species (Serjeant 2012), especially for the emission from close to the caustics.
In order to infer the intrinsic properties of our sample, especially LH2O as in our first paper O13, we adopted the lensing magnification factors μ (Table 2) computed from the modelling of the 880 μm SMA images (B13). As shown in the Appendix, the ratio of Sν(ct)pk/Sν(ct) and Sν(H2O)pk/Sν(H2O) are in good agreement within the uncertainties. Therefore, it is unlikely that the magnification of the 880 μm continuum image and H2O can be significantly different. However, B13 were unable to provide a lensing model for two of our sources, G12v2.43 and NAv1.177, because their lens deflector is unidentified. This does not affect the modelling of H2O excitation and the comparison of H2O and infrared luminosities since the differential lensing effect seems to be insignificant as discussed in Sects. 4 and Appendix A.
IR luminosity, H2O line luminosity and global dust temperature of the entire sample.
4. Discussion
4.1. LH2O – LIR correlation and LH2O – LIR ratio
Using the formula given by Solomon et al. (1992), we derive the apparent H2O luminosities of the sources, μLH2O (Table 4), from IH2O . For the ortho-H2O(321–312)lines, μLH2O varies in the range of 6–22 × 108 L⊙, while the μLH2O of the J = 2 lines are a factor ~1.2–2 weaker (Table 4) as discussed in Sect. 4.2.
Using the lensing magnification correction (taking the values of μ from B13), we have derived the intrinsic H2O luminosities (Table 5). The error of each luminosity consists of the uncertainty from both observation and the gravitational lensing modelling. After correcting for lensing, the H2O luminosities of our high-redshift galaxies appear to be one order of magnitude higher than those of local ULIRGs, as well as their infrared luminosities (Table 5), so that many of them should rather be considered as HyLIRGs than ULIRGs. Though the ratio of LH2O /LIR in our high-redshift sample is close to that of local ULIRGs (Y13), with somewhat a statistical increase in the extreme high LIR end (Fig. 3).
As displayed in Fig. 3 for H2O of the three observed lines, because we have extended the number of detections to 21 H2O lines, distributed in 16 sources and 3 transitions, we may independently study the correlation of LH2O(202–111)and LH2O(211–202)with LIR , while we had approximately combined the two lines in O13.
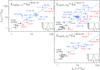 |
Fig. 3 Correlation between LIR and LH2O in local ULIRGs and high-redshift Hy/ULIRGs. The black points represent local ULIRGs from Y13. The blue points with solid error bars are the H-ATLAS source in this work together with some previously published sources. Red points with dashed error bars are excluded from the fit as described in the text. Upper limits are shown in arrows. The light blue lines show the results of the fitting. The insets are the probability density distributions of the fitted slopes α. We find tight correlations between the luminosity of the three H2O lines and LIR , namely LH2O∝LIR1.1−1.2. |
As found in O13, the correlation is slightly steeper than linear (LH2O~ ). To broaden the dynamical range of this comparison, we also included the local ULIRGs from Y13, together with a few other H2O detections in high-redshift Hy/ULIRGs, for example, HLSJ 0918 (HLSJ 091828.6+514223) (Combes et al. 2012; Rawle et al. 2014), APM 08279 (van der Werf et al. 2011), SPT 0538 (SPT-S J0538165030.8) (Bothwell et al. 2013) and HFLS3 (Riechers et al. 2013, with the magnification factor from Cooray et al. 2014) (Fig. 3). In the fitting, however, we excluded the sources with heavy AGN contamination (Mrk 231 and APM 08279) or missing flux resolved out by the interferometry (SDP 81). We also excluded the H2O(321–312)line of HFLS3 considering its unusual high LH2O(321–312) /LIR ratio as discussed above, that could bias our fitting. We have performed a linear regression in log-log space using the Metropolis-Hastings Markov Chain Monte Carlo (MCMC) algorithm sampler through linmix_err (Kelly 2007) to derived the α in
 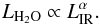 (1)The fitted parameters are α = 1.06 ± 0.19, 1.16 ± 0.13 and 1.06 ± 0.22 for H2O line 202–111 , 211–202and 321–312 , respectively. Comparing with the local ULIRGs, the high-redshift lensed ones have higher LH2O /LIR ratios (Table 6). These slopes confirm our first result derived from 7 H2O detections in (O13). The slight super-linear correlations seem to indicate that far-infrared pumping play an important role in the excitation of the submm H2O emission. This is unlike the high-J CO lines, which are determined by collisional excitation and follow the linear correlation between the CO line luminosity and LIR from the local to the high-redshift Universe (Liu et al. 2015). As demonstrated in G14, using the far-infrared pumping model, the steeper than linear growth of LH2O with LIR can be the result of an increasing optical depth at 100 μm (τ100) with increasing LIR . In local ULIRGs, the ratio of LH2O /LIR is relatively low while most of them are likely to be optically thin (τ100 ~ 0.1, G14). On the other hand, for the high-redshift lensed Hy/ULIRGs with high values of LIR , the continuum optical depth at far-infrared wavelengths is expected to be high (see Sect. 4.2), indicating that the H2O emission comes from very dense regions of molecular gas that are heavily obscured.
Ratio between infrared and H2O luminosity, and the velocity-integrated flux density ratio between different H2O transitions.
Similar to what we found in the local ULIRGs (Y13), we find again an anti-correlation between Td and LH2O(321–312) /LIR. The Spearman′s rank correlation coefficient for the five H2O(321–312)detected H-ATLAS sources is ρ = −0.9 with a two-sided significance of its deviation from zero, p = 0.04. However, after including the non-detection of H2O(321–312)in NAv1.195, the correlation is much weaker, that is to say, ρ ≲ −0.5 and p ~ 0.32. No significant correlation has been found between Td and LH2O(202–111) /LIR (ρ = −0.1 and p = 0.87) nor LH2O(211–202) /LIR (ρ = −0.3 and p = 0.45). As explained in G14, in the optically thick and very warm galaxies, the ratio of LH2O(321–312) /LIR is expected to decrease with increasing Td . And this anti-correlation can not be explained by optically thin conditions. However, a larger sample is needed to increase the statistical significance of this anti-correlation.
Although, it is important to stress that the luminosity of H2O is a complex result of various physical parameters such as dust temperature, gas density, H2O abundance and H2O gas distribution relative to the infrared radiation field, etc, it is striking that the correlation between LH2O and LIR stays linear from local young stellar objects (YSOs), in which the H2O molecules are mainly excited by shocks and collisions, to local ULIRGs (far-infrared pumping dominated), extending ~12 orders of magnitudes (San José-García et al. 2016), implying that H2O indeed traces the SFR proportionally, similarly to the dense gas (Gao & Solomon 2004) in the local infrared bright galaxies. However, for the high-redshift sources, the LH2O emissions are somewhat above the linear correlations which could be explained by their high τ100 (or large velocity dispersion). As shown in Table 6, HFLS3, with a τ100> 1 has extremely large ratios of LH2O /LIR which are stronger than the average of our H-ATLAS sources by factors ~2 for the J = 2 lines and ~4 for J = 3 (see Fig. 3). The velocity dispersions of its H2O lines are ~900 km s-1 (with uncertainties from 18% to 36%), which is larger than all our sources. For optically thick systems, larger velocity dispersion will increase the number of absorbed pumping photons, and boost the ratio of LH2O /LIR (G14).
For the AGN-dominated sources (i.e. APM 08279, G09v1.124-W and Mrk 231) as shown in Fig. 3, most of them (except for the H2O(321–312)line of Mrk 231) are well below the fitted correlation (see Sect. 4.4). This is consistent with the average value of local strong-AGN-dominated sources. The J ≲ 3 H2O lines are far-infrared pumped by the 75 and 101 μm photons, thus the very warm dust in strong-AGN-dominated sources is likely to contribute more to the LIR than the J ≲ 3 H2O excitation (see also Y13).
4.2. H2O excitation
We have detected both J = 2 and J = 3 H2O lines in five sources out of six observed for J = 3 ortho-H2O lines. By comparing the line ratios and their strength relative to LIR , we are able to constrain the physical conditions of the molecular content and also the properties of the far-infrared radiation field.
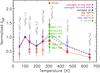 |
Fig. 4 Velocity-integrated flux density distribution of H2O normalised to IH2O(202–111)adapted from Y13. Local averaged values are shown in black dashed line and marks. Among them, AGN-dominated sources are shown in red and star-forming dominated galaxies are shown in blue. Some individual sources are also shown in this plot as indicated by the legend. Green diamonds are the high-redshift lensed Hy/ULIRGs from this work. HFLS3 is a z = 6.3 high-redshift galaxy from Riechers et al. (2013). |
To compare the H2O excitation with local galaxies, we plot the velocity-integrated flux density of ortho-H2O(321–312)normalised by that of para-H2O(202–111)in our source on top of the local and high-redshift H2O SLEDs (spectral line energy distributions) in Fig. 4. All the six high-redshift sources are located within the range of the local galaxies, with a 1σ dispersion of ~0.2. Yet for the z = 6.34 extreme starburst HFLS3, the value of this ratio is at least 1.7 times higher than the average value of local sources (Y13) and those of our lensed high-redshift Hy/ULIRGs at  3σ confidence level (Fig. 4). This probably traces different excitation conditions, namely the properties of the dust emission, as it is suggested in G14 that the flux ratio of H2O(321–312)over H2O(202–111)is the most direct tracer of the hardness of the far-infrared radiation field which powers the submm H2O excitation. However, the line ratios are still consistent with the strong saturation limit in the far-infrared pumping model with a Twarm ≳ 65 K. The large scatter of the H2O line ratio between 321–312and 202–111indicates different local H2O excitation conditions. As far-infrared pumping is dominating the H2O excitation, the ratio therefore reflects the differences in the far-infrared radiation field, for example, the temperature of the warmer dust that excites the H2O gas, and the submm continuum opacity. It is now clear that far-infrared pumping is the prevailing excitation mechanism for those submm H2O lines rather than collisional excitation (G14) in infrared bright galaxies in both the local and high-redshift Universe. The main path of far-infrared pumping related to the lines we observed here are 75 and 101 μm as displayed in Fig. 1. Therefore, the different line ratios are highly sensitive to the difference between the monochromatic flux at 75 and 101 μm. We may compare the global Td measured from far-infrared and submm bands (B13). It includes both cold and warm dust contribution to the dust SED in the rest-frame, which is, however, dominated by cold dust observed in SPIRE bands. It is thus not surprising that we find no strong correlation between Td and IH2O(321–312) /IH2O(202–111) (r ~ −0.3). The Rayleigh-Jeans tail of the dust SED is dominated by cooler dust which is associated with extended molecular gas and less connected to the submm H2O excitation. As suggested in G14, it is indeed the warmer dust (Twarm, as shown by the colour legend in Fig. 5) dominating at the Wien side of the dust SED that corresponds to the excitation of submm H2O lines.
To further explore the physical properties of the H2O gas content and the far-infrared dust radiation related to the submm H2O excitation, we need to model how we can infer key parameters, such as the H2O abundance and those determining the radiation properties, from the observed H2O lines. For this purpose, we use the far-infrared pumping H2O excitation model described in G14 to fit the observed LH2O together with the corresponding LIR , and derive the range of continuum optical depth at 100 μm (τ100), warm dust temperature (Twarm), and H2O column density per unit of velocity interval (NH2O/ΔV) in the five sources with both J = 2 and J = 3 H2O emission detections. Due to the insufficient number of the inputs in the model, which are LH2O of the two H2O lines and LIR , we are only able to perform the modelling by using the pure far-infrared pumping regime. Nevertheless, our observed line ratio between J = 3 and J = 2 H2O lines suggests that far-infrared pumping is the dominant excitation mechanism and the contribution from collisional excitation is minor (G14). The ±1σ contours from χ2 fitting are shown in Fig. 5 for each warm dust temperature component (Twarm = 35–115 K) per source. It is clear that with two H2O lines (one J = 2 para-H2O and ortho-H2O(312–312)), we will not be able to well constrain τ100 and NH2O /ΔV. As shown in the figure, for Twarm ≲ 75 K, both very low and very high τ100 could fit the observation data together with high NH2O /ΔV, while the dust with Twarm ≳ 95 K are likely favouring high τ100. In the low continuum optical depth part in Fig. 5, as τ100 decreases, the model needs to increase the value of NH2O /ΔV to generate sufficient LH2O to be able to fit the observed LH2O /LIR. This has been observed in some local sources with low τ100, such as in NGC 1068 and NGC 6240. There are no absorption features in the far-infrared but submm H2O emission have been detected in these sources (G14). The important feature of such sources is the lack of J ≥ 4 H2O emission lines. Thus, the observation of higher excitation of H2O will discriminate between the low and high τ100 regimes.
 |
Fig. 5 Parameter space distribution of the H2O far-infrared pumping excitation modelling with observed para-H2O 202–111 or 211–202and ortho-H2O(321–312)in each panel. ±1σ contours are shown for each plot. Different colours with different line styles represent different temperature components of the warm dust as shown in the legend. The explored warm dust temperature range is from 35 K to 115 K. The temperature contours that are unable to fit the data are not shown in this figure. From the figure, we are able to constrain the τ100, Twarm and NH2O /ΔV for the five sources. However, there are strong degeneracies. Thus, we need additional information, such as the velocity-integrated flux densities of J ≥ 4 H2O lines, to better constrain the physical parameters. |
Among these five sources, favoured key parameters are somewhat different showing the range of properties we can expect for such sources. Compared with the other four Hy/ULIRGs, G09v1.97 is likely to have the lowest Twarm as only dust with Twarm ~ 45−55 K can fit well with the data. NCv1.143 and NAv1.177 have slightly different diagnostic which yields higher dust temperature as Twarm ~ 45–75 K, while NBv1.78 and G12v2.43 tend to have the highest temperature range, Twarm ~ 45–95 K. The values of Twarm are consistent with the fact that H2O traces warm gas. We did not find any significant differences between the ranges of NH2O /ΔV derived from the modelling for these five sources, although G09v1.97 tends to have lower NH2O /ΔV (Table 7). As shown in Sect. 4.4, there is no evidence of AGN domination in all our sources, the submm H2O lines likely trace the warm dust component that connect to the heavily obscured active star-forming activity. However, due to the lack of photometry data on the Wien side of the dust SEDs, we will not be able to compare the observed values of Twarm directly with the ones derived from the modelling.
Parameters derived from far-infrared pumping model of H2O.
By adopting the 100 μm dust mass absorption coefficient from Draine (2003) of κ100 = 27.1 cm2 g-1, we can derive the dust opacity by 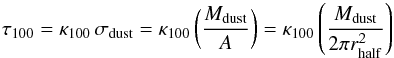 (2)where σdust is the dust mass column density, Mdust is the dust mass, A is the projected surface area of the dust continuum source and rhalf is the half-light radius of the source at submm. As shown in Table 2, among the five sources in Fig. 5, the values of Mdust and rhalf in G09v1.97, NCv1.143 and NBv1.78 have been derived via gravitational lensing (B13). Consequently, the derived approximate dust optical depth at 100 μm in these three sources is τ100 ≈ 1.8, 7.2 and 2.5, respectively. One should note that, the large uncertainty in both the κ100 and rhalf of these high-redshift galaxies can bring a factor of few error budget. Nevertheless, by adopting a gas-to-dust mass ratio of X = 100 (e.g. Magdis et al. 2011), we can derive the gas depletion time using the following approach,
  (3)where Mgas is the total molecular gas mass and ΣSFR is the surface SFR density derived from LIR using Kennicutt (1998) calibration by assuming a Salpeter IMF (B13, and Table 2). The implied depletion time scale is tdep ≈ 35–60 Myr with errors within a factor of two, in which the dominant uncertainties are from the assumed gas-to-dust mass ratio and the half-light radius. The tdep is consistent with the values derived from dense gas tracers, like HCN in local (U)LIRGs (e.g. Gao & Solomon 2004; García-Burillo et al. 2012). As suggested in G14, the H2O and HCN likely to be located in the same regions, indicate that the H2O traces the dense gas as well. Thus, the τ100 derived above is likely also tracing the far-infrared radiation source that powers the submm H2O emissions. B13 also has found that these H-ATLAS high-redshift Hy/ULIRGs are expected to be optically thick in the far-infrared. By adding the constrain from τ100 above, we can better derive the physical conditions in the sources as shown in Table 7.
From their modelling of local infrared galaxies, G14 find a range of Twarm = 45–75 K, τ100 = 0.05–0.2 and NH2O /ΔV = (0.5–2) × 1015 cm-2 km-1 s. The modelling results for our high-redshift sources are consistent with those in local galaxies in terms of Twarm and NH2O /ΔV. However, the values of τ100 we found at high-redshift are higher than those of the local infrared galaxies. This is consistent with the higher ratio between LH2O and LIR at high-redshift (Y13) which could be explained by higher τ100 (G14). However, as demonstrated in an extreme sample, a very large velocity dispersion will also increase the value of LH2O /LIR within the sources with τ100> 1. Thus, the higher ratio can also be explained by larger velocity dispersion (not including systemic rotations) in the high-redshift Hy/ULIRGs. Compared with local ULIRGs, our H-ATLAS sources are much more powerful in terms of their LIR . The dense warm gas regions that H2O traces are highly obscured with much more powerful far-infrared radiation fields, which possibly are close to the limit of maximum starbursts. Given the values of dust temperature and dust opacity, the radiation pressure Prad ~ τ100σTd/c (σ is Stefan-Boltzmann′s constant and c the speed of light) of our sources is about 0.8 × 10⁻⁷ erg cm-3. If we assume a H2 density nH2 of ~106 cm -3 and take Tk ~ 150 K as suggested in G14, the thermal pressure Pth ~ nH2kBTk ~ 2 × 10⁻⁸ erg cm-3 (kB is the Boltzmann constant and Tk is the gas temperature). Assuming a turbulent velocity dispersion of σv ~ 20–50 km s-1 (Bournaud et al. 2015) and taking molecular gas mass density ρ ~ 2μnH2 (2μ is the average molecular mass) would yield for the turbulent pressure  erg cm-3. This might be about an order of magnitude larger than Prad and two orders of magnitude larger than Pth, but we should note that all values are very uncertain, especially Pturb which could be uncertain by, at maximum, a factor of a few tens. Therefore, keeping in mind their large uncertainties, turbulence and/or radiation are likely to play an important role in limiting the star formation.
4.3. Comparison between H2O and CO
The velocity-integrated flux density ratio between submm H2O and submm CO lines with comparable frequencies is 0.02–0.03 in local PDRs such as Orion and M 82 (Weiß et al. 2010). But this ratio in local ULIRGs (Y13) and in H-ATLAS high-redshift Hy/ULIRGs is much higher, from 0.4 to 1.1 (Tables 3 and 4). The former case is dominated by typical PDRs, where CO lines are much stronger than H2O lines, while the latter sources shows clearly a different excitation regime, in which H2O traces the central core of warm, dense and dusty molecular gas which is about a few hundred parsec (González-Alfonso et al. 2010) in diameter in local ULIRGs and highly obscured even at far-infrared.
Generally, submm H2O lines are dominated by far-infrared pumping that traces strong far-infrared dust continuum emission, which is different from the regime of molecular gas traced by collisional excited CO lines. In the active star-forming nucleus of the infrared-bright galaxies, the far-infrared pumped H2O is expected to trace directly the far-infrared radiation generated by the intense star formation, which can be well correlated with the high-J CO lines (Liu et al. 2015). Thus there is likely to be a correlation between the submm H2O and CO emission. From our previous observations, most of the H2O and CO line profiles are quite similar from the same source in our high-redshift lensed Hy/ULIRGs sample (Fig. 2 of O13). In the present work, we again find similar profiles between H2O and CO in terms of their FWHM with an extended sample (Table 3 and 4). In both cases the FWHMs of H2O and CO are generally equal within typical 1.5σ errors (see special discussion for each source in Appendix A).
As the gravitational lensing magnification factor is sensitive to spatial alignment, the similar line profiles could thus suggest similar spatial distributions of the two gas tracers. However, there are a few exceptional sources, such as SDP 81 (ALMA Partnership, Vlahakis et al. 2015) and HLSJ0918 (Rawle et al. 2014). In both cases, the H2O lines are lacking the blue velocity component found in the CO line profiles. Quite different from the rest sources, in SDP 81 and HLSJ0918, the CO line profiles are complicated with multiple velocity components. Moreover, the velocity-integrated flux density ratios between these CO components may vary following the excitation level (different Jup). Thus, it is important to analyse the relation between different CO excitation components (from low-J to high-J) and H2O. Also, high resolution observation is needed to resolve the multiple spatial gas components and compare the CO emission with H2O and dust continuum emission within each component.
4.4. AGN content
It is still not clear how a strong AGN could affect the excitation of submm H2O in both local ULIRGs and high-redshift Hy/ULIRGs. Nevertheless, there are some individual studies addressing this question. For example, in APM 08279, van der Werf et al. (2011) found that AGN is the main power source that excites the high-J H2O lines and also enriches the gas-phase H2O abundance. Similar conclusion has also been drawn by González-Alfonso et al. (2010) that in Mrk 231 the AGN accounts for at least 50% contribution to the far-infrared radiation that excites H2O. From the systematic study of local sources (Y13), slightly lower values of LH2O /LIR are found in strong-AGN-dominated sources. In the present work, the decreasing ratio of LH2O /LIR with AGN is clearly shown in Fig. 3 where Mrk 231, G09v1.124-W and APM 08279 are below the correlation by factors between 2 and 5 with less than 30% uncertainties (except the H2O(321–123)line of Mrk 231).
In the far-infrared pumping regime, the buried AGN will provide a strong far-infrared radiation source that will pump the H2O lines. However, the very warm dust powered by the AGN will increase the value of LIR faster than the number of ≥75 μm photons that is dominating the excitation of J ≤ 3 H2O lines (e.g. Kirkpatrick et al. 2015). If we assume that the strength of the H2O emission is proportional to the number of pumping photons, then in the strong-AGN-dominated sources, the ratio of LH2O /LIR will decrease since much warmer dust is present. Moreover, strong radiation from the AGN could dissociate the H2O molecules.
To evaluate the AGN contribution to the H-ATLAS sources, we extracted the 1.4 GHz radio flux from the FIRST radio survey (Becker et al. 1995) listed in Table 2. By comparing the far-infrared and radio emission using the q parameter (Condon 1992), q ≡ log (LFIR/ 3.75 × 10¹² W)−log (L1.4 GHz/ 1 W Hz-1), we derive values of q from 1.9 to 2.5 in our sources. These values follow the value 2.3 ± 0.1 found by Yun et al. (2001) for non strong-radio AGN. This may suggest that there is also no significant indication of a high radio contribution from AGN. This is also confirmed by the Wide-field Infrared Survey Explorer (WISE, Wright et al. 2010), which does not detect our sources at 12 μm and 22 μm. However, rest-frame optical spectral observations show that G09v1.124-W is rather a powerful AGN (Oteo et al., in prep.), which is the only identified AGN-dominated source in our sample.
5. Detection of H2O+ emission lines
 |
Fig. 6 Left panel: from top to bottom are the full NOEMA spectrum at νrest ~ 750 GHz of NCv1.143, G09v1.97 and G15v2.779, respectively. The reference frequency is the redshifted frequency of the line H2O(211–202). The frequencies of the main H2O+(211–202) (5/2−5/2) and H2O+(202–111) (5/2−3/2) lines are indicated by grey vertical dashed lines. The three dashed squares in the spectrum of NCv1.143 show the position of each zoom-in spectrum of the H2O+ (or the H |
H2O can be formed through both solid-state and gas-phase chemical reactions (van Dishoeck et al. 2013). On dust-grain mantles, surface chemistry dominates the formation of H2O molecules. Then they can be released into the ISM gas through sublimation. In the gas phase, H2O can be produced through two routes: the neutral-neutral reaction, usually related to shocks, creates H2O via O + H2 → OH + H; OH + H2 → H2O + H at high temperature (≳300 K). At lower temperature (≲100 K), the ion-neutral reactions in photon-dominated regions (PDRs), cosmic-ray-dominated regions and X-ray-dominated regions (e.g. Meijerink & Spaans 2005) generate H2O from O, H+, H and H2, with intermediates such as O+, OH+, H2O+ and H3O+, and finally H3O+ + e → H2O + H. However, classical PDRs are not likely linked to these highly excited submm H2O emissions (Y13). Therefore, H2O+ lines are important for distinguishing between shock- or ion-chemistry origin for H2O in the early Universe, indicating the type of physical regions in these galaxies: shock-dominated regions, cosmic-ray-dominated regions or X-ray-dominated regions. Indeed, they can be among the most direct tracers of the cosmic-ray or/and X-ray ionization rate (e.g. Gérin et al. 2010; Neufeld et al. 2010; González-Alfonso et al. 2013) of the ISM, which regulates the chemistry and influences many key parameters, for example, X-factor (Bell et al. 2007) that connects the CO luminosity to the H2 mass. Moreover, the significant detections of H2O+ emission in high-redshift Hy/ULIRGs could help us understanding H2O formation in the early Universe.
When observing our sources with redshift z ≳ 3.3, it is possible to cover all the following lines with the NOEMA WideX bandwidth: para-H2O(211–202)at 752 GHz and four ortho-H2O+ lines (two intertwined fine structure doublets of two different lines whose frequencies almost coincide by chance): 202–111 (5/2−3/2) at 742.1 GHz, 211–202 (5/2−3/2) at 742.3 GHz, 202–111 (3/2−3/2) at 746.3 GHz and 211–202 (5/2−5/2) at 746.5 GHz, in the 3.6 GHz band simultaneously (the rest-frame frequencies are taken from the CDMS catalogue: http://www.astro. uni-koeln.de/cdms, see energy level diagram of H2O+ in Fig. 1 and the full spectra in Fig. 6). Additionally, within this range, we can also cover the H O(211–202) line at 745.3 GHz. There are three sources of our sample that have been observed in such a frequency setup: NCv1.143, NCv1.268 and G09v1.97. We have also included the source G15v2.779 from our previous observation (O13), in which we have covered both H2O(211–202)at 752 GHz and H2O+ lines around 746 GHz. We have detected both main lines of H2O+ in NCv1.143, and tentatively detected one line in G09v1.97 and G15v2.779 (Fig. 6). For NCv1.268, due to the large noise level and the complex line profile, we were not able to really identify any H2O+ line detection.
As shown in Fig. 6, in NCv1.143, the dominant H2O+ fine structure lines 211–202 (5/2−5/2) at 746.5 GHz and 202–111 (5/2−3/2) at 742.1 GHz are well detected. The velocity-integrated flux densities of the two lines from a two-Gaussian fit are 1.9 ± 0.3 and 1.6 ± 0.2 Jy km s-1, respectively. These are the approximate velocity-integrated flux densities of the dominant H2O+ lines 211–202 (5/2−5/2) and 202–111 (5/2−3/2) if neglecting the minor contributions from H2O+ lines 202–111 (3/2−3/2) at 746.2 GHz and 211–202 (5/2−3/2) at 742.3 GHz. However, the H2O+ line profile at 746.5 GHz is slightly wider than the H2O line (Fig. 6), probably due to a contribution from the fairly weak fine structure line H2O+(202–111) (3/2−3/2) at 746.3 GHz. The ratio between total velocity-integrated flux density of the H2O+ lines and H2O(211–202)is 0.60 ± 0.07 (roughly 0.3 for each dominant H2O+ line), being consistent with the average value from the local infrared galaxies (Y13)3. In order to derive the velocity-integrated flux density of each fine structure doublets around 742 and 746 GHz, we have also performed a four-Gaussian fit with fixed line positions (equal to νrest/ (1 + z)) and linewidth (equals to that of H2O(211–202)). We find the velocity-integrated flux densities of the two fine structure lines of H2O+(211–202) are 1.6 ± 0.5 and 0.3 ± 0.4 Jy/km s-1, while they are 1.6 ± 0.4 and 0.2 ± 0.5 Jy/km s-1 for the two fine structure lines of H2O+(202–111) (Table 8). We should note that these fitting results have much larger uncertainties due to the blending. Nevertheless, they are consistent with the earlier fitting results without de-blending. The similarity of the velocity-integrated flux densities between the H2O+(202–111) and H2O+(211–202) lines is in good agreement with the regime of far-infrared pumping as submm H2O (González-Alfonso et al. 2013). As a first approximation, if these H2O+ lines are optically thin and we ignore the additional pumping from ortho-H2O+ 202 to ortho-H2O+J = 3 energy levels, the statistical equilibrium applied to energy level 202 5/2 implies that all population arriving per second at 202 5/2 should be equal to all population leaving the level per second.
After subtracting the Gaussian profiles of all the H2O+ lines in the spectrum, we find a 3σ residual in terms of the velocity-integrated flux density around 745.3 GHz (I = 0.6 ± 0.2 Jy km s-1, see Fig. 6). This could be a tentative detection of the HO(211–202) line at 745.320 GHz. The velocity-integrated flux density ratio of HO(211–202) over H2O(211–202)in NCv1.143 would hence be ~0.1. If this tentative detection was confirmed, it would show that ALMA could easily study such lines. But sophisticated models will be needed to infer isotope ratios.
The spectrum of the H2O(211–202)line in G09v1.97 covers both the two main H2O+ fine structure lines (Fig. 6). However, due to the limited sensitivity, we have only tentatively detected the H2O+(202–111) (5/2−3/2) line just above 3σ (neglecting the minor contribution from H2O+(211–202) (5/2−3/2)), and the velocity-integrated flux density is 1.4 ± 0.4 Jy km s-1 using a single Gaussian fit. We did not perform any line de-blending for this source considering the data quality. The H2O+ line profile is in good agreement with that of the H2O (blue dashed histogram in Fig. 7). The velocity-integrated flux density of the undetected H2O+(211–202) (5/2−5/2) line could also be close to this value as discussed in the case of NCv1.143, yet somewhat lower and not detected in this source. More sensitive observation should be conducted to further derive robust line parameters.
We have also tentatively detected the H2O+(211–202) (5/2−5/2) line in G15v2.779 (S/N~ 4 by neglecting the minor contribution from the H2O+(202–111) (3/2−3/2) line). The line profile is in good agreement with that of H2O(211–202)(blue dashed histogram in Fig. 6). The velocity-integrated flux density derived from a double-peak Gaussian fit is 1.2 ± 0.3 Jy km s-1 (we did not perform any line de-blending for the H2O+ doublet considering the spectral noise level). There could be a minor contribution from the H2O+(202–111) (3/2−3/2) line to the velocity-integrated flux density. However, such a contribution is likely to be negligible as in the case of NCv1.143. The contribution is also within the uncertainty of the velocity-integrated flux density. Nevertheless, the position of H2O+ has a small blue-shift compared with H2O, but note that the blue part of the line is cut by the limited observed bandwidth (yellow histogram).
Observed ortho-H2O+ fine structure line parameters of the high-redshift H-ATLAS lensed HyLIRGs.
After including the local detections of H2O+ lines from Y13 (Table B.1), we find a tight linear correlation between the luminosity of H2O and the two main lines of H2O+ (slopes equal to 1.03 ± 0.06 and 0.91 ± 0.07, see Fig. 7). However, one should keep in mind that, because the local measurement done by Herschel SPIRE/FTS (Naylor et al. 2010) has rather low spectral resolution, neither H2O+(211–202) (5/2−3/2) and H2O+(202–111) (5/2−3/2), nor H2O+(211–202) (5/2−5/2) and H2O+(202–111) (3/2−3/2) can be spectroscopically resolved. In the correlation plot (Fig. 7) and Table B.1, we use the total luminosity from the 742 GHz and 746 GHz lines, by assuming the contribution from H2O+(211–202) (5/2−3/2) and H2O+(202–111) (3/2−3/2) to the velocity-integrated flux density of the line at 742 GHz and 746 GHz is small (~18%) and does not vary significantly between different sources. Hence, the velocity-integrated flux density ratio between each of the two dominant H2O+ fine structure lines and H2O in NCv1.143, G15v2.779 and G09v1.97 is ~0.3 (uncertainties are less than 30%), which is consistent with local galaxies as shown in the figure. This ratio is much larger than the abundance ratio of H2O+/H2O ~ 0.05 found in Arp 220, an analogue of high-redshift ULIRGs (Rangwala et al. 2011).
 |
Fig. 7 Correlation between the luminosity of J = 2 ortho-H2O+ and para-H2O(211–202). The fitted function is LH2O+∝LH2Oα. We found a very good correlation between LH2O+ and LH2O with a slope close to one. Black points are from the local ULIRGs as listed in Table B.1. Dark blue ones are high-redshift starbursts from this work. Black solid lines indicate the χ2 fitting results while the grey dashed lines and the grey annotations represent the average ratio between the LH2O+ and LH2O . |
As discussed above, the AGN contribution to the excitation of the submm lines of most of our sources appears to be minor. Thus, the formation of H2O+ is likely dominated by cosmic-ray ionization, rather than X-ray ionization. Given the average luminosity ratio of H2O+/H2O~ 0.3 ± 0.1 shown in Fig. 7, Meijerink et al. (2011) suggest a cosmic-ray ionization rate of 10-14–10-13 s-1. Such high cosmic-ray ionization rates drive the ambient ionization degree of the ISM to 10-3–10-2, rather than the canonical 10-4. Therefore, in the gas phase, an ion-neutral route likely dominates the formation of H2O. However, H2O can also be enriched through the water-ice sublimation that releases H2O into the gas-phase ISM. As the upper part, ~90 K, of the possible range for Twarm is close to the sublimation temperature of water ice. Hence, the high H2O abundance (NH2O cm-2, see Sect. 4.2) observed is likely to be the result of ion chemistry dominated by high cosmic-ray ionization and/or perhaps water ice desorption. However, further observation of H2O+ lines of different transitions and a larger sample is needed to constrain the contribution to H2O formation from neutral-neutral reactions dominated by shocks.
6. Conclusions
In this paper, we report a survey of submm H2O emission at redshift z ~ 2–4, by observing a higher excited ortho-H2O(321–312)in 6 sources and several complementary J = 2 para-H2O emission lines in the warm dense cores of 11 high-redshift lensed extreme starburst galaxies (Hy/ULIRGs) discovered by H-ATLAS. So far, we have detected an H2O line in most of our observations of a total sample of 17 high-redshift lensed galaxies, in other words, we have detected both J = 2 para-H2O and J = 3 ortho-H2O lines in five, and in ten other sources only one J = 2 para-H2O line. In these high-redshift Hy/ULIRGs, H2O is the second strongest molecular emitter after CO within the submm band, as in local ULIRGs. The spatially integrated H2O emission lines have a velocity-integrated flux density ranging from 4 to 15 Jy km s-1, which yields the apparent H2O emission luminosity, μLH2O ranging from ~6–22 × 108 L⊙. After correction for gravitation lensing magnification, we obtained the intrinsic LH2O for para-H2O lines 202–111 , 211–202and ortho-H2O(321–312). The luminosities of the three H2O lines increase with LIR as LH2O∝LIR1.1–1.2. This correlation indicates the importance of far-infrared pumping as a dominant mechanism of H2O excitation. Comparing with J = 3 to J = 6 CO lines, the linewidths between H2O and CO are similar, and the velocity-integrated flux densities of H2O and CO are comparable. The similarity in line profiles suggests that these two molecular species possibly trace similar intense star-forming regions.
Using the far-infrared pumping model, we have analysed the ratios between J = 2 and J = 3 H2O lines and LH2O /LIR in 5 sources with both J H2O lines detected. We have derived the ranges of the warm dust temperature (Twarm), the H2O column density per unit velocity interval (NH2O/ΔV) and the optical depth at 100 μm (τ100). Although there are strong degeneracies, these modelling efforts confirm that, similar to those of local ULIRGs, these submm H2O emissions in high-redshift Hy/ULIRGs trace the warm dense gas that is tightly correlated with the massive star forming activity. While the values of Twarm and NH2O (by assuming that they have similar velocity dispersion ΔV) are similar to the local ones, τ100 in the high-redshift Hy/ULIRGs is likely to be greater than 1 (optically thick), which is larger than τ100 = 0.05–0.2 found in the local infrared galaxies. However, we notice that the parameter space is still not well constrained in our sources through H2O excitation modelling. Due to the limited excitation levels of the detected H2O lines, we are only able to perform the modelling with pure far-infrared pumping.
The detection of relatively strong H2O+ lines opens the possibility to help understanding the formation of such large amount of H2O. In these high-redshift Hy/ULIRGs, the H2O formation is likely to be dominated by ion-neutral reactions powered by cosmic-ray-dominated regions. The velocity-integrated flux density ratio between H2O+ and H2O (IH2O+/IH2O ~ 0.3), is remarkably constant from low to high-redshift, reflecting similar conditions in Hy/ULIRGs. However, more observations of H2O+ emission/absorption and also OH+ lines are needed to further constrain the physical parameters of the cosmic-ray-dominated regions and the ionization rate in those regions.
We have demonstrated that the submm H2O emission lines are strong and easily detectable with NOEMA. Being a unique diagnostic, the H2O emission offers us a new approach to constrain the physical conditions in the intense and heavily obscured star-forming regions dominated by far-infrared radiation at high-redshift. Follow-up observations of other gas tracers, for instance, CO, HCN, H2O+ and OH+ using the NOEMA, IRAM 30m and JVLA will complement the H2O diagnostic of the structure of different components, dominant physical processes, star formation and chemistry in high-redshift Hy/ULIRGs.
With unprecedented spatial resolution and sensitivity, the image from the ALMA long baseline campaign observation of SDP 81 (also known as H-ATLAS J090311.6+003906, ALMA Partnership, Vlahakis et al. 2015; Dye et al. 2015; Rybak et al. 2015), shows the resolved structure of the dust, CO and H2O emission in the z = 3 ULIRG. With careful reconstruction of the source plane images, ALMA will help to resolve the submm H2O emission in high-redshift galaxies into the scale of giant molecular clouds, and provide a fresh view of detailed physics and chemistry in the early Universe.
The Herschel-ATLAS is a project with Herschel, which is an ESA space observatory with science instruments provided by European-led Principal Investigator consortia and with important participation from NASA. The H-ATLAS website is http://www.h-atlas.org
See http://www.iram.fr/IRAMFR/GILDAS for more information about the GILDAS softwares.
As suggested by González-Alfonso et al. (2013), due to the very limited spectral resolution of Herschel/SPIRE FTS, the ortho-H2O+(202–111) (3/2−3/2) line at 746.5 GHz quoted in Y13 is actually dominated by ortho-H2O+(211–202) (5/2−5/2), considering their likely excitation and relative strength.
Acknowledgments
We thank our referee for the very detail comments and suggestions which have improved the paper. This work was based on observations carried out with the IRAM Interferometer NOEMA, supported by INSU/CNRS (France), MPG (Germany), and IGN (Spain). The authors are grateful to the IRAM staff for their support. C.Y. thanks Claudia Marka and Nicolas Billot for their help of the IRAM 30 m/EMIR observation. C.Y. also thanks Zhi-Yu Zhang and Iván Oteo for insightful discussions. C.Y., A.O. and Y.G. acknowledge support by NSFC grants #11311130491, #11420101002 and CAS Pilot B program #XDB09000000. C.Y. and Y.G. also acknowledge support by NSFC grants #11173059. C.Y., A.O., A.B. and Y.G. acknowledge support from the Sino-French LIA-Origin joint exchange program. E.G.-A. is a Research Associate at the Harvard-Smithsonian Center for Astrophysics, and thanks the Spanish Ministerio de Economía y Competitividad for support under projects FIS2012-39162-C06-01 and ESP2015-65597-C4-1-R, and NASA grant ADAP NNX15AE56G. RJI acknowledges support from ERC in the form of the Advanced Investigator Programme, 321302, COSMICISM. US participants in H-ATLAS acknowledge support from NASA through a contract from JPL. Italian participants in H-ATLAS acknowledge a financial contribution from the agreement ASI-INAF I/009/10/0. SPIRE has been developed by a consortium of institutes led by Cardiff Univ. (UK) and including: Univ. Lethbridge (Canada); NAOC (China); CEA, LAM (France); IFSI, Univ. Padua (Italy); IAC (Spain); Stockholm Observatory (Sweden); Imperial College London, RAL, UCL-MSSL, UKATC, Univ. Sussex (UK); and Caltech, JPL, NHSC, Univ. Colorado (USA). This development has been supported by national funding agencies: CSA (Canada); NAOC (China); CEA, CNES, CNRS (France); ASI (Italy); MCINN (Spain); SNSB (Sweden); STFC, UKSA (UK); and NASA (USA). C.Y. is supported by the China Scholarship Council grant (CSC No. 201404910443).
References
- ALMA Partnership, Vlahakis, C., Hunter, T. R., Hodge, J. A., et al. 2015, ApJ, 808, L4 [NASA ADS] [CrossRef] [Google Scholar]
- Becker, R. H., White, R. L., & Helfand, D. J. 1995, ApJ, 450, 559 [NASA ADS] [CrossRef] [Google Scholar]
- Bell, T. A., Viti, S., & Williams, D. A. 2007, MNRAS, 378, 983 [NASA ADS] [CrossRef] [Google Scholar]
- Bothwell, M. S., Aguirre, J. E., Chapman, S. C., et al. 2013, ApJ, 779, 67 [NASA ADS] [CrossRef] [Google Scholar]
- Bournaud, F., Daddi, E., Weiß, A., et al. 2015, A&A, 575, A56 [NASA ADS] [CrossRef] [EDP Sciences] [Google Scholar]
- Bradford, C. M., Bolatto, A. D., Maloney, P. R., et al. 2011, ApJ, 741, L37 [NASA ADS] [CrossRef] [Google Scholar]
- Bussmann, R. S., Pérez-Fournon, I., Amber, S., et al. 2013, ApJ, 779, 25 (B13) [NASA ADS] [CrossRef] [Google Scholar]
- Calanog, J. A., Fu, H., Cooray, A., et al. 2014, ApJ, 797, 138 [NASA ADS] [CrossRef] [Google Scholar]
- Casey, C. M., Narayanan, D., & Cooray, A. 2014, Phys. Rep., 541, 45 [NASA ADS] [CrossRef] [Google Scholar]
- Combes, F., Rex, M., Rawle, T. D., et al. 2012, A&A, 538, L4 [NASA ADS] [CrossRef] [EDP Sciences] [Google Scholar]
- Condon, J. J. 1992, ARA&A, 30, 575 [NASA ADS] [CrossRef] [MathSciNet] [Google Scholar]
- Cooray, A., Calanog, J., Wardlow, J. L., et al. 2014, ApJ, 790, 40 [NASA ADS] [CrossRef] [Google Scholar]
- Draine, B. T. 2003, ARA&A, 41, 241 [NASA ADS] [CrossRef] [Google Scholar]
- Dye, S., Furlanetto, C., Swinbank, A. M., et al. 2015, MNRAS, 452, 2258 [NASA ADS] [CrossRef] [Google Scholar]
- Eales, S., Dunne, L., Clements, D., et al. 2010, PASP, 122, 499 [NASA ADS] [CrossRef] [Google Scholar]
- Gao, Y., & Solomon, P. M. 2004, ApJ, 606, 271 [NASA ADS] [CrossRef] [Google Scholar]
- Gao, Y., Carilli, C. L., Solomon, P. M., & Van den Bout, P. A. 2007, ApJ, 660, L93 [NASA ADS] [CrossRef] [Google Scholar]
- García-Burillo, S., Usero, A., Alonso-Herrero, A., et al. 2012, A&A, 539, A8 [NASA ADS] [CrossRef] [EDP Sciences] [Google Scholar]
- Gérin, M., de Luca, M., Black, J., et al. 2010, A&A, 518, L110 [NASA ADS] [CrossRef] [EDP Sciences] [Google Scholar]
- González-Alfonso, E., Smith, H. A., Fischer, J., & Cernicharo, J. 2004, ApJ, 613, 247 [NASA ADS] [CrossRef] [Google Scholar]
- González-Alfonso, E., Smith, H. A., Ashby, M. L. N., et al. 2008, ApJ, 675, 303 [NASA ADS] [CrossRef] [Google Scholar]
- González-Alfonso, E., Fischer, J., Isaak, K., et al. 2010, A&A, 518, L43 [NASA ADS] [CrossRef] [EDP Sciences] [Google Scholar]
- González-Alfonso, E., Fischer, J., Graciá-Carpio, J., et al. 2012, A&A, 541, A4 [NASA ADS] [CrossRef] [EDP Sciences] [Google Scholar]
- González-Alfonso, E., Fischer, J., Bruderer, S., et al. 2013, A&A, 550, A25 [NASA ADS] [CrossRef] [EDP Sciences] [Google Scholar]
- González-Alfonso, E., Fischer, J., Aalto, S., & Falstad, N. 2014, A&A, 567, A91 (G14) [NASA ADS] [CrossRef] [EDP Sciences] [Google Scholar]
- Harris, A. I., Baker, A. J., Frayer, D. T., et al. 2012, ApJ, 752, 152 [NASA ADS] [CrossRef] [Google Scholar]
- Ivison, R. J., Swinbank, A. M., Smail, I., et al. 2013, ApJ, 772, 137 [NASA ADS] [CrossRef] [Google Scholar]
- Kamenetzky, J., Glenn, J., Rangwala, N., et al. 2012, ApJ, 753, 70 [NASA ADS] [CrossRef] [Google Scholar]
- Kelly, B. C. 2007, ApJ, 665, 1489 [NASA ADS] [CrossRef] [Google Scholar]
- Kennicutt, Jr., R. C. 1998, ARA&A, 36, 189 [Google Scholar]
- Kessler, M. F., Steinz, J. A., Anderegg, M. E., et al. 1996, A&A, 315, L27 [NASA ADS] [Google Scholar]
- Kirkpatrick, A., Pope, A., Sajina, A., et al. 2015, ApJ, 814, 9 [NASA ADS] [CrossRef] [Google Scholar]
- Lis, D. C., Neufeld, D. A., Phillips, T. G., Gerin, M., & Neri, R. 2011, ApJ, 738, L6 [NASA ADS] [CrossRef] [Google Scholar]
- Liu, D., Gao, Y., Isaak, K., et al. 2015, ApJ, 810, L14 [NASA ADS] [CrossRef] [Google Scholar]
- Lupu, R. E., Scott, K. S., Aguirre, J. E., et al. 2012, ApJ, 757, 135 [NASA ADS] [CrossRef] [Google Scholar]
- Magdis, G. E., Daddi, E., Elbaz, D., et al. 2011, ApJ, 740, L15 [Google Scholar]
- Markwardt, C. B. 2009, in Astronomical Data Analysis Software and Systems XVIII, eds. D. A. Bohlender, D. Durand, & P. Dowler, ASP Conf. Ser., 411, 251 [Google Scholar]
- Meijerink, R., & Spaans, M. 2005, A&A, 436, 397 [NASA ADS] [CrossRef] [EDP Sciences] [Google Scholar]
- Meijerink, R., Spaans, M., Loenen, A. F., & van der Werf, P. P. 2011, A&A, 525, A119 [NASA ADS] [CrossRef] [EDP Sciences] [Google Scholar]
- Meijerink, R., Kristensen, L. E., Weiß, A., et al. 2013, ApJ, 762, L16 [NASA ADS] [CrossRef] [Google Scholar]
- Naylor, D. A., Baluteau, J.-P., Barlow, M. J., et al. 2010, in SPIE Conf. Ser., 7731, 16 [Google Scholar]
- Negrello, M., Hopwood, R., De Zotti, G., et al. 2010, Science, 330, 800 [NASA ADS] [CrossRef] [Google Scholar]
- Neufeld, D. A., Goicoechea, J. R., Sonnentrucker, P., et al. 2010, A&A, 521, L10 [NASA ADS] [CrossRef] [EDP Sciences] [Google Scholar]
- Omont, A., Neri, R., Cox, P., et al. 2011, A&A, 530, L3 [NASA ADS] [CrossRef] [EDP Sciences] [Google Scholar]
- Omont, A., Yang, C., Cox, P., et al. 2013, A&A, 551, A115 (O13) [NASA ADS] [CrossRef] [EDP Sciences] [Google Scholar]
- Pascale, E., Auld, R., Dariush, A., et al. 2011, MNRAS, 415, 911 [NASA ADS] [CrossRef] [Google Scholar]
- Pellegrini, E. W., Smith, J. D., Wolfire, M. G., et al. 2013, ApJ, 779, L19 [NASA ADS] [CrossRef] [Google Scholar]
- Pereira-Santaella, M., Spinoglio, L., Busquet, G., et al. 2013, ApJ, 768, 55 [NASA ADS] [CrossRef] [Google Scholar]
- Pilbratt, G. L., Riedinger, J. R., Passvogel, T., et al. 2010, A&A, 518, L1 [CrossRef] [EDP Sciences] [Google Scholar]
- Rangwala, N., Maloney, P. R., Glenn, J., et al. 2011, ApJ, 743, 94 [NASA ADS] [CrossRef] [Google Scholar]
- Rawle, T. D., Egami, E., Bussmann, R. S., et al. 2014, ApJ, 783, 59 [NASA ADS] [CrossRef] [Google Scholar]
- Riechers, D. A., Bradford, C. M., Clements, D. L., et al. 2013, Nature, 496, 329 [Google Scholar]
- Rybak, M., McKean, J. P., Vegetti, S., Andreani, P., & White, S. D. M. 2015, MNRAS, 451, L40 [NASA ADS] [CrossRef] [Google Scholar]
- San José-García, I., Mottram, J. C., van Dishoeck, E. F., et al. 2016, A&A, 585, A103 [NASA ADS] [CrossRef] [EDP Sciences] [Google Scholar]
- Serjeant, S. 2012, MNRAS, 424, 2429 [NASA ADS] [CrossRef] [Google Scholar]
- Solomon, P. M., Downes, D., & Radford, S. J. E. 1992, ApJ, 387, L55 [NASA ADS] [CrossRef] [Google Scholar]
- Spergel, D. N., Verde, L., Peiris, H. V., et al. 2003, ApJS, 148, 175 [NASA ADS] [CrossRef] [Google Scholar]
- Spinoglio, L., Pereira-Santaella, M., Busquet, G., et al. 2012, ApJ, 758, 108 [NASA ADS] [CrossRef] [Google Scholar]
- van der Werf, P. P., Isaak, K. G., Meijerink, R., et al. 2010, A&A, 518, L42 [NASA ADS] [CrossRef] [EDP Sciences] [Google Scholar]
- van der Werf, P. P., Berciano Alba, A., Spaans, M., et al. 2011, ApJ, 741, L38 [NASA ADS] [CrossRef] [Google Scholar]
- van Dishoeck, E. F., Herbst, E., & Neufeld, D. A. 2013, Chemical Reviews, 113, 9043 [Google Scholar]
- Vieira, J. D., Marrone, D. P., Chapman, S. C., et al. 2013, Nature, 495, 344 [NASA ADS] [CrossRef] [Google Scholar]
- Weiß, A., Requena-Torres, M. A., Güsten, R., et al. 2010, A&A, 521, L1 [NASA ADS] [CrossRef] [EDP Sciences] [Google Scholar]
- Weiß, A., De Breuck, C., Marrone, D. P., et al. 2013, ApJ, 767, 88 [NASA ADS] [CrossRef] [Google Scholar]
- Wright, E. L., Eisenhardt, P. R. M., Mainzer, A. K., et al. 2010, AJ, 140, 1868 [NASA ADS] [CrossRef] [Google Scholar]
- Yang, C., Gao, Y., Omont, A., et al. 2013, ApJ, 771, L24 (Y13) [NASA ADS] [CrossRef] [Google Scholar]
- Yun, M. S., Reddy, N. A., & Condon, J. J. 2001, ApJ, 554, 803 [NASA ADS] [CrossRef] [Google Scholar]
Appendix A: Individual sources
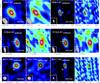 |
Fig. A.1 Mapping of the H2O emission lines and the corresponding continuum emission (frequencies have been shown accordingly in the white text) in the sources with both para J = 2 and ortho J = 3 H2O lines observed. The contours of the continuum emission start from 6σ in step of 10σ, and the contours of the H2O emission start from 3σ in step of 1σ. Asymmetric negative contours are shown in white dashed lines. For each observation, the 1σ contours for the continuum (mJy beam-1) and the H2O emission line (Jy km s-1 beam-1) are as follows: G09v1.97 H2O(211–202)(0.17/0.57), G09v1.97 H2O(321–312)(0.25/0.38), G12v2.43 H2O(202–111)(0.29/0.48), G12v2.43 H2O(321–312)(0.30/0.53), NCv1.143 H2O(211–202)(0.16/0.36) and NCv1.143 H2O(321–312)(0.42/0.72). |
 |
Fig. A.2 (See Fig. A.1 caption.) For each observation, the 1σ contour for the continuum (mJy beam-1) and the H2O emission line (Jy km s-1 beam-1) are as follows: NCv1.195 H2O(202–111)(0.34/0.51), NCv1.195 H2O(321–312)(0.48/–), NAv1.177 H2O(202–111)(0.58/0.65), NAv1.177 H2O(321–312)(0.38/0.58), NBv1.78 H2O(202–111)(0.28/0.30), NBv1.78 H2O(321–312)(0.21/0.29). |
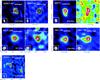 |
Fig. A.3 (See Fig. A.1 caption.) For each observation, the 1σ contour for the continuum (mJy beam-1) and the H2O emission line (Jy km s-1 beam-1) are as follows: G09v1.124 H2O(211–202)(0.17/–), G09v1.40 H2O(211–202)(0.19/0.32), SDP11 H2O(202–111)(1.30/1.04), NCv1.268 H2O(211–202)(0.13/0.39) and NAv1.56 H2O(211–202)(0.53/1.02). |
In the Appendix, we describe the observational results of each source, including the lensing model, the H2O spectrum, mapping of the H2O and continuum emission (by showing low-resolution NOEMA H2O and continuum images), the ratio between velocity-integrated flux densities of different H2O transitions, and the comparison between H2O and CO emission.
Appendix A.1: G09v1.97 at z = 3.634
The galaxy G09v1.97 has the second largest redshift in our sample obtained by CARMA (Riechers et al., in prep.). In the SMA 880 μm image (B13), similar to SDP81 (ALMA Partnership, Vlahakis et al. 2015; Dye et al. 2015), it displays a triple arc structure with an angular size scale of ~2′′. However, there are two foreground deflectors at two different redshifts, making this complex mass distribution a very unusual case. B13 estimate a lensing amplification μ = 6.9 ± 0.6.
We have observed both para-H2O(211–202)and ortho-H2O(321–312)lines at 162 GHz and 251 GHz, respectively. The source is clearly unresolved at 162 GHz, but marginally resolved at 251 GHz as displayed in Fig. A.1. The ratio between the peak and the spatially integrated flux density of the continuum (Sν(ct)pk/Sν(ct)) is 0.95 ± 0.03 and 0.60 ± 0.01 at 162 GHz and 251 GHz, respectively. The H2O emission line peak to spatially integrated flux densiity ratio ( ) for J = 2 and J = 3 are 1.0 ± 0.2 and 0.5 ± 0.2, respectively. Therefore, the spatial concentrations of H2O and continuum image are in good agreement within the uncertainties.
Both the continuum and the H2O lines are well detected in this source. The two H2O lines are well fitted by single Gaussian profiles with similar linewidths (257 ± 27 and 234 ± 34 km s-1, Fig. 2 and Table 4). The difference in linewidth (23 km s-1) is smaller than the errors of the linewidth. Therefore, there is no significant difference between the spectra of the two transitions. The ratio between IH2O(321–312)and IH2O(211–202)is 0.91 ± 0.12, which is the lowest of our five detected sources in both lines. However, this ratio remains consistent with the observations of local galaxies (Y13, and Fig. 4), by taking the uncertainty into account.
From our CO line observations we find a line FWHM of ΔVCO = 224 ± 32 and 292 ± 86 km s-1 for the CO(5–4)and CO(6–5)lines, respectively, which are within 1σ to the H2O FWHMs. The observed ratio of IH2O /ICO for both the CO(5–4)and CO(6–5)lines, is about 0.4 with less than 25% uncertainty.
We have tentatively detected an H2O+ line in this source as well (see Sect. 5).
Appendix A.2: G12v2.43 at z = 3.127
The source is marginally resolved in the SMA 880 μm image (Fig. 2 of B13), with a size ~1.5′′, but there is no obvious strongly lensed structures such as multiple images. It is not yet possible to build a lensing model for this source because the search for a deflector by B13 has been unsuccessful.
Both para-H2O(202–111)and ortho-H2O(321–312)lines are well detected, as shown in Fig. A.1, and the source is unresolved, consistent with the SMA image. The ratios of Sν(ct)pk/Sν(ct) for 239 GHz and 282 GHz are 0.71 ± 0.02 and 0.87 ± 0.01, respectively, while the for H2O(202–111)and H2O(321–312)are 0.6 ± 0.2 and 1.0 ± 0.2, respectively.
The two H2O lines are both well fitted by a single Gaussian profile. The FWHMs are 201 ± 27 and 221 ± 20 km s-1 for para-H2O(202–111)and ortho-H2O(321–312), respectively. The difference is within the 1σ uncertainty.
The velocity-integrated flux density ratio of high-lying over low-lying H2O line of this source, IH2O(321–312) /IH2O(202–111) = 1.2 ± 0.2, which is slightly lower than that of Arp 220 as shown in Fig. 4. The linewidths of the H2O lines (201 ± 27 and 221 ± 20 km s-1) are the narrowest ones among our sources. The values are also very close to the CO(1–0)linewidth (210 ± 30 km s-1, Harris et al. 2012). Their similarity indicates that there is not likely any strong differential lensing effect between the CO and H2O emissions in this case.
Appendix A.3: NCv1.143 at z = 3.565
Having a redshift of z = 3.565 from CO observation by CARMA (Riechers et al., in prep.), this source is one of the brightest (at submm) in our sample. It is resolved by the SMA 880 μm beam (B13) with a size ~ 2′′, featured by two components at the northeast and southwest directions. With a single deflector, the lensing model estimates a magnification factor of μ = 6.9 ± 0.6.
As displayed in Fig. A.1, both the lines and the continuum are very strong and well detected. The ratio Sν(ct)pk/Sν(ct) = 0.86 ± 0.02 shows that the source is unresolved at 165 GHz (for observing para-H2O line 211–202 ). At 255 GHz, the ratios Sν(ct)pk/Sν(ct) = 0.55 ± 0.01 and  indicate that the source is partially resolved, consistent with the SMA result.
Both the H2O(202–111)and H2O(321–312)lines can be fitted by single Gaussian profiles. The ratio of IH2O(321–312) /IH2O(211–202) is 1.36 ± 0.13, close to the mean ratio found in the nearby star-forming-dominated galaxies (Y13, and Fig. 4). The linewidths of H2O(211–202)and H2O(321–312)are 293 ± 15 and 233 ± 22 km s-1, respectively. Although the former is larger, they are compatible within an uncertainty of 1.6σ. Also, the H2O linewidth agrees well with the CO(5–4)and CO(6–5)linewidths (273 ± 27 and 284 ± 27 km s-1, see Table 3). Therefore, the line ratios are unlikely to be affected by differential magnification. The observed ratio of IH2O /ICO is 0.4–0.5 and 0.6–0.7 (uncertainties are within 13%) for the J = 2 para-H2O and J = 3 ortho-H2O, respectively.
We have also detected ortho-H2O+(211–202) and ortho-H2O+(202–111) fine structure lines together with para-H2O(211–202)in this source. The further discussion of the H2O+ spectra and its interpretation are given in Sect. 5.
Appendix A.4: NAv1.195 at z = 2.951
As quoted in B13, the redshift of this source was first obtained by the CO observation (Harris et al., in prep.). Its SMA image shows a typical lensed feature with two components separated by ~2′′ along the northwest and southeast direction. The lensing model suggests a modest magnification factor μ = 4.1 ± 0.3.
We have robust detections of H2O(202–111)and the continuum emission at 250 GHz and 293 GHz (Fig. A.1). However, the H2O(321–312)line is at odds with the other five sources. Therefore, we only show the image of the dust continuum emission at this frequency in Fig. A.1. The source is clearly resolved into two components in the three images, and the northwest component is about 4 times stronger than the southeast one in the continuum images, in agreement with the SMA image (B13). For the continuum at 250 GHz, the peak to total integrated flux density ratio Sν(ct)pk/Sν(ct) = 0.54 ± 0.02, and for H2O(202–111), the ratio equals to 0.6 ± 0.3. Therefore, the spatial distributions of dust and the H2O emission are likely to be similar in this source. In the observation at 293 GHz, Sν(ct)pk/Sν(ct) = 0.42 ± 0.01, due to a smaller synthesis beam (Table 1).
Figure 2 shows the spectra corresponding to the two observations of NAv1.195. The H2O(202–111)line can be fitted by a single Gaussian profile, with a linewidth equal to 328 ± 51 km s-1. We have not detected the higher excitation H2O(321–312)line as mentioned above. By assuming the same linewidth as the lower− J H2O line, we can infer a 2σ detection limit of 2.56 Jy km s-1. This yields a flux ratio of H2O(321–312)/H2O(202–111) ≲ 0.6. This value is significantly lower than that in the five other sources where it ranges from 0.75 to 1.60 (errors are within 25%), but it remains close to the lowest values measured in local galaxies (Y13) as shown in Table 6 and Fig. 4. This low ratio of H2O lines probably originates from different excitation conditions, especially for the far-infrared radiation field, since the line H2O(321–312)is mainly populated through far-infrared pumping via absorbing 75 μm photons (see Sect. 5). The CO(5–4)line of the source has a linewidth of 281 ± 16 km s-1, which is comparable with the H2O line profile. The observed ratio of IH2O /ICO (CO(5–4)) is ≤0.4.
Appendix A.5: NAv1.177 at z = 2.778
NOEMA observation of the CO line in this source gives a redshift of z = 2.778 (Krips et al., in prep.). The SMA 880 μm image shows a compact structure with two peaks ~1′′ away along the eastwest direction, and the western component is the dominant one (Fig. 2 of B13). However, due to the absence of deflector in the foreground optical image from SDSS and lack of the deep optical and near-infrared images, the lensing properties are still unknown (B13).
As displayed in Fig. A.1, both the lines of H2O(202–111)and H2O(321–312)and the corresponding dust continuum are well detected. The ratios Sν(ct)pk/Sν(ct) are 0.75 ± 0.02 and 0.62 ± 0.01 for observation at 261 GHz and 308 GHz, respectively. One should notice that the direction of the synthesised beam is perpendicular to the alignment of the two components in the image, thus the source is marginally resolved in the H2O(202–111)and the corresponding dust continuum images. For the H2O(321–312)observation at higher frequency, we can see the partially resolved feature. The peak to total flux ratios of H2O are  and 0.6 ± 0.1 for the H2O(202–111)and H2O(321–312)lines, respectively, indicating similar spatial distribution compared with the dust emission.
The H2O spectra displayed in Fig. 2 show single Gaussian profiles with FWHM = 241 ± 41 and 272 ± 24 km s-1 (Table 4). The profiles of the two H2O lines are similar within the uncertainties. The line ratio, IH2O(321–312) /IH2O(202–111) = 1.34 ± 0.24. This value is close to that found in Arp 220 and it is the largest ratio in our sample. We have also detected the CO(3–2)and CO(5–4)lines using the IRAM 30 m telescope in this source (Table 3), the linewidth of CO is around 230 ± 16 km s-1 which is similar to the width of the detected H2O lines. The ratio of IH2O /ICO is from 0.5 to 1.1 with less than 20% uncertainties.
Appendix A.6: NBv1.78 at z = 3.111
The CO redshift of NBv1.78 was obtained by Riechers et al. (in prep.) via CARMA, z = 3.111, and the data of the H2O(202–111)line were obtained by O13. The source is resolved in the SMA 880 μm image (B13) with a somewhat complex morphology, and the size is ~2.5′′. There are three main components in the image. The two strong components located at northwest and southeast direction of the image, and the weakest component close to the southeast. The derived lensing magnification is μ = 13.5 ± 1.5, which is the second largest among our sample. In the near-infrared images, the source has a similar three-component Einstein ring-like structure with a slightly smaller magnification  (Calanog et al. 2014).
Our NOEMA images of both continuums and H2O lines as shown in Fig. A.1 are consistent with the SMA 880 μm image. The images are resolved into two main parts, while the southern component is extended along the western side. The continuum and H2O line images have fairly high S/N. From the observation of H2O(202–111)at 241 GHz (O13, note that this observation was performed at higher resolution with a 1.4″ × 1.0″ beam), the values of Sν(ct)pk/Sν(ct) and agree well, which are 0.42 ± 0.01 and 0.4 ± 0.1, respectively. The continuum image at 283 GHz gives Sν(ct)pk/Sν(ct) = 0.69 ± 0.01, and the image of H2O(321–312)gives 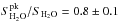 . The similarity of the peak to spatially integrated flux density ratios suggest that the spatial distribution of H2O and submm dust continuum are likely to be consistent. Additionally, the images of J = 2 and J = 3 images are also consistent within the uncertainty.
NBv1.78 has a very broad linewidth compared with the other sources. As shown in Fig. 2, the linewidth of H2O(202–111)and H2O(321–312)are 510 ± 90 and 607 ± 43 km s-1, respectively. The two lines have similar profiles. The source has a IH2O(321–312) /IH2O(202–111) ratio equal to 1, within the range of the local galaxies (Fig. 4). The CO(5–4)and CO(6–5)observations (Table 3) give linewidths of 614 ± 53 and 734 ± 85 km s-1, which are wider than the H2O lines. The observed ratio of IH2O /ICO is about 0.7 with less than 25% uncertainty for J = 2 H2O.
Appendix A.7: G09v1.40 at z = 2.093
A CO redshift of G09v1.40, z = 2.0894 was obtained by CSO/Z-Spec (Lupu et al., in prep.). But, through our H2O observation, we find a redshift of z = 2.093. Our value is consistent with the CO(3–2)observation by Riechers et al. (in prep.), and we have adopted this value. SMA observation of the 880 μm dust continuum shows two close components with a separation of ~1′′ along the east and west direction. The lensing model estimates μ = 15.3 ± 3.5, which is the largest magnification in our sample. The Keck near-infrared image of the source suggests a magnification of  for the stellar component (Calanog et al. 2014).
The H2O(211–202)line is well detected as well as the corresponding dust continuum. As shown by the images of the H2O and dust continuum (Fig. A.1), the source is partially resolved by the synthesised beam. The two component (east and west) structure is consistent with the 880 μm image, and the western component is stronger than the eastern one. Both ratios of Sν(ct)pk/Sν(ct) and are found to be 0.6 (uncertainty <13%). However, the eastern component is not detected in the H2O image.
The H2O(211–202)line can be fitted with a single Gaussian profile with a FWHM of 277 ± 14 km s-1 (Fig. 2). However, the line has a steeper decline on the red side of the spectrum. The CO(4–3)observation gives a linewidth of 198 ± 51 km s-1, which is 0.7 ± 0.2 times narrower than that of the H2O line. The velocity-integrated flux density of the H2O is larger than that of the CO(4–3)in this source with a ratio of IH2O /ICO = 1.1 ± 0.3.
Appendix A.8: SDP11 at z = 1.786
The CO observation by Lupu et al. (2012) found z = 1.786. The SMA 880 μm image displays a typical strongly lensed morphology with two components, north and south, respectively. The size of the source is ~2′′. The gravitational magnification estimated by B13 is μ = 10.9 ± 1.3.
As shown in Fig. A.1, the source is partially resolved. The dust continuum image shows an extended structure along the north and south direction, with the brightest peak in the northern part. The noisy images are consistent with the SMA 880 μm observation. The ratio of Sν(ct)pk/Sν(ct) is 0.56 ± 0.03. The image shows two distinctive components in the north and south direction. This structure also agrees with the high resolution SMA 880 μm image. Additionally, 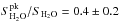 suggests that the H2O image is slightly resolved compared with the dust emission. This diffierence may come from their different spatial distribution.
Although the noise level of its spectrum is the highest among our sources because of the high frequency, namely 355 GHz, the H2O(202–111)line is marginally detected with S/N = 4.6. The linewidth is 214 ± 41 km s-1 (Fig. 2).
Appendix A.9: NCv1.268 at z = 3.675
The redshift of NCv1.268 was obtained by the CO observation of Krips et al. (in prep.). A typical strongly lensed morphology was found by the SMA 880 μm observation (B13), with a strong arc-like component in the south direction. The structure has a size ~2.5′′. The B13 lensing model estimates μ = 13.0 ± 1.5.
The source is marginally resolved by the NOEMA synthesis beam (Fig. A.1). When comparing the flux ratios between the dust and H2O emission from the peak and the spatially integrated values, they give Sν(ct)pk/Sν(ct) = 0.66 ± 0.01 and  . The values of dust emission and the H2O image are in good agreement.
NCv1.268 is the only source in which we have detected a double-peaked line profile from our new observations, with a slightly stronger blue velocity component (Fig. 2). The total linewidth is very large, 731 ± 75 km s-1.
Appendix A.10: NAv1.56 at z = 2.301
Harris et al. (2012) give a CO redshift of z = 2.3010 for this source. The SMA 880 μm dust continuum image shows a classic strongly lensed morphology with multiple images. It consists of an arc-like component in the western direction and a point-like component toward the east. They are separated ~2′′. The lens model implies that the magnification factor μ = 11.7 ± 0.9 (B13).
As shown in Fig. A.1, the source is marginally resolved, with an extended morphology in the eastern part. The structures displayed in the dust and H2O images are similar. The ratios Sν(ct)pk/Sν(ct) = 0.62 ± 0.03 and also suggest their similarity within the errors. Most of the fluxes are concentrated in the western part, which agrees with the SMA 880 μm image.
The H2O(211–202)line can be fitted by a single Gaussian with a large linewidth equal to 593 ± 56 km s-1. The CO(4–3)line observation by NOEMA (Oteo et al., in prep.) gives a linewidth of 621 ± 47 km s-1. The linewidths of CO and H2O are in very good agreement. Our noisy detection of CO(5–4)at IRAM 30 m (Table 3) gives a ratio of IH2O /ICO = 0.8 ± 0.3.
Appendix A.11: G09v1.124 at z = 2.410
The redshift of this source is measured by CO observation (Harris et al. 2012). This multiple source, with two main components, each with intrinsic LIR> 1013 L⊙, separated by 10′′ (Fig. A.1), was studied in detail by (Ivison et al. 2013, see also B13 and Oteo et al., in prep.). It is special in our sample since the two main sources are from two very different HyLIRGs rather than multiple images of a single source generated by strong gravitational lensing. The eastern component G09v1.124-W, which contains a powerful AGN (Oteo et al., in prep.), is unlensed and the western component G09v1.124-T is only weakly lensed with a magnification factor μ = 1.5 ± 0.2. Thus, throughout the discussions, we treat G09v1.124-W and G09v1.124-T as two distinct sources (see Tables 2, 4, 5 and 6).
Probably because of this too small lensing magnification and the smaller values of each μLIR (Table 2), we have only detected the dust continuum emission in this source. The H2O(211–202)line is undetected. The 2σ upper limits of the velocity-integrated flux density of the H2O(211–202)line show that the values of IH2O are more than three times smaller than in the other sources. As seen in Table 4 and Fig. 3, the ratio LH2O /LIR is smaller than all our other sources for G09v1.124-W, probably because of its strong AGN. However, for G09v1.124-T this ratio, albeit small, might be comparable to that of G09v1.97. The dust continuum at 221 GHz follows the same structure as the previously published observations (Fig. A.1 and Ivison et al. 2013). Both the eastern component (W) and the western one (T) are marginally resolved by the synthesised beam. The peak to total continuum flux ratios are Sν(ct)pk/Sν(ct) = 0.84 ± 0.03 and 0.83 ± 0.04, respectively.
Appendix B: H2O+ detections in local ULIRGs
The study using the Herschel SPIRE/FTS spectra of 167 local galaxies has revealed several emission and absorption lines of H2O+, which are ortho-H2O+ lines 211–202 (5/2−5/2), 202–111 (5/2−3/2), 111–000 (3/2−1/2), 111–000 (1/2−1/2) (Y13, see also Table B.1). All J ≥ 2 H2O+ lines are in emission. Table B.1 gives values of the H2O+ flux and luminosity for those among the Y13 sample where H2O+ lines are (tentatively) detected with S/N≳ 2.5. However, for the H2O+(111–000) lines which connect the ground state, they are often found to be in emission in AGN-dominated sources while they are in absorption in star-forming-dominated ones. A full description of the dataset for this Herschel SPIRE/FTS survey will be given in Liu et al. in prep. At high-redshift prior to our study, the J = 2 ortho-H2O+ doublet lines seem to have only been tentatively detected in two sources, SPT0346-52 (Weiß et al. 2013) and HFLS3 (Riechers et al. 2013).
Beam-matched H2O+, H2O line and infrared luminosities from local detections (Herschel SPIRE/FTS archive) and high-redshift Herschel lensed galaxies.
All Tables
IR luminosity, H2O line luminosity and global dust temperature of the entire sample.
Ratio between infrared and H2O luminosity, and the velocity-integrated flux density ratio between different H2O transitions.
Observed ortho-H2O+ fine structure line parameters of the high-redshift H-ATLAS lensed HyLIRGs.
Beam-matched H2O+, H2O line and infrared luminosities from local detections (Herschel SPIRE/FTS archive) and high-redshift Herschel lensed galaxies.
All Figures
|
Fig. 1 Energy level diagrams of H2O and H2O+ shown in black and red, respectively. Dark blue arrows are the submm H2O transitions we have observed in this work. Pink dashed lines show the far-infrared pumping path of the H2O excitation in the model we use, with the wavelength of the photon labeled. The light blue dashed arrow is the transition from para-H2O energy level 220 to 211 along the cascade path from 220 to 111. Rotational energy levels of H2O and H2O+, as well as fine structure component levels of H2O+ are also shown in the figure. |
| In the text | |
|
Fig. 2a Spatially integrated spectra of H2O in the six sources with both J = 2 para-H2O and J = 3 ortho-H2O lines observed. The red lines represent the Gaussian fitting to the emission lines. The H2O(202–111)spectrum of NBv1.78 is taken from O13. Except for H2O(321–312)in NAv1.195, all the J = 2 and J = 3 H2O lines are well detected, with a high S/N and similar profiles in both lines for the same source. |
| In the text | |
|
Fig. 2b Spatially integrated spectra of H2O of the five sources with only one J = 2 para-H2O line observed. The red lines represent the Gaussian fitting to the emission lines. Except for the H2O line in G09v1.124, all the J = 2 H2O lines are well detected. |
| In the text | |
|
Fig. 3 Correlation between LIR and LH2O in local ULIRGs and high-redshift Hy/ULIRGs. The black points represent local ULIRGs from Y13. The blue points with solid error bars are the H-ATLAS source in this work together with some previously published sources. Red points with dashed error bars are excluded from the fit as described in the text. Upper limits are shown in arrows. The light blue lines show the results of the fitting. The insets are the probability density distributions of the fitted slopes α. We find tight correlations between the luminosity of the three H2O lines and LIR , namely LH2O∝LIR1.1−1.2. |
| In the text | |
|
Fig. 4 Velocity-integrated flux density distribution of H2O normalised to IH2O(202–111)adapted from Y13. Local averaged values are shown in black dashed line and marks. Among them, AGN-dominated sources are shown in red and star-forming dominated galaxies are shown in blue. Some individual sources are also shown in this plot as indicated by the legend. Green diamonds are the high-redshift lensed Hy/ULIRGs from this work. HFLS3 is a z = 6.3 high-redshift galaxy from Riechers et al. (2013). |
| In the text | |
|
Fig. 5 Parameter space distribution of the H2O far-infrared pumping excitation modelling with observed para-H2O 202–111 or 211–202and ortho-H2O(321–312)in each panel. ±1σ contours are shown for each plot. Different colours with different line styles represent different temperature components of the warm dust as shown in the legend. The explored warm dust temperature range is from 35 K to 115 K. The temperature contours that are unable to fit the data are not shown in this figure. From the figure, we are able to constrain the τ100, Twarm and NH2O /ΔV for the five sources. However, there are strong degeneracies. Thus, we need additional information, such as the velocity-integrated flux densities of J ≥ 4 H2O lines, to better constrain the physical parameters. |
| In the text | |
|
Fig. 6 Left panel: from top to bottom are the full NOEMA spectrum at νrest ~ 750 GHz of NCv1.143, G09v1.97 and G15v2.779, respectively. The reference frequency is the redshifted frequency of the line H2O(211–202). The frequencies of the main H2O+(211–202) (5/2−5/2) and H2O+(202–111) (5/2−3/2) lines are indicated by grey vertical dashed lines. The three dashed squares in the spectrum of NCv1.143 show the position of each zoom-in spectrum of the H2O+ (or the H |
| In the text | |
|
Fig. 7 Correlation between the luminosity of J = 2 ortho-H2O+ and para-H2O(211–202). The fitted function is LH2O+∝LH2Oα. We found a very good correlation between LH2O+ and LH2O with a slope close to one. Black points are from the local ULIRGs as listed in Table B.1. Dark blue ones are high-redshift starbursts from this work. Black solid lines indicate the χ2 fitting results while the grey dashed lines and the grey annotations represent the average ratio between the LH2O+ and LH2O . |
| In the text | |
|
Fig. A.1 Mapping of the H2O emission lines and the corresponding continuum emission (frequencies have been shown accordingly in the white text) in the sources with both para J = 2 and ortho J = 3 H2O lines observed. The contours of the continuum emission start from 6σ in step of 10σ, and the contours of the H2O emission start from 3σ in step of 1σ. Asymmetric negative contours are shown in white dashed lines. For each observation, the 1σ contours for the continuum (mJy beam-1) and the H2O emission line (Jy km s-1 beam-1) are as follows: G09v1.97 H2O(211–202)(0.17/0.57), G09v1.97 H2O(321–312)(0.25/0.38), G12v2.43 H2O(202–111)(0.29/0.48), G12v2.43 H2O(321–312)(0.30/0.53), NCv1.143 H2O(211–202)(0.16/0.36) and NCv1.143 H2O(321–312)(0.42/0.72). |
| In the text | |
|
Fig. A.2 (See Fig. A.1 caption.) For each observation, the 1σ contour for the continuum (mJy beam-1) and the H2O emission line (Jy km s-1 beam-1) are as follows: NCv1.195 H2O(202–111)(0.34/0.51), NCv1.195 H2O(321–312)(0.48/–), NAv1.177 H2O(202–111)(0.58/0.65), NAv1.177 H2O(321–312)(0.38/0.58), NBv1.78 H2O(202–111)(0.28/0.30), NBv1.78 H2O(321–312)(0.21/0.29). |
| In the text | |
|
Fig. A.3 (See Fig. A.1 caption.) For each observation, the 1σ contour for the continuum (mJy beam-1) and the H2O emission line (Jy km s-1 beam-1) are as follows: G09v1.124 H2O(211–202)(0.17/–), G09v1.40 H2O(211–202)(0.19/0.32), SDP11 H2O(202–111)(1.30/1.04), NCv1.268 H2O(211–202)(0.13/0.39) and NAv1.56 H2O(211–202)(0.53/1.02). |
| In the text | |
Current usage metrics show cumulative count of Article Views (full-text article views including HTML views, PDF and ePub downloads, according to the available data) and Abstracts Views on Vision4Press platform.
Data correspond to usage on the plateform after 2015. The current usage metrics is available 48-96 hours after online publication and is updated daily on week days.
Initial download of the metrics may take a while.