Fig. 7
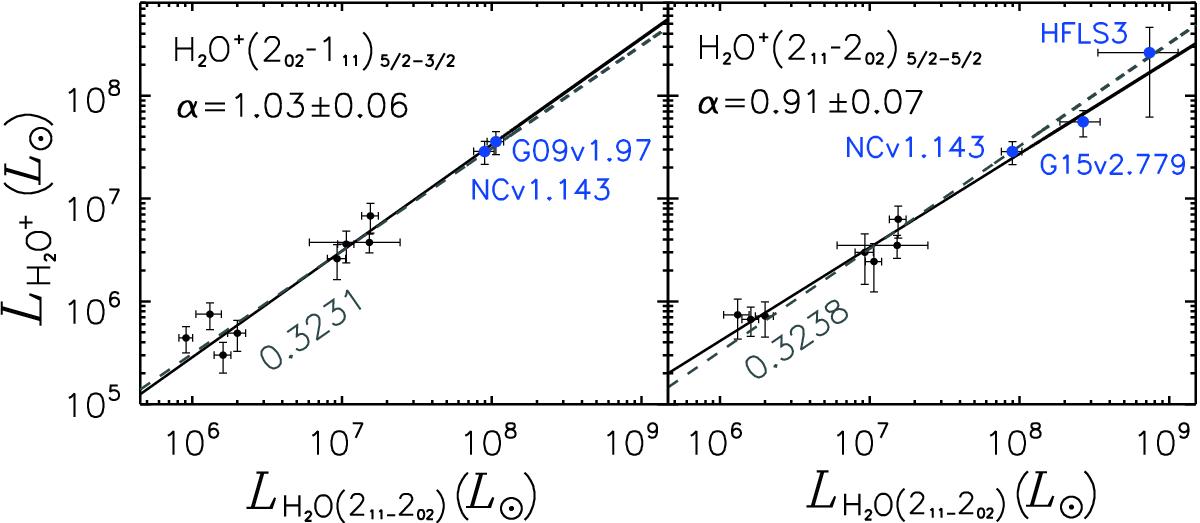
Correlation between the luminosity of J = 2 ortho-H2O+ and para-H2O(211–202). The fitted function is LH2O+∝LH2Oα. We found a very good correlation between LH2O+ and LH2O with a slope close to one. Black points are from the local ULIRGs as listed in Table B.1. Dark blue ones are high-redshift starbursts from this work. Black solid lines indicate the χ2 fitting results while the grey dashed lines and the grey annotations represent the average ratio between the LH2O+ and LH2O .
Current usage metrics show cumulative count of Article Views (full-text article views including HTML views, PDF and ePub downloads, according to the available data) and Abstracts Views on Vision4Press platform.
Data correspond to usage on the plateform after 2015. The current usage metrics is available 48-96 hours after online publication and is updated daily on week days.
Initial download of the metrics may take a while.