| Issue |
A&A
Volume 666, October 2022
|
|
|---|---|---|
| Article Number | L3 | |
| Number of page(s) | 9 | |
| Section | Letters to the Editor | |
| DOI | https://doi.org/10.1051/0004-6361/202244700 | |
| Published online | 29 September 2022 | |
Letter to the Editor
Importance of radiative pumping for the excitation of the H2O submillimeter lines in galaxies
1
Universidad de Alcalá, Departamento de Física y Matemáticas, Campus Universitario, 28871 Alcalá de Henares, Madrid, Spain
e-mail: This email address is being protected from spambots. You need JavaScript enabled to view it.
2
George Mason University, Department of Physics & Astronomy, MS 3F3, 4400 University Drive, Fairfax, VA 22030, USA
3
Instituto de Física Fundamental (IFF), CSIC. Calle Serrano 121-123, 28006 Madrid, Spain
4
Department of Earth and Space Sciences, Chalmers University of Technology, Onsala Observatory, 439 94 Onsala, Sweden
5
Centro de Astrobiología (CSIC-INTA), Ctra. de Ajalvir, km. 4, 28850 Torrejón de Ardoz, Madrid, Spain
Received:
5
August
2022
Accepted:
13
September
2022
Abstract
H2O submillimeter emission is a powerful diagnostic of the molecular interstellar medium in a variety of sources, including low- and high-mass star-forming regions of the Milky Way, and from local to high-redshift galaxies. However, the excitation mechanism of these lines in galaxies has been debated, preventing a basic consensus on the physical information that H2O provides. Radiative pumping due to H2O absorption of far-infrared photons emitted by dust and collisional excitation in dense shocked gas have both been proposed to explain the H2O emission. Here we propose two basic diagnostics to distinguish between the two mechanisms: First, the ortho-H2O 321 − 212 75 μm and the para-H2O 220 − 111 101 μm rotational lines in shock-excited regions are expected to be in emission, while when radiative pumping dominates, the two far-infrared lines are expected to be in absorption. Second, the radiative pumping scenario predicts, based on the statistical equilibrium of H2O level populations, that the apparent isotropic net rate of far-infrared absorption in the 321 ← 212 (75 μm) and 220 ← 111 (101 μm) lines should be higher than or equal to the apparent isotropic net rate of submillimeter emission in the 321 → 312 (1163 GHz) and 220 → 211 (1229 GHz) lines, respectively. Applying both criteria to all 16 galaxies and several Galactic high-mass star-forming regions in which the H2O 75 μm and submillimeter lines have been observed with Herschel/PACS and SPIRE, we show that in most (extra)galactic sources, the H2O submillimeter line excitation is dominated by far-infrared pumping, combined in some cases with collisional excitation of the lowest energy levels. Based on this finding, we revisit the interpretation of the correlation between the luminosity of the H2O 988 GHz line and the source luminosity in the combined Galactic and extragalactic sample.
Key words: radiative transfer / line: formation / ISM: molecules / galaxies: ISM / infrared: galaxies / submillimeter: galaxies
© E. González-Alfonso et al. 2022
 Open Access article, published by EDP Sciences, under the terms of the Creative Commons Attribution License (https://creativecommons.org/licenses/by/4.0), which permits unrestricted use, distribution, and reproduction in any medium, provided the original work is properly cited.
This article is published in open access under the Subscribe-to-Open model. This email address is being protected from spambots. You need JavaScript enabled to view it. to support open access publication.
1. Introduction
Soon after the launch of the Herschel Space Observatory (Pilbratt et al. 2010), spectroscopic observations with the SPIRE instrument (Griffin et al. 2010) revealed strong H2O submillimeter (hereafter submm) emission from the ultraluminous infrared galaxy (ULIRG) Mrk 231, with strengths comparable to the those of the CO lines (van der Werf et al. 2010). The H2O submm lines were subsequently detected in a variety of local galaxies with SPIRE (see Yang et al. 2013; Lu et al. 2017, and references therein) and HIFI (Liu et al. 2017), as well as in high-redshift ULIRGs and hyper-LIRGs from ground-based facilities (e.g., Omont et al. 2011, 2013; van der Werf et al. 2011; Yang et al. 2016, 2019). Based on the H2O line fluxes in galaxies at all redshifts, Omont et al. (2013) and Yang et al. (2013) found a strong correlation, 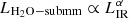 , between the H2O line luminosities and the infrared (IR) luminosities of the galaxies, with an index α slightly higher than unity. The extragalactic H2O submm emission has been modeled in terms of radiative pumping (González-Alfonso et al. 2010, 2014, 2021; Pereira-Santaella et al. 2017), and the LH2O − submm − LIR correlations appeared to support this view (Omont et al. 2013; Yang et al. 2013; Lu et al. 2017).
In parallel, several H2O submm lines have been observed in a large number of both low-mass and high-mass star-forming regions (LMSFR and HMSFRs) in our Galaxy (e.g., van Dishoeck et al. 2021, and references therein) with the HIFI instrument (de Graauw et al. 2010). The lines were resolved with the high spectral resolution provided by HIFI, showing broad profiles characteristic of outflows and their associated dense shocked gas in which the H2O submm emission is excited by collisions. The H2O line profiles also often showed a narrower spike at central velocities, which contributes negligibly (often in absorption) to the integrated emission in LMSFRs (e.g., Kristensen et al. 2012), but accounts for ∼40% on average in HMSFRs (San José-García et al. 2016) and is attributed to the warm, massive envelopes around the luminosity sources. Considering both Galactic and extragalactic sources, San José-García et al. (2016) found a strong LH2O − submm − LIR correlation with an index α that was higher (and closer to unity) than when only the Galactic sources were fitted.
Using Infrared Space Observatory (ISO, Kessler et al. 1996) data (with 80″ aperture) and radiative transfer models, Cernicharo et al. (2006) found that much of the H2O line excitation in the Orion KL outflow is driven by the dust continuum radiation. On the other hand, van Dishoeck et al. (2021) argued, based on the nearly linear (α = 0.95 ± 0.02) correlation they found between Herschel H2O 202 − 111 988 GHz line luminosities of both Galactic and extragalactic sources vs. source luminosity, that the H2O submm emission in galaxies may be a scaled-up version of Galactic sources, where the LH2O − submm − LIR correlation is set by H2O collisional excitation in dense shocks.
In this Letter we address this lack of consensus on the excitation mechanism of these lines in galaxies, and thus on the physical information that H2O provides on the sources from which the H2O emission lines arise. We propose both a qualitative and a quantitative diagnostic to distinguish between the two mechanisms, each involving the far-infrared (far-IR) H2O 321 − 212 75 μm and 220 − 111 101 μm lines, and apply them to all extragalactic sources and a sample of HMSFRs where the H2O 75 μm and 1163 GHz lines have been observed with Herschel/PACS (Poglitsch et al. 2010) and SPIRE, respectively. A flat ΛCDM cosmology with H0 = 70 km s−1 Mpc−1 and ΩM = 0.27 is adopted, but for some nearby galaxies preferred distances are used.
2. Diagnostics
The simplified energy level diagram of Fig. 1a illustrates the basic mechanism of radiative pumping: if a 75 μm photon emitted by dust pumps an ortho-H2O molecule from the 212 level to the 321 one, it can relax via cascade down along the 321 → 312 → 303 → 212 ladder through emission in the corresponding 1163, 1097, and 1717 GHz lines. Likewise, a pumping event in the para-H2O 220 ← 111 101 μm line followed by cascade down along the 220 → 211 → 202 → 111 ladder generates H2O emission in the 1229, 752, and 988 GHz lines. These can be denoted as “radiative pumping cycles”, and always involve the loss of a continuum photon in the 75 and 101 μm pumping lines. Assuming that the absorption is isotropic, the 75 and 101 μm pumping lines will be seen in absorption. On the other hand, if H2O is collisionally excited (e.g., in dense shocks), the 321 and 220 levels will be populated accordingly and subsequent spontaneous emission in the 321 → 212 and 220 → 111 transitions will generate emission, rather than absorption, in both the 75 and 101 μm lines. We can then establish the first qualitative criterion to distinguish between radiative pumping and collisional excitation of the H2O submm lines assuming isotropy: in the former case, the 75 and 101 μm lines are expected in absorption, while in the latter case they are expected in emission.
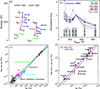 |
Fig. 1. H2O submillimeter emission line relationships. (a) Simplified energy level diagram of ortho- and para-H2O, illustrating the radiative pumping mechanism of H2O submillimeter emission (Sect. 2). (b) Spectral line energy distribution of the H2O submillimeter lines, normalized to the flux of the 321 → 312 line, in eight extragalactic sources in which the pumping ortho-H2O 321 ← 212 line at 75 μm has been observed, compared with the SLED in the LMSFR Serpens SMM1 (Goicoechea et al. 2012). The flux of undetected lines is set to 0. (c) Luminosity of the H2O 202 → 111 988 GHz line as a function of the source IR luminosity for the extragalactic sources considered in this paper (red circles; open circles indicate 3σ upper limits) and the Galactic low-mass and high-mass star-forming regions (black and magenta circles, respectively, taken from the Water Emission Database; Dutkowska & Kristensen 2022; https://katarzynadutkowska.github.io/WED/). The light blue symbols isolate the contribution to LH2O 988 GHz by the envelopes of HMSFRs. The green line shows the best-fit power-law function to all Galactic and extragalactic sources found by van Dishoeck et al. (2021), with an index of 0.95 ± 0.02, and the blue line shows the fit found by Yang et al. (2013) to the extragalactic sources alone, with an index of 1.12. (d) Same as (c), but zoomed-in on the extragalactic sources. The luminosity of the H2O 321 → 312 1163 GHz line is added in blue. The red and blue lines show the fits by Yang et al. (2013). |
Caveats on the above diagnostic are related to geometry effects. Shock-excited gas could be in front of a strong continuum source that could ultimately generate line absorption at 75 and 101 μm in the direction of the observer. However, since Tgas and nH2, which determine the excitation in shocks, are fully decoupled from the properties of the continuum source behind (and specifically Tgas > Tdust), fine tuning of the shock model would be required to obtain the absorption/emission pattern. On the other hand, lack of absorption in the 75 and 101 μm lines does not fully preclude the radiative pumping mechanism because the far-IR field responsible for the excitation might be external and might not impinge on the H2O molecules from the far side (in the direction of the observer), and hence would not produce line absorption (Appendix A in González-Alfonso et al. 2014).
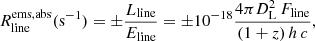
A quantitative criterion for radiative pumping arises from the statistical equilibrium of the H2O levels: Because the populations of the 321 and 220 levels remain constant in time, and when we assume that their populations are exclusively determined by the above pumping cycles, the net rate of absorption events in the 321 ← 212 75 μm line (hereafter  ) must be equal to the net rate of emission events in the 321 → 312 1163 GHz line (
 ). Likewise, this equality holds for the para-H2O pumping cycle,
 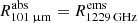 . We calculated
  in the limit of optically thin continuum emission at 75(101) μm and isotropic line absorption and emission,
 (1)
(1)
where Eline = hν0 is the energy of the line photons, DL is the luminosity distance, z is the redshift, h is the Planck constant, c is the speed of light, and Lline and Fline are the line luminosity in erg s−1 and line flux in Jy km s−1 above (emission, + sign) or below (absorption, − sign) the continuum (DL, h, and c are in cgs units).
Equation (1) holds if the H2O 75(101) μm line is optically thick if it remains effectively optically thin such that repeated absorption and re-emission events in the line end with the photon either escaping from the source (without a contribution to  ) or generating a submm cascade (contributing to both
  and
and  ). However, if the far-IR continuum optical depth becomes significant, thermal continuum photons emitted at 75(101) μm will have a higher chance, after multiple line absorption and re-emission events, of being absorbed by dust grains before escaping from the source, generating absorption in the far-IR line without a submm line counterpart. In very optically thick regions (with continuum optical depths at 100 μm τ100 ≫ 1, as were found in a number of (U)LIRGs), the emission in the submm lines will be partially extincted and might even be observed in absorption. As τ100 increases, additional radiative paths (de)populating the 321 and 220 levels begin to play a role, but the overall general result is that the absorption fluxes of the 75 and 101 μm surface tracers are increased relative to the emission fluxes of the 1163 and 1229 GHz volume tracers. Therefore, in case of significant far-IR continuum optical depth effects, the
  rates calculated in Eq. (1) are only apparent, and we can more generally state that
 (2)
(2)
are criteria for the radiative pumping mechanism in isotropic conditions. Anisotropy effects of the exciting radiation field could favor either  or
or  , and would spread their relative values for randomly oriented sources.
The base levels from which the radiative pumping cycles operate, 212 and 111, must still be populated in some way. They could be populated via absorption of dust-emitted photons in the 212 ← 101 179 μm and 111 ← 000 269 μm ground-state lines, but this mechanism may be inefficient in optically thin τ100 < 1 sources where the dust emission at these wavelengths is weak. At very high redshift, H2O excitation from the ground-state can also be produced by the cosmic microwave background (Riechers et al. 2022). Alternatively, the base levels could be excited through collisions in warm and dense regions, so that collisional excitation of the low-excitation lines combined with the radiative pumping mechanism would be required to account for the submm emission (González-Alfonso et al. 2014).
3. Results
3.1. Extragalactic and Galactic samples
The crucial diagnostics for distinguishing between radiatively and collisionally excited H2O submm emission rely on sensitive observations at 75 and 101 μm. We have applied them to all galaxies that have PACS observations covering the 75 μm line. This yielded a sample of 16 sources1. Line fluxes and details of the flux derivations will be presented in a forthcoming paper (Fischer et al., in prep.). Unfortunately, the PACS gap at ∼100 μm precluded observations covering the 101 μm line with Herschel in all galaxies but Mrk 231 (due to its redshift). This line, however, was detected with ISO in Arp 220 (Fischer et al. 2014).
The Galactic sample includes six well-known HMSFRs for which Herschel/PACS and SPIRE observations of the H2O 75 μm and 1163 GHz lines are available: W31C and W49N (Gerin et al. 2015), W51 (Karska et al. 2014a), Sgr B2(M) and (N) (Etxaluze et al. 2013), and the Orion KL outflows (Goicoechea et al. 2015). In addition, the circumnuclear disk (CND) around Sgr A* (Goicoechea et al. 2013) was added. The flux of the H2O 75 μm line in this sample was extracted from the central 3 × 3 spaxels of PACS (≈30″ × 30″). In Orion KL, we also measured the line flux in the direction of the hot core (hereafter HC; a very bright far-IR continuum source with a size of ∼10″) within the central spaxel (≈10″ × 10″), of the H2 Peak 1 shocked-gas position (≈30″ × 30″), and of Orion KL within a larger field of view (FoV of ≈120″ × 120″). The flux of the 1163 GHz line was extracted from similar apertures. The line profiles are displayed in Appendix A.
Our extragalactic sample includes a variety of well-known local (U)LIRGs: a quasi-stellar object (Mrk 231), active galactic nuclei (AGNs) such as IRAS 05189−2524, NGC 1068, NGC 7469, NGC 4945, IRAS 08572+3915, and NGC 6240 (the latter with strong CO emission associated with shocks; see Meijerink et al. 2013), (U)LIRGs with a compact obscured nucleus (NGC 4418, Arp 299a, Zw 049.057, ESO 320−G030, Mrk 273, Arp 220, and IRAS 17208−0014), and starburst galaxies (NGC 253 and IRAS 13120−5453). As delineated by the equivalent width of the OH 65 μm doublet (Fischer et al. 2014; González-Alfonso et al. 2015), the far-IR molecular absorption features are generally weak (EQW(OH 65 μm) < 20 km s−1) while the emission in the atomic and ionic fine-structure lines is usually strong in six galaxies (NGC 1068, NGC 7469, NGC 253, NGC 6240, IRAS 13120−5453, and NGC 4945). They are referred to as emission-dominated galaxies (EDGs). The remaining galaxies (with EQW(OH 65 μm) > 20 km s−1) have stronger far-IR molecular absorption features and are referred to as absorption-dominated galaxies (ADGs).
The extragalactic H2O submm spectral line energy distributions (SLEDs), in which the line fluxes are normalized to that of the 321 → 312 1163 GHz line (Fig. 1b), show a rather common U-shaped pattern for the low-excitation (Eup ≲ 300 K) lines: The 1163 GHz line is usually the strongest line, followed by the 988 GHz line, except in NGC 1068, NGC 6240, and probably NGC 7469, in which this order is reversed. This strongly suggests that there is a common dominant excitation mechanism in all sources, but with variations. By contrast, the submm SLED in the LMSFR Serpens SMM1 (a template of collisional excitation in dense shocked gas; e.g., Goicoechea et al. 2012) looks different: The fluxes of the para- and ortho- lines sharply decrease with increasing Eup.
Figure 1c shows that most of the targets lie close to the LH2O − 988 GHz − LIR correlations found by Yang et al. (2013; for extragalactic sources) and van Dishoeck et al. (2021; for Galactic and extragalactic sources), and can thus be considered a representative sample of (mostly) (U)LIRGs. A closer inspection (Fig. 1d) reveals that NGC 7469 and NGC 1068 have high deficits in the emission of the H2O 988 GHz (202 − 111) and mostly the 1163 GHz (321 − 312) lines relative to the best global LH2O − LIR fit by Yang et al. (2013), with departures of ≳3. Together with NGC 6240, these sources also have the lowest 1163 GHz/988 GHz flux ratio.
3.2. Qualitative criterion
Of the 16 galaxies, 14 (87%) show the H2O 75 μm far-IR line in absorption (and the 101 μm line in Mrk 231 and Arp 220). The other two sources, NGC 1068 and NGC 7469, are ambiguous because the 75 μm is not detected at the 3σ level. The 75 μm spectrum of NGC 1068 is displayed in Appendix C, showing indications of a P Cygni profile in which the blueshifted negative flux nearly cancels out the redshifted positive flux.
In Galactic HMSFRs, the H2O 75 μm line is observed in absorption in all sources except for Orion KL (Fig. A.1). In Orion KL, the nature of the line depends on the specific observed region and FoV: the 75 μm line is observed in absorption toward the HC within the central PACS spaxel, but shows a P Cygni profile or is observed in emission for larger FoVs and toward Peak 1 (Fig. A.1).
By contrast, observations of low-mass class 0 and I and intermediate-mass protostars in which H2O is collisionally excited in shocks show the H2O far-IR lines (including the 75 μm line when observed, and with the exception of the 179 μm line in some sources) in emission (Herczeg et al. 2012; Goicoechea et al. 2012; Karska et al. 2014b, 2018; Matuszak et al. 2015).
3.3. Quantitative criterion
Figure 2a shows  as a function of
  for the two samples, and Fig. 2b zooms in on the extragalactic sources. We categorize the galaxies in this plane into three groups according to the
  ratio (see also the upper insert of Fig. 2a): G1: 9 galaxies show r > 1.4; G2: 5 sources lie within the calibration uncertainties close to the
  line (0.6 < r < 1.4); and G3: 2 galaxies, NGC 1068 and NGC 7469, have only upper limits in
  and show much higher
  . With the exception of Zw 049.057, all ADGs belong to G1, so that the plane of Fig. 2 can be used to distinguish between ADGs and EDGs from the observation of only two lines. On the other hand, most of the Galactic HMSFRs of our sample except for Orion KL lie close to the
  line, with values ranging from 0.34 (W51) to 1.4 (SgrB2(M)), and can thus be classified as belonging to G2. Orion HC shows an excess of
  similar to G1 sources, but when the FoV increases (KL 30″ × 30″ and 2′ × 2′) or toward Peak 1,
  becomes negative (i.e., it is observed in emission; see the lower insert in Fig 2a).
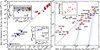 |
Fig. 2. Quantitative diagnostic of the radiative pumping mechanism. (a) Plot of |


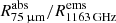
Overall, most of the (U)LIRGs and HMSFRs observed in the H2O 75 μm line (nearly) follow the prediction of Eq. (2) over nine orders of magnitude in  , indicating that far-IR pumping is the essential ingredient for understanding the H2O submm emission, and specifically, it dominates the observed H2O 321 − 312 1163 GHz emission (and thus also the 312 − 303 1097 GHz emission) in the majority of sources. In some galaxies and HMSFRs, there is an excess of submm emission over far-IR absorption (
 ), which might either reflect a contribution to the submm line flux by shock-excited H2O or specific geometrical effects.
Multicomponent model fits to the emission and absorption fluxes of the SPIRE and the PACS H2O lines, and including the far-IR spectral energy distribution (SED), have been performed for most galaxies of our sample following the approach described in González-Alfonso et al. (2021; they will be presented in a forthcoming paper). Classification of the best-fit model components of each galaxy as optically thin when the optical depth of the continuum at 100 μm is lower than 1 (τ100 < 1) and as optically thick if τ100 ≥ 1 shows in Fig. 2b that the τ100 < 1 components (in gray) lie close to the  line, as expected, while the optically thick components (in blue) predict weak emission in the 1163 GHz line, and the line even appears in absorption in some extreme nuclei. The ADGs have
  because buried components generate strong absorption in the H2O 75 μm, but little emission in the submm lines due to high continuum brightness and extinction in the submm. The submm lines, in contrast, are formed in optically thin (or moderately thick) and more extended regions, likely the 0.1–0.5 kpc circumnuclear disks of (U)LIRGs.
In Appendix B we compare the observed submm SLEDs of eight sample galaxies and the best-fit predictions by the multicomponent models, which generally agree well. We also show that in some EDGs (NGC 6240 and NGC 253), collisional excitation of the base levels is required to make the radiative pumping mechanism operational, and finally, we discuss in Appendix C whether the cases of NGC 7469 and NGC 1068 represent sources in which H2O is excited by collisions in shocks or if geometrical effects can account for the lack of H2O 75 μm absorption.
4. Discussion and conclusions
The preponderance of H2O 75 μm absorption is difficult to reconcile with collisional excitation in shock cavities that are devoid of a significant amount of warm dust. An alternative is to assume that the H2O 1163 GHz line is generated in an ensemble of shock cavities, in which the H2O 75 μm line is also generated in emission, while a spatially separated and unrelated τ100 > > 1 component produces the 75 μm absorption (almost always stronger than the emission, which is required to generate net absorption in the line). However, this scenario does not explain the correlation between  and
and  as the two lines are generated in different regions and by different mechanisms. Even if
  (mechanical) and LIR are related, the specific lines respond in different ways to the far-IR and mechanical feedback. The case of Orion KL illustrates this point: Large FoVs show emission in the 75 μm line far above the absorption toward the HC (lower insert in Fig. 2a).
The following interpretation of the LH2O 988 GHz − LIR correlation stems from the present analysis. In Fig. 1c we have increased the dynamic range of the correlation found by Yang et al. (2013) for extragalactic sources to the luminosities characteristic of Galactic sources, assuming that the radiative pumping slope of 1.12 holds. Then, a number of HMSFRs and basically all LMSFRs, in which H2O is excited by shocks, lie well above this line. Using the spectral decomposition of the H2O 988 GHz spectra in HMSFRs carried out by van der Tak et al. (2013) and San José-García et al. (2016), we plotted in Fig. 1c the H2O 988 GHz luminosities due to the massive envelopes of HMSFRs (light blue symbols) alone. The match with the extended extragalactic correlation was good. We thus propose that these Galactic massive envelopes (including the CND of the Milky Way) play a role similar to the circumnuclear disks in galaxies, where the H2O submm emission is radiatively pumped2. This is combined at least in some cases with collisional excitation of the low-energy levels. Dominance of H2O line excitation by collisions in dense shocks is proposed in Galactic sources located significantly above the blue line in Fig. 1c. The location of the Galactic HMSFRs in Fig. 2a resemble the starburst galaxies NGC 253 and IRAS 13120-5453, lacking an obscured nucleus that in its prominent form is a unique feature of extragalactic sources.
While we expect that the para-H2O 101 μm pumping cycle is as important as the ortho-H2O 75 μm cycle, the low-excitation 111 and 202 levels will be more affected by collisions in warm and dense regions than the 321 level. The 988 GHz line is therefore less suitable than the 1163 GHz line for distinguishing between the two mechanisms.
With the exception of M 82, which is not detected in the 75 μm or in the 1163 GHz line and was therefore excluded from the sample.
In this framework, the slope of 1.1 could be due to the increasing linewidth Δv with LIR, as for the optically thick 75 and 101 μm lines  . If Δv increases by a factor ∼5 as LIR increases by 7 dex, the index of the correlation is ∼1 + (log105)/7 = 1.1.
The Serpens SMM1 line fluxes were taken from Table A.1 of Goicoechea et al. (2012), with the exception of a few fluxes that appeared with typographical errors. The H2O 220 − 211 and 221 − 110 lines should have been listed as 1.46 × 10⁻¹⁶ and 1.35 × 10⁻¹⁵ W m−2 instead of 2.92 × 10⁻¹⁷ and 1.35 × 10⁻¹⁶ W m−2, respectively.
Acknowledgments
We thank the referee for helpful comments that improved the clarity of the manuscript. EG-A is a Research Associate at the Harvard-Smithsonian Center for Astrophysics, and thanks the Spanish MICINN for support under project PID2019-105552RB-C41. JRG thanks the Spanish MCINN for funding support under grant PID2019-106110GB-I00. JF and KPS gratefully acknowledge support through NASA grant NNH17ZD001N-ADAP. CY acknowledges support from ERC Advanced Grant 789410. MPS acknowledges support from the Comunidad de Madrid through the Atracción de Talento Investigador Grant 2018-T1/TIC-11035 and PID2019-105423GA-I00 (MCIU/AEI/FEDER,UE). PACS was developed by a consortium of institutes led by MPE (Germany) and including UVIE (Austria); KU Leuven, CSL, IMEC (Belgium); CEA, LAM (France); MPIA (Germany); INAFIFSI/OAA/OAP/OAT, LENS, SISSA (Italy); IAC (Spain). This development has been supported by the funding agencies BMVIT (Austria), ESA-PRODEX (Belgium), CEA/CNES (France), DLR (Germany), ASI/INAF (Italy), and CICYT/MCYT (Spain). SPIRE was developed by a consortium of institutes led by Cardiff University (UK) and including Univ. Lethbridge (Canada); NAOC (China); CEA, LAM (France); IFSI, Univ. Padua (Italy); IAC (Spain); Stockholm Observatory (Sweden); Imperial College London, RAL, UCL-MSSL, UKATC, Univ. Sussex (UK); and Caltech, JPL, NHSC, Univ.Colorado (USA). This development has been supported by national funding agencies: CSA (Canada); NAOC (China); CEA, CNES, CNRS (France); ASI (Italy); MCINN (Spain); SNSB (Sweden); STFC, UKSA (UK); and NASA (USA).
References
- Cernicharo, J., Goicoechea, J. R., Daniel, F., et al. 2006, ApJ, 649, L33 [Google Scholar]
- de Graauw, T., Helmich, F. P., Phillips, T. G., et al. 2010, A&A, 518, L6 [NASA ADS] [CrossRef] [EDP Sciences] [Google Scholar]
- Dutkowska, K. M., & Kristensen, L. E. 2022, A&A, in press, https://doi.org/10.1051/0004-6361/202243235 [Google Scholar]
- Etxaluze, M., Goicoechea, J. R., Cernicharo, J., et al. 2013, A&A, 556, A137 [NASA ADS] [CrossRef] [EDP Sciences] [Google Scholar]
- Falstad, N., González-Alfonso, E., Aalto, S., et al. 2015, A&A, 580, A52 [NASA ADS] [CrossRef] [EDP Sciences] [Google Scholar]
- Falstad, N., González-Alfonso, E., Aalto, S., & Fischer, J. 2017, A&A, 597, A105 [NASA ADS] [CrossRef] [EDP Sciences] [Google Scholar]
- Fischer, J., Abel, N. P., González-Alfonso, E., et al. 2014, ApJ, 795, 117 [NASA ADS] [CrossRef] [Google Scholar]
- Gerin, M., Ruaud, M., Goicoechea, J. R., et al. 2015, A&A, 573, A30 [NASA ADS] [CrossRef] [EDP Sciences] [Google Scholar]
- Goicoechea, J. R., Cernicharo, J., Karska, A., et al. 2012, A&A, 548, A77 [NASA ADS] [CrossRef] [EDP Sciences] [Google Scholar]
- Goicoechea, J. R., Etxaluze, M., Cernicharo, J., et al. 2013, ApJ, 769, L13 [Google Scholar]
- Goicoechea, J. R., Chavarría, L., Cernicharo, J., et al. 2015, ApJ, 799, 102 [NASA ADS] [CrossRef] [Google Scholar]
- González-Alfonso, E., Fischer, J., Isaak, K., et al. 2010, A&A, 518, L43 [NASA ADS] [CrossRef] [EDP Sciences] [Google Scholar]
- González-Alfonso, E., Fischer, J., Aalto, S., & Falstad, N. 2014, A&A, 567, A91 [NASA ADS] [CrossRef] [EDP Sciences] [Google Scholar]
- González-Alfonso, E., Fischer, J., Sturm, E., et al. 2015, ApJ, 800, 69 [CrossRef] [Google Scholar]
- González-Alfonso, E., Pereira-Santaella, M., Fischer, J., et al. 2021, A&A, 645, A49 [EDP Sciences] [Google Scholar]
- Griffin, M. J., Abergel, A., Abreu, A., et al. 2010, A&A, 518, L3 [EDP Sciences] [Google Scholar]
- Hailey-Dunsheath, S., Sturm, E., Fischer, J., et al. 2012, ApJ, 755, 57 [NASA ADS] [CrossRef] [Google Scholar]
- Herczeg, G. J., Karska, A., Bruderer, S., et al. 2012, A&A, 540, A84 [NASA ADS] [CrossRef] [EDP Sciences] [Google Scholar]
- Karska, A., Herpin, F., Bruderer, S., et al. 2014a, A&A, 562, A45 [NASA ADS] [CrossRef] [EDP Sciences] [Google Scholar]
- Karska, A., Kaufman, M. J., Kristensen, L. E., et al. 2018, ApJS, 235, 30 [NASA ADS] [CrossRef] [Google Scholar]
- Karska, A., Kristensen, L. E., van Dishoeck, E. F., et al. 2014b, A&A, 572, A9 [NASA ADS] [CrossRef] [EDP Sciences] [Google Scholar]
- Kessler, M. F., Steinz, J. A., Anderegg, M. E., et al. 1996, A&A, 315, L27 [NASA ADS] [Google Scholar]
- Kristensen, L. E., van Dishoeck, E. F., Bergin, E. A., et al. 2012, A&A, 542, A8 [NASA ADS] [CrossRef] [EDP Sciences] [Google Scholar]
- Liu, L., Weiß, A., Perez-Beaupuits, J. P., et al. 2017, ApJ, 846, 5 [Google Scholar]
- Lu, N., Zhao, Y., Diaz-Santos, T., et al. 2017, VizieR Online Data Catalog: J/ApJS/230/1 [Google Scholar]
- Matuszak, M., Karska, A., Kristensen, L. E., et al. 2015, A&A, 578, A20 [NASA ADS] [CrossRef] [EDP Sciences] [Google Scholar]
- Meijerink, R., Kristensen, L. E., Weiß, A., et al. 2013, ApJ, 762, L16 [Google Scholar]
- Omont, A., Neri, R., Cox, P., et al. 2011, A&A, 530, L3 [NASA ADS] [CrossRef] [EDP Sciences] [Google Scholar]
- Omont, A., Yang, C., Cox, P., et al. 2013, A&A, 551, A115 [NASA ADS] [CrossRef] [EDP Sciences] [Google Scholar]
- Pereira-Santaella, M., González-Alfonso, E., Usero, A., et al. 2017, A&A, 601, L3 [NASA ADS] [CrossRef] [EDP Sciences] [Google Scholar]
- Pilbratt, G. L., Riedinger, J. R., Passvogel, T., et al. 2010, A&A, 518, L1 [NASA ADS] [CrossRef] [EDP Sciences] [Google Scholar]
- Poglitsch, A., Waelkens, C., Geis, N., et al. 2010, A&A, 518, L2 [NASA ADS] [CrossRef] [EDP Sciences] [Google Scholar]
- Riechers, D. A., Weiss, A., Walter, F., et al. 2022, Nature, 602, 58 [NASA ADS] [CrossRef] [Google Scholar]
- San José-García, I., Mottram, J. C., van Dishoeck, E. F., et al. 2016, A&A, 585, A103 [CrossRef] [EDP Sciences] [Google Scholar]
- Spinoglio, L., Pereira-Santaella, M., Busquet, G., et al. 2012, ApJ, 758, 108 [Google Scholar]
- van der Tak, F. F. S., Chavarría, L., Herpin, F., et al. 2013, A&A, 554, A83 [NASA ADS] [CrossRef] [EDP Sciences] [Google Scholar]
- van der Werf, P. P., Isaak, K. G., Meijerink, R., et al. 2010, A&A, 518, L42 [NASA ADS] [CrossRef] [EDP Sciences] [Google Scholar]
- van der Werf, P. P., Berciano Alba, A., Spaans, M., et al. 2011, ApJ, 741, L38 [Google Scholar]
- van Dishoeck, E. F., Kristensen, L. E., Mottram, J. C., et al. 2021, A&A, 648, A24 [NASA ADS] [CrossRef] [EDP Sciences] [Google Scholar]
- Yang, C., Gao, Y., Omont, A., et al. 2013, ApJ, 771, L24 [NASA ADS] [CrossRef] [Google Scholar]
- Yang, C., Omont, A., Beelen, A., et al. 2016, A&A, 595, A80 [NASA ADS] [CrossRef] [EDP Sciences] [Google Scholar]
- Yang, C., Gavazzi, R., Beelen, A., et al. 2019, A&A, 624, A138 [NASA ADS] [CrossRef] [EDP Sciences] [Google Scholar]
Appendix A: H2O 75 μm profiles in Galactic high-mass star-forming regions
Figure A.1 shows the H2O 75 μm and 1163 GHz profiles in our sample of Galactic high-mass star-forming regions.
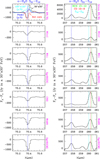 |
Fig. A.1. H2O 321 − 212 75 μm (left) and H2O 321 − 312 1163 GHz (right) profiles in seven Galactic high-mass star-forming regions, as observed with Herschel/PACS and SPIRE. The apodized SPIRE profiles also include the blend of CO 10-9 (which dominates the observed emission), H2O 312 − 221, and HCN 13-12. The PACS spectra correspond to the central 3 × 3 spaxels (≈30″ × 30″). In Orion KL, the H2O 75 μm line is observed in absorption toward the HC, as seen within the central PACS spaxel (≈10″ × 10″), but shows P Cygni and emission profiles for larger FoVs and toward Peak 1 (upper left panel; see also the insert in Fig. 2a). |
Appendix B: Submillimeter SLEDs
Figure B.1a compares the observed submm SLEDs with the best-fit predictions (in red) by the multicomponent models applied to eight sample galaxies, four (sub)LIRGs and four ULIRGs (see also Falstad et al. 2015, 2017, for similar models applied to Zw 049-057 and Arp 299a). In these models, collisional excitation was only roughly simulated with a single value of Tgas = 150 K and three values of the density (n(H2)): 1.7 × 10⁴, 5 × 10⁴, and 1.5 × 105 cm−3 (González-Alfonso et al. 2021). Only in the case of NGC 6240 was the highest density favored for the component that dominates the H2O submm emission. The overall SLEDs are naturally reproduced with far-IR radiation fields that also account for the PACS lines and the SED, albeit with some discrepancies.
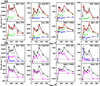 |
Fig. B.1. Model results for the H2O submm SLEDs. a) Fits to the H2O submm emission for eight local extragalactic sources analyzed in this paper, including all modeling components. Black circles with error bars show the observed fluxes. Blue, green, and gray circles indicate the contributions to the model fit by the core, disk, and envelope components, respectively, and red shows the total. b) Model component that dominates the emission of the H2O low-excitation submillimeter lines (the envelope component), shown with gray circles and lines. For comparison, magenta symbols and lines show the modeling results for these components that are obtained when the collisional excitation is quenched, and blue symbols (for NGC 253 and NGC 6240) indicate the results that are obtained when the far-IR pumping is quenched (but collisional excitation is included). |
For the model components in Fig. B.1a, we used the same nomenclature (core, disk, and envelope) as in González-Alfonso et al. (2021). Schematically, the high-excitation absorption lines are formed in the far-IR photosphere of the optically thick and very warm cores; the medium-excitation absorption and emission lines have contributions from the disk components, and the envelopes dominate the H2O submm line emission and also generate some absorption in the low-excitation far-IR lines (such as the 75 μm line).
A general characteristic of the H2O submm SLEDs of galaxies is their U−shape, which is also shown in Fig. 1b. It is instructive to understand that according to our nonlocal models, the minimum emission line flux in most cases, which corresponds to the para-H2O 220 − 211 1229 GHz line, is due to competing absorption of the continuum by the line in the optically thicker core and disk components, and not to an intrinsic weakness of the 1229 GHz line emission from the optically thin envelope. The absorption in the 1229 GHz line is strongest mainly because its Aul−Einstein coefficient is 2.7× higher than that of the 211 − 202 752 GHz line. Close to the source surface, this has the effect of reducing the excitation temperature (Tex) of the 1229 GHz line, which will therefore be more prone to absorbing the brighter (because its frequency is also higher) continuum behind. The same effect does not occur with the ortho-H2O 321 − 312 1163 GHz line because its Aul is only 1.2× higher than Aul(312 − 303)+Aul(312 − 221), and the 1163 GHz line therefore remains relatively excited (and even with suprathermal excitation in some models) close to the surface. The described absorption effect specific to the 1229 GHz line in ADGs is indeed clearly visible in our data: in Fig. 1b, Arp 220 (with a prominent core) shows one of the lowest (relative) 1229 GHz fluxes, while the EDGs NGC 1068 and NGC 253 do not show this dip. In summary, while the fluxes of the H2O submm lines are dominated by the envelopes, the cores and disks modulate the line ratios and generate the SLED U−shaped pattern.
In contrast with the nearly flat submm SLEDs for the envelopes predicted by the radiative pumping scenario (in absence of high collisional excitation of the low-excitation lines, see below), the SLED of Serpens SMM13 shows a strong decline in the fluxes of the para- and ortho-lines with increasing Eup (Fig. 1b). Here, the dip in the para-H2O 220 − 211 1229 GHz line has nothing to do with the absorption of any continuum, but with the difficulty of exciting the 220 level without a continuum source emitting at 101 μm. A characteristic of H2O shock excitation in dense gas is that the ortho 312 − 303 1097 GHz line is expected to be stronger than the 321 − 312 1163 GHz line, as opposed to the situation when radiative pumping dominates.
For each of the eight sources, Fig. B.1b shows the predictions for the envelope component that dominates the H2O submm emission alone (gray symbols). To better understand the relative roles of collisional and radiative pumping, we generated exactly the same models, but quenched the collisional rates (in magenta). While the results in the four ULIRGs remain the same, meaning that collisional excitation has little effect on the H2O excitation, the quenching of collisions has a strong effect in some sub-ULIRGs, specifically, in NGC 253 and NGC 6240. In these EDGs, we also generated the same models, but quenched the pumping radiation field and kept the collisional excitation (in blue), with the result that the line fluxes dropped dramatically with the exception of the 111 − 000 and 202 − 111 lines. This indicates that collisional excitation is required to populate the base levels (212 and 111) from which the pumping cycles operate (González-Alfonso et al. 2014). In these sources, the combination of collisional excitation of the base levels and radiative pumping from them generates the H2O submm emission. These results also suggest that in galaxies with the highest luminosities, collisional excitation of the base levels tends to be less important.
Appendix C: Outliers (NGC 1068 and NGC 7469): Collisional excitation or geometrical effects?
NGC 1068 and NGC 7469 are ambiguous sources because the H2O 75 μm line is neither detected in absorption, as expected in the scenario of radiative pumping, nor in emission, as expected in the case of shock excitation. As shown in Fig. 1d, both sources are underluminous in the H2O 1163 GHz and 988 GHz lines relative to LIR, with a stronger deficit in the 1163 GHz line. These galaxies are thus not representative of the bulk of (U)LIRGs that are observed with SPIRE and were fit by Yang et al. (2013), but may well represent a population of low-luminosity AGNs (≲1011 L⊙) with starburst rings, which are undersampled by Herschel/PACS and SPIRE.
The PACS continuum-subtracted spectrum around the H2O 321 − 212 75 μm line in NGC 1068 is shown in Fig. C.1. The net flux of the line in NGC 1068 and NGC 7469 is below 3σ (42 ± 64 and 73 ± 30 Jy km s−1), but indications of a P Cygni profile are visible in the spectrum of NGC 1068, in which the absorption and emission features nearly cancel each other. P Cygni profiles with similar absorption and emission fluxes are characteristic of radiatively excited lines. We note that the redshifted emission component will also contribute to the 1163 GHz flux via radiative pumping without generating 75 μm absorption because the emitting gas is on the far side of the continuum source. This is one example of the anisotropy we discussed in Section 2. However, the measured flux in the 75 μm blueshifted absorption component falls too short to account for the observed strong submm emission in the 1163 GHz line.
Spinoglio et al. (2012) reported and analyzed the H2O submm emission in NGC 1068, including the detected PACS lines (all in emission). The H2O emission was found to be dominated by the CND around the AGN. Collisional excitation of H2O is important in the CND, as indicated, for instance, by the relatively strong emission of the H2O 111 − 000 1113 GHz line and by the 1163-to-988 flux ratio, which is lower than 1 (Fig. 1b). However, the proposed LVG models that ignored radiative pumping yielded Tgas ∼ 40 K for the H2O in the CND that did not match the conditions inferred from the CO lines (Tgas ∼ 170–570 K; Hailey-Dunsheath et al. 2012). An alternative model was then explored by González-Alfonso et al. (2014), which included the radiative pumping effect by the dust mixed with H2O and also by an external far-IR radiation field that was anisotropic, that is, it did not impinge onto the clumps in the direction of the observer and thus did not produce absorption of the far-IR lines in the direction of the Earth. Conversely, the external field produced emission in the far-IR lines, which would almost cancel the absorption by the internal field in the case of the 75 μm line. A similar situation might be encountered in the Sy 1.2 galaxy NGC 7469.
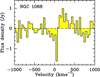 |
Fig. C.1. H2O 321 − 212 75 μm continuum-subtracted spectrum in NGC 1068. |
All Figures
|
Fig. 1. H2O submillimeter emission line relationships. (a) Simplified energy level diagram of ortho- and para-H2O, illustrating the radiative pumping mechanism of H2O submillimeter emission (Sect. 2). (b) Spectral line energy distribution of the H2O submillimeter lines, normalized to the flux of the 321 → 312 line, in eight extragalactic sources in which the pumping ortho-H2O 321 ← 212 line at 75 μm has been observed, compared with the SLED in the LMSFR Serpens SMM1 (Goicoechea et al. 2012). The flux of undetected lines is set to 0. (c) Luminosity of the H2O 202 → 111 988 GHz line as a function of the source IR luminosity for the extragalactic sources considered in this paper (red circles; open circles indicate 3σ upper limits) and the Galactic low-mass and high-mass star-forming regions (black and magenta circles, respectively, taken from the Water Emission Database; Dutkowska & Kristensen 2022; https://katarzynadutkowska.github.io/WED/). The light blue symbols isolate the contribution to LH2O 988 GHz by the envelopes of HMSFRs. The green line shows the best-fit power-law function to all Galactic and extragalactic sources found by van Dishoeck et al. (2021), with an index of 0.95 ± 0.02, and the blue line shows the fit found by Yang et al. (2013) to the extragalactic sources alone, with an index of 1.12. (d) Same as (c), but zoomed-in on the extragalactic sources. The luminosity of the H2O 321 → 312 1163 GHz line is added in blue. The red and blue lines show the fits by Yang et al. (2013). |
| In the text | |
|
Fig. 2. Quantitative diagnostic of the radiative pumping mechanism. (a) Plot of |
| In the text | |
|
Fig. A.1. H2O 321 − 212 75 μm (left) and H2O 321 − 312 1163 GHz (right) profiles in seven Galactic high-mass star-forming regions, as observed with Herschel/PACS and SPIRE. The apodized SPIRE profiles also include the blend of CO 10-9 (which dominates the observed emission), H2O 312 − 221, and HCN 13-12. The PACS spectra correspond to the central 3 × 3 spaxels (≈30″ × 30″). In Orion KL, the H2O 75 μm line is observed in absorption toward the HC, as seen within the central PACS spaxel (≈10″ × 10″), but shows P Cygni and emission profiles for larger FoVs and toward Peak 1 (upper left panel; see also the insert in Fig. 2a). |
| In the text | |
|
Fig. B.1. Model results for the H2O submm SLEDs. a) Fits to the H2O submm emission for eight local extragalactic sources analyzed in this paper, including all modeling components. Black circles with error bars show the observed fluxes. Blue, green, and gray circles indicate the contributions to the model fit by the core, disk, and envelope components, respectively, and red shows the total. b) Model component that dominates the emission of the H2O low-excitation submillimeter lines (the envelope component), shown with gray circles and lines. For comparison, magenta symbols and lines show the modeling results for these components that are obtained when the collisional excitation is quenched, and blue symbols (for NGC 253 and NGC 6240) indicate the results that are obtained when the far-IR pumping is quenched (but collisional excitation is included). |
| In the text | |
|
Fig. C.1. H2O 321 − 212 75 μm continuum-subtracted spectrum in NGC 1068. |
| In the text | |
Current usage metrics show cumulative count of Article Views (full-text article views including HTML views, PDF and ePub downloads, according to the available data) and Abstracts Views on Vision4Press platform.
Data correspond to usage on the plateform after 2015. The current usage metrics is available 48-96 hours after online publication and is updated daily on week days.
Initial download of the metrics may take a while.