Fig. 1.
Download original image
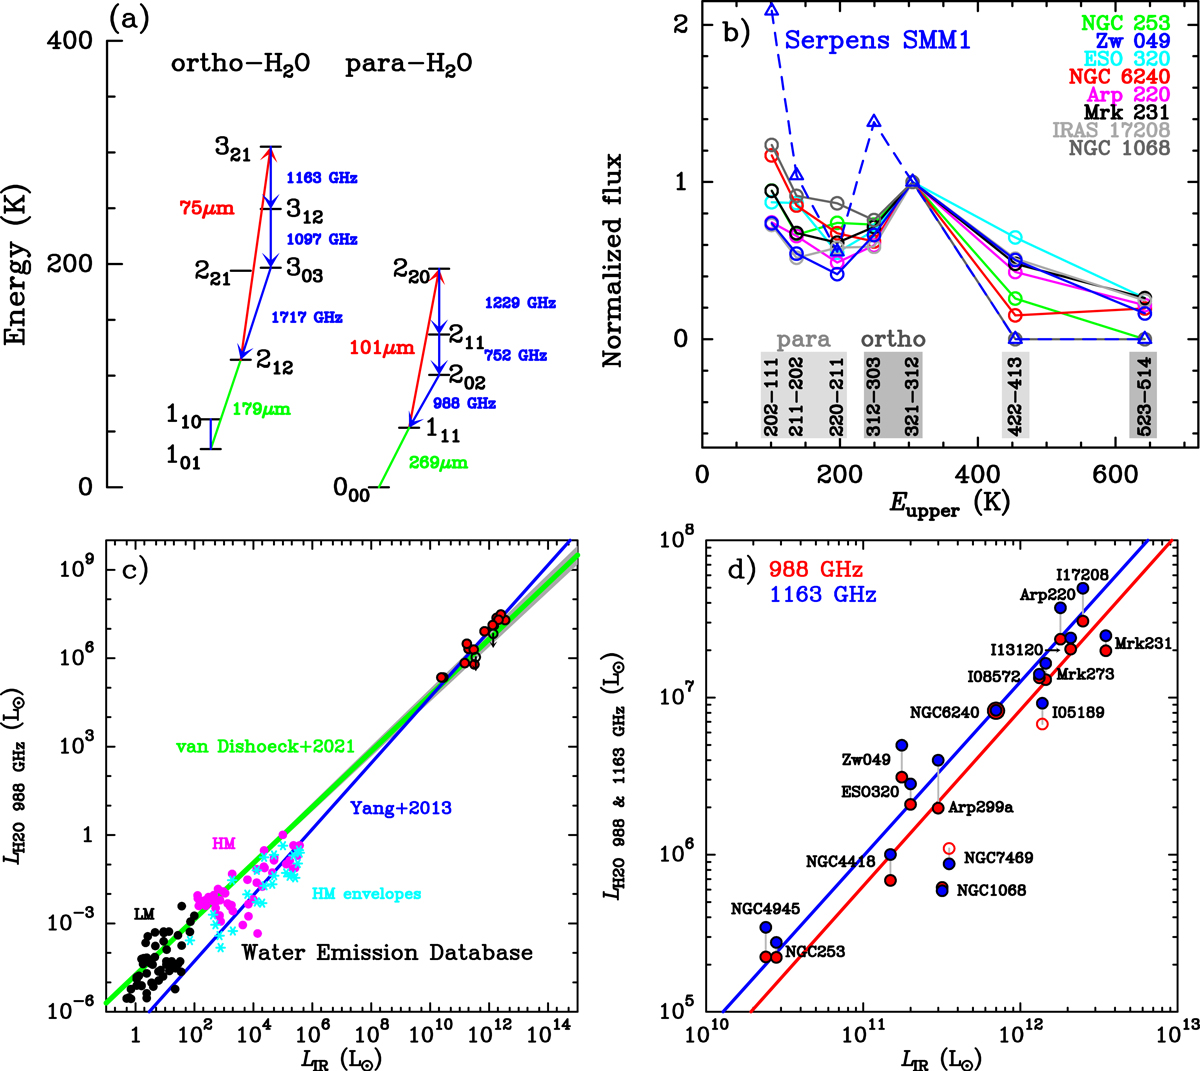
H2O submillimeter emission line relationships. (a) Simplified energy level diagram of ortho- and para-H2O, illustrating the radiative pumping mechanism of H2O submillimeter emission (Sect. 2). (b) Spectral line energy distribution of the H2O submillimeter lines, normalized to the flux of the 321 → 312 line, in eight extragalactic sources in which the pumping ortho-H2O 321 ← 212 line at 75 μm has been observed, compared with the SLED in the LMSFR Serpens SMM1 (Goicoechea et al. 2012). The flux of undetected lines is set to 0. (c) Luminosity of the H2O 202 → 111 988 GHz line as a function of the source IR luminosity for the extragalactic sources considered in this paper (red circles; open circles indicate 3σ upper limits) and the Galactic low-mass and high-mass star-forming regions (black and magenta circles, respectively, taken from the Water Emission Database; Dutkowska & Kristensen 2022; https://katarzynadutkowska.github.io/WED/). The light blue symbols isolate the contribution to LH2O 988 GHz by the envelopes of HMSFRs. The green line shows the best-fit power-law function to all Galactic and extragalactic sources found by van Dishoeck et al. (2021), with an index of 0.95 ± 0.02, and the blue line shows the fit found by Yang et al. (2013) to the extragalactic sources alone, with an index of 1.12. (d) Same as (c), but zoomed-in on the extragalactic sources. The luminosity of the H2O 321 → 312 1163 GHz line is added in blue. The red and blue lines show the fits by Yang et al. (2013).
Current usage metrics show cumulative count of Article Views (full-text article views including HTML views, PDF and ePub downloads, according to the available data) and Abstracts Views on Vision4Press platform.
Data correspond to usage on the plateform after 2015. The current usage metrics is available 48-96 hours after online publication and is updated daily on week days.
Initial download of the metrics may take a while.