Fig. 2.
Download original image
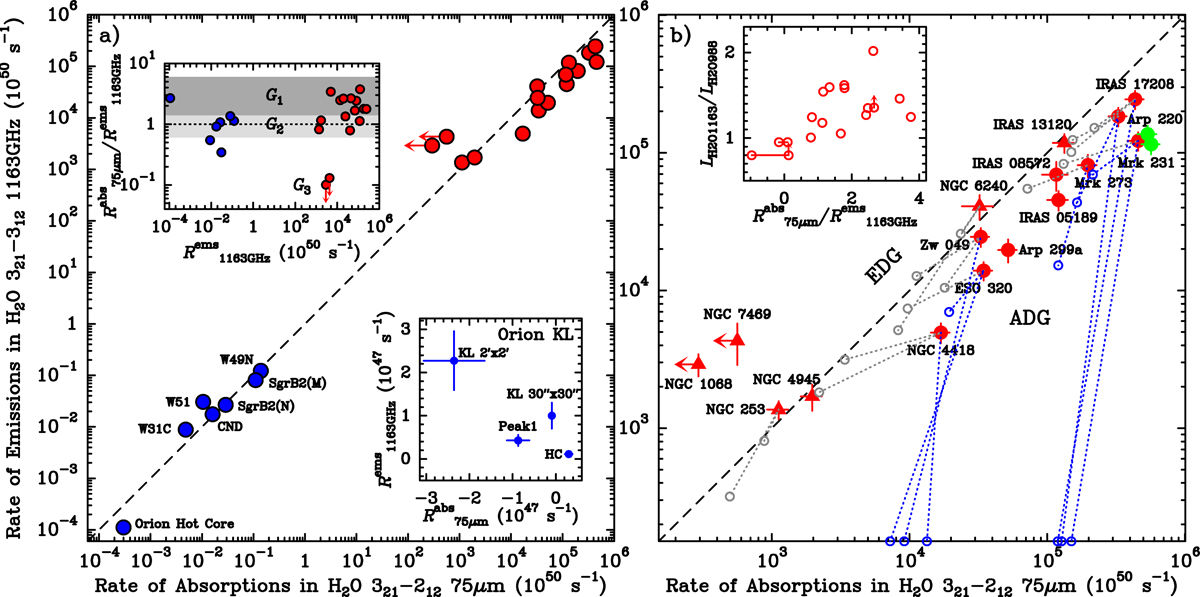
Quantitative diagnostic of the radiative pumping mechanism. (a) Plot of ![]() as a function of
as a function of ![]() for the Galactic and extragalactic samples. The dashed line indicates
for the Galactic and extragalactic samples. The dashed line indicates ![]() . The lower insert shows these values in linear scale for Orion KL, with negative numbers of
. The lower insert shows these values in linear scale for Orion KL, with negative numbers of ![]() indicating emission in the 75 μm line. The upper insert shows
indicating emission in the 75 μm line. The upper insert shows ![]() vs.
vs. ![]() . Shading indicates the G1, G2, and G3 groups defined according to the value of r (Sect. 3.3). (b) Same as (a), but zoomed-in on the extragalactic sources. Circles and triangles indicate ADGs and EDGs, respectively (Sect. 3.1). The green symbols show the same values, but for the 202 → 111 (emission) vs. the 220 ← 111 (absorption) in the two sources (Mrk 231 and Arp 220) in which the 101 μm line has been observed. The open circles show the position in this plane of the optically thin (τ100 < 1, in gray) and optically thick (τ100 > 1, in blue) model components used to fit the H2O emission and absorption (Appendix B). The insert shows the 321 → 312-to-202 → 111 luminosity ratio vs.
. Shading indicates the G1, G2, and G3 groups defined according to the value of r (Sect. 3.3). (b) Same as (a), but zoomed-in on the extragalactic sources. Circles and triangles indicate ADGs and EDGs, respectively (Sect. 3.1). The green symbols show the same values, but for the 202 → 111 (emission) vs. the 220 ← 111 (absorption) in the two sources (Mrk 231 and Arp 220) in which the 101 μm line has been observed. The open circles show the position in this plane of the optically thin (τ100 < 1, in gray) and optically thick (τ100 > 1, in blue) model components used to fit the H2O emission and absorption (Appendix B). The insert shows the 321 → 312-to-202 → 111 luminosity ratio vs. ![]() , and horizontal segments indicate the most likely ranges for the two sources that are undetected in H2O 75 μm.
, and horizontal segments indicate the most likely ranges for the two sources that are undetected in H2O 75 μm.
Current usage metrics show cumulative count of Article Views (full-text article views including HTML views, PDF and ePub downloads, according to the available data) and Abstracts Views on Vision4Press platform.
Data correspond to usage on the plateform after 2015. The current usage metrics is available 48-96 hours after online publication and is updated daily on week days.
Initial download of the metrics may take a while.