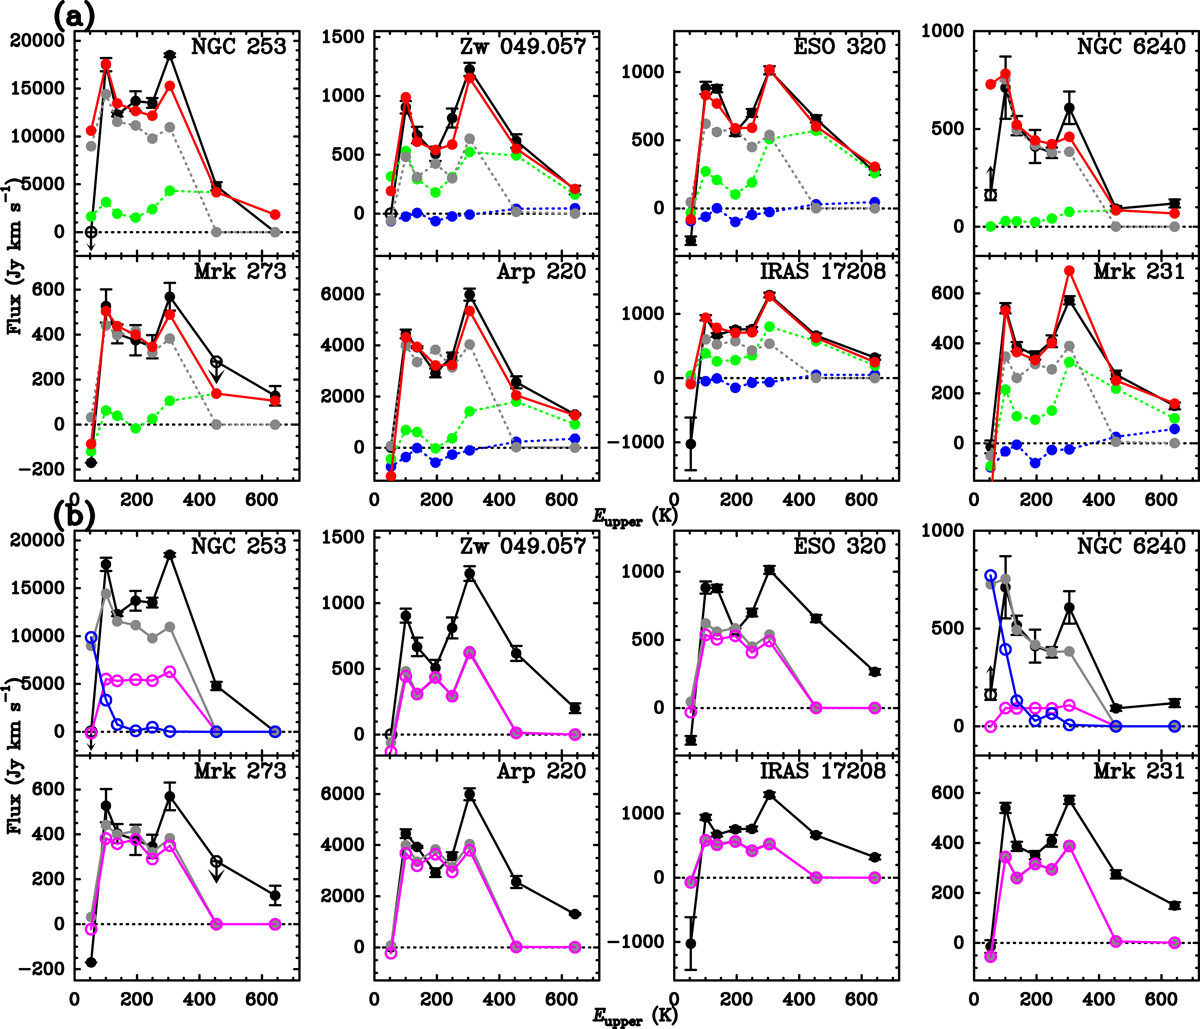
Fig. B.1.
Download original image
Model results for the H2O submm SLEDs. a) Fits to the H2O submm emission for eight local extragalactic sources analyzed in this paper, including all modeling components. Black circles with error bars show the observed fluxes. Blue, green, and gray circles indicate the contributions to the model fit by the core, disk, and envelope components, respectively, and red shows the total. b) Model component that dominates the emission of the H2O low-excitation submillimeter lines (the envelope component), shown with gray circles and lines. For comparison, magenta symbols and lines show the modeling results for these components that are obtained when the collisional excitation is quenched, and blue symbols (for NGC 253 and NGC 6240) indicate the results that are obtained when the far-IR pumping is quenched (but collisional excitation is included).
Current usage metrics show cumulative count of Article Views (full-text article views including HTML views, PDF and ePub downloads, according to the available data) and Abstracts Views on Vision4Press platform.
Data correspond to usage on the plateform after 2015. The current usage metrics is available 48-96 hours after online publication and is updated daily on week days.
Initial download of the metrics may take a while.