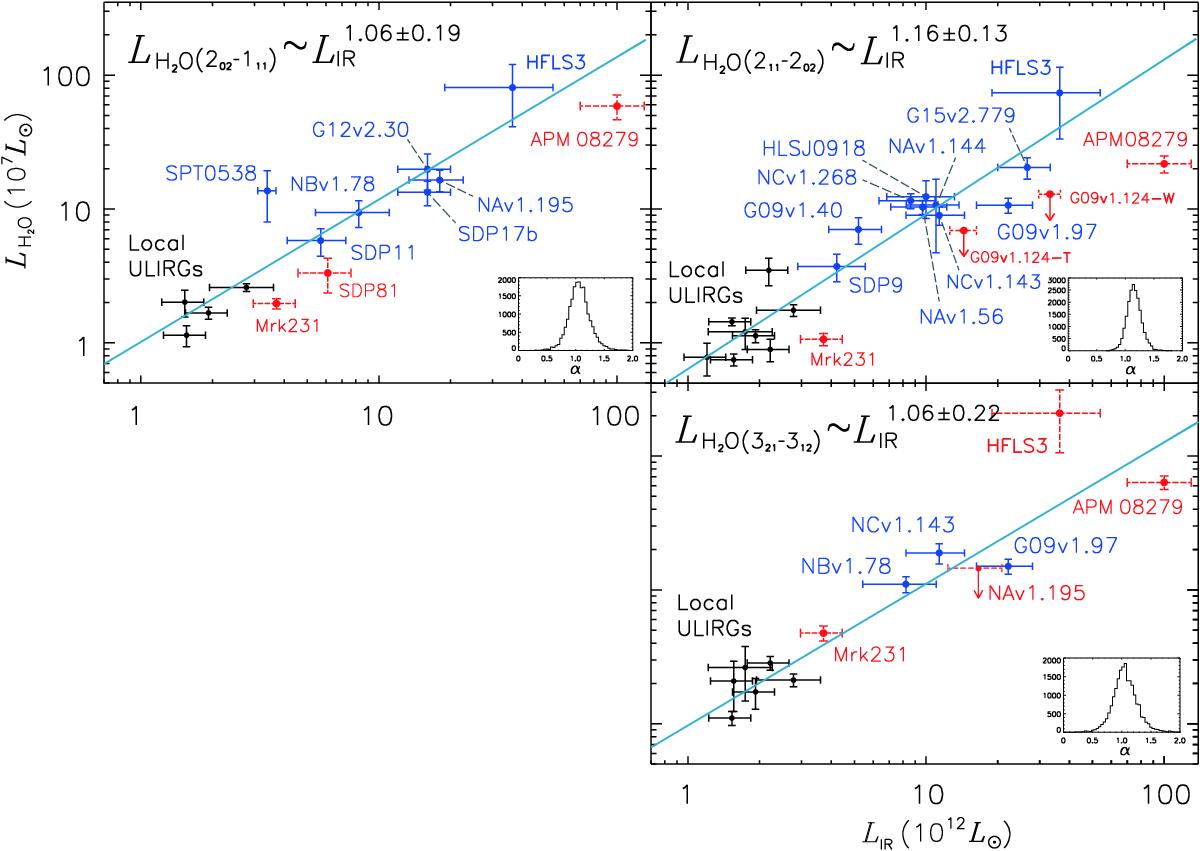
Fig. 3

Correlation between LIR and LH2O in local ULIRGs and high-redshift Hy/ULIRGs. The black points represent local ULIRGs from Y13. The blue points with solid error bars are the H-ATLAS source in this work together with some previously published sources. Red points with dashed error bars are excluded from the fit as described in the text. Upper limits are shown in arrows. The light blue lines show the results of the fitting. The insets are the probability density distributions of the fitted slopes α. We find tight correlations between the luminosity of the three H2O lines and LIR , namely LH2O∝LIR1.1−1.2.
Current usage metrics show cumulative count of Article Views (full-text article views including HTML views, PDF and ePub downloads, according to the available data) and Abstracts Views on Vision4Press platform.
Data correspond to usage on the plateform after 2015. The current usage metrics is available 48-96 hours after online publication and is updated daily on week days.
Initial download of the metrics may take a while.


