Fig. A.1
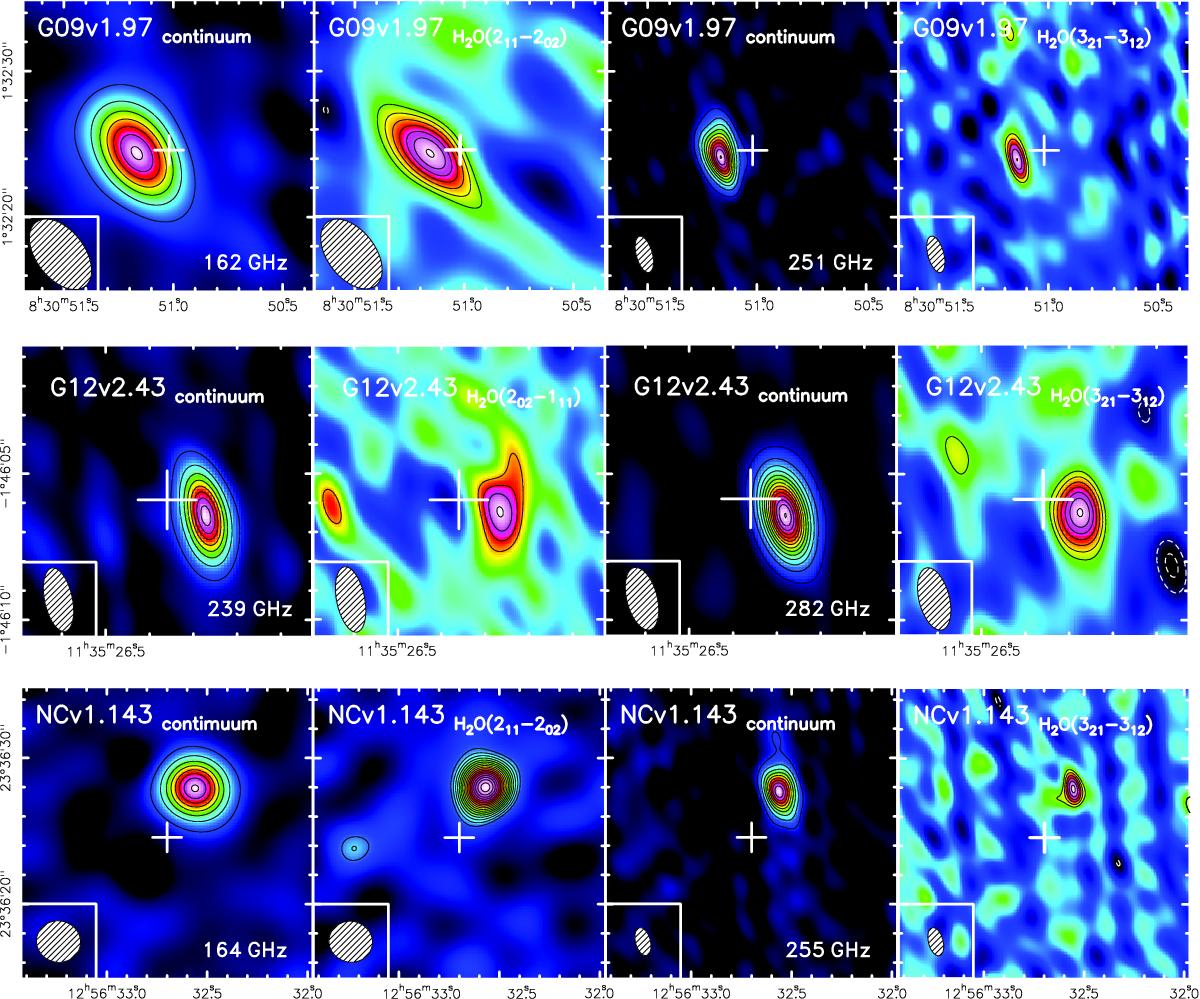
Mapping of the H2O emission lines and the corresponding continuum emission (frequencies have been shown accordingly in the white text) in the sources with both para J = 2 and ortho J = 3 H2O lines observed. The contours of the continuum emission start from 6σ in step of 10σ, and the contours of the H2O emission start from 3σ in step of 1σ. Asymmetric negative contours are shown in white dashed lines. For each observation, the 1σ contours for the continuum (mJy beam-1) and the H2O emission line (Jy km s-1 beam-1) are as follows: G09v1.97 H2O(211–202)(0.17/0.57), G09v1.97 H2O(321–312)(0.25/0.38), G12v2.43 H2O(202–111)(0.29/0.48), G12v2.43 H2O(321–312)(0.30/0.53), NCv1.143 H2O(211–202)(0.16/0.36) and NCv1.143 H2O(321–312)(0.42/0.72).
Current usage metrics show cumulative count of Article Views (full-text article views including HTML views, PDF and ePub downloads, according to the available data) and Abstracts Views on Vision4Press platform.
Data correspond to usage on the plateform after 2015. The current usage metrics is available 48-96 hours after online publication and is updated daily on week days.
Initial download of the metrics may take a while.