Fig. 6
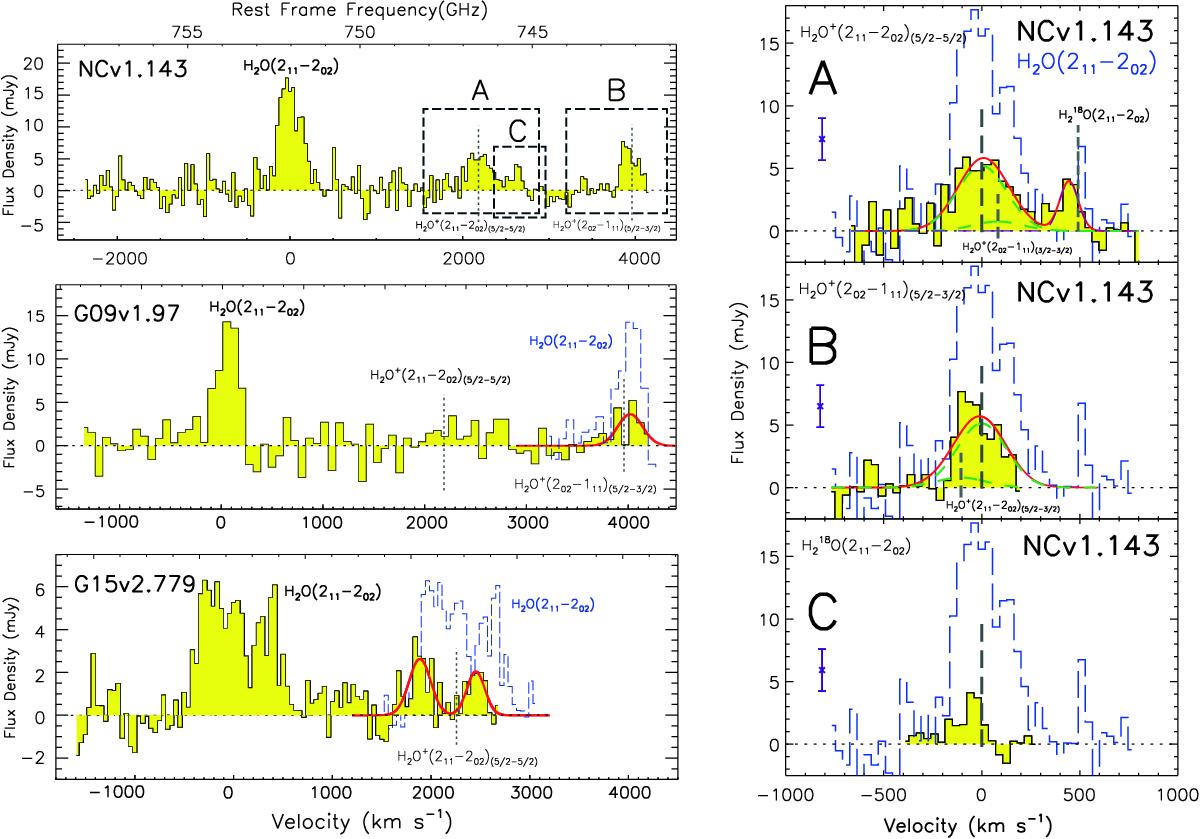
Left panel: from top to bottom are the full NOEMA spectrum at νrest ~ 750 GHz of NCv1.143, G09v1.97 and G15v2.779, respectively. The reference frequency is the redshifted frequency of the line H2O(211–202). The frequencies of the main H2O+(211–202) (5/2−5/2) and H2O+(202–111) (5/2−3/2) lines are indicated by grey vertical dashed lines. The three dashed squares in the spectrum of NCv1.143 show the position of each zoom-in spectrum of the H2O+ (or the H![]() O) as displayed in the right panel indicated by the A, B or C. The superposed blue dashed histograms represents the spectra of H2O(211–202)centred at the frequencies of the H2O+ lines. Note that, in many cases, the observed frequency ranges (yellow histograms) do not include the full expected profiles for the H2O+ lines. The red curve represents the Gaussian fitting to the spectra. We have detected both H2O+ lines in NCv1.143, and tentatively detected H2O+(202–111) (5/2−3/2) in G09v1.97 and H2O+(211–202) (5/2−5/2) in G15v2.779. Right panel: from top to bottom are the spectra dominated by lines of H2O+(211–202) (5/2−5/2), H2O+(202–111) (3/2−3/2) and H
O) as displayed in the right panel indicated by the A, B or C. The superposed blue dashed histograms represents the spectra of H2O(211–202)centred at the frequencies of the H2O+ lines. Note that, in many cases, the observed frequency ranges (yellow histograms) do not include the full expected profiles for the H2O+ lines. The red curve represents the Gaussian fitting to the spectra. We have detected both H2O+ lines in NCv1.143, and tentatively detected H2O+(202–111) (5/2−3/2) in G09v1.97 and H2O+(211–202) (5/2−5/2) in G15v2.779. Right panel: from top to bottom are the spectra dominated by lines of H2O+(211–202) (5/2−5/2), H2O+(202–111) (3/2−3/2) and H![]() O(211–202), respectively, displayed as the filled yellow histograms. The reference frequency is the frequency of each of these lines. Weaker H2O+(202–111) (3/2−3/2) and H2O+(211–202) (5/2−3/2) components are indicated by additional grey vertical dashed lines. The superposed blue dashed histograms represent the spectra of para-H2O(211–202)in NCv1.143 centred at each line frequency. The red curve represents the Gaussian fitting to the spectra, and the green dashed curves are the decomposed Gaussian profiles for each fine structure line. The violet error bar indicates the ±1σ uncertainties of the spectrum.
O(211–202), respectively, displayed as the filled yellow histograms. The reference frequency is the frequency of each of these lines. Weaker H2O+(202–111) (3/2−3/2) and H2O+(211–202) (5/2−3/2) components are indicated by additional grey vertical dashed lines. The superposed blue dashed histograms represent the spectra of para-H2O(211–202)in NCv1.143 centred at each line frequency. The red curve represents the Gaussian fitting to the spectra, and the green dashed curves are the decomposed Gaussian profiles for each fine structure line. The violet error bar indicates the ±1σ uncertainties of the spectrum.
Current usage metrics show cumulative count of Article Views (full-text article views including HTML views, PDF and ePub downloads, according to the available data) and Abstracts Views on Vision4Press platform.
Data correspond to usage on the plateform after 2015. The current usage metrics is available 48-96 hours after online publication and is updated daily on week days.
Initial download of the metrics may take a while.