Fig. 5
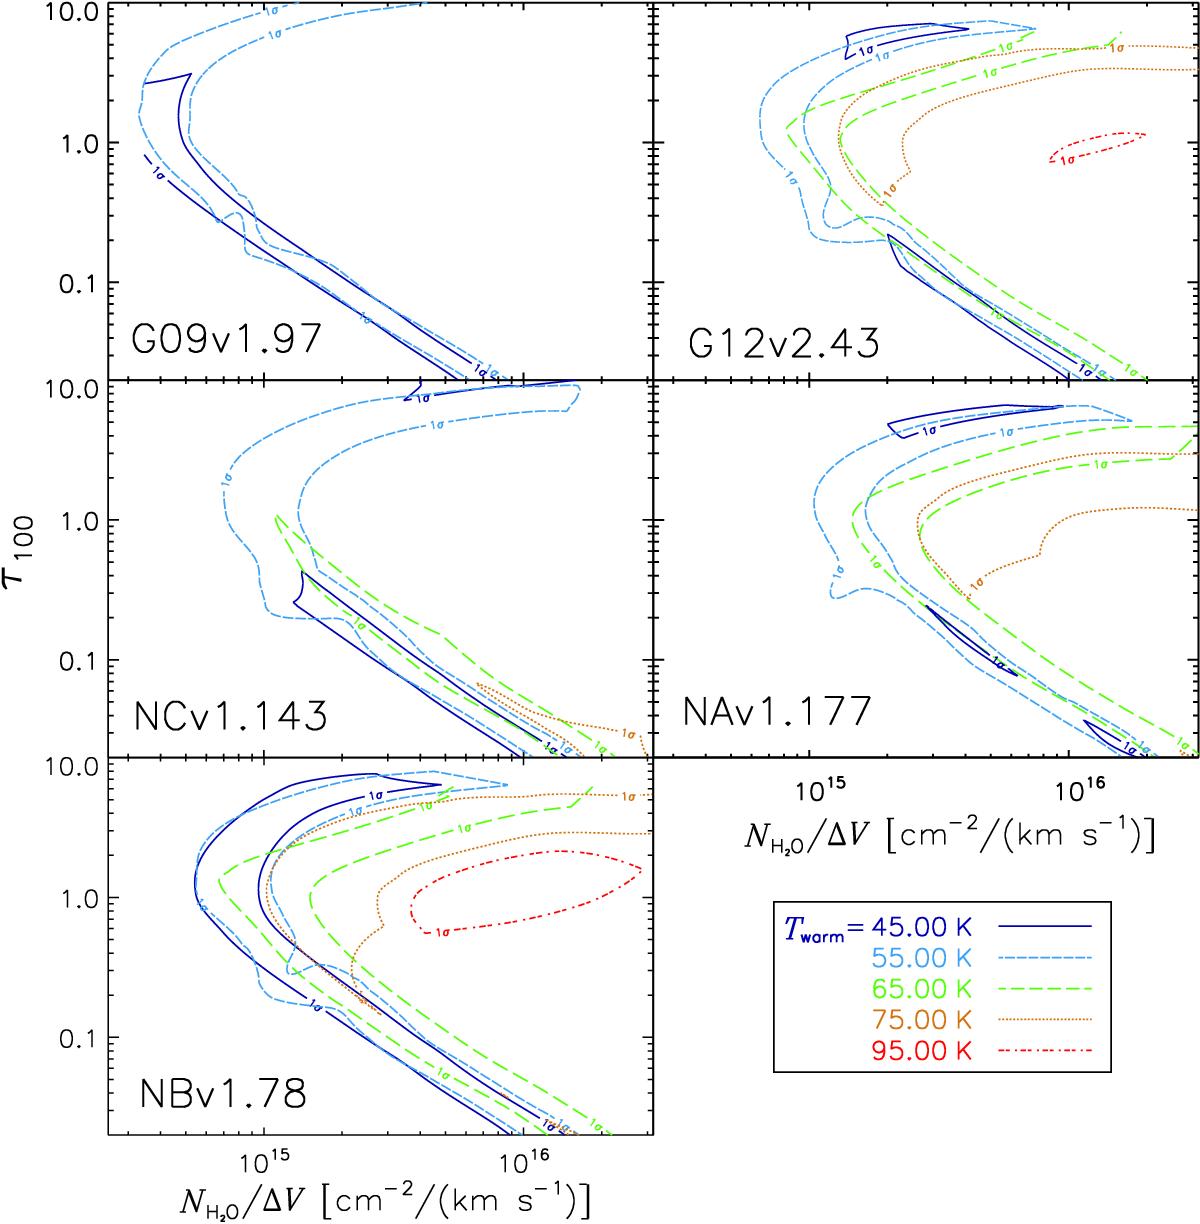
Parameter space distribution of the H2O far-infrared pumping excitation modelling with observed para-H2O 202–111 or 211–202and ortho-H2O(321–312)in each panel. ±1σ contours are shown for each plot. Different colours with different line styles represent different temperature components of the warm dust as shown in the legend. The explored warm dust temperature range is from 35 K to 115 K. The temperature contours that are unable to fit the data are not shown in this figure. From the figure, we are able to constrain the τ100, Twarm and NH2O /ΔV for the five sources. However, there are strong degeneracies. Thus, we need additional information, such as the velocity-integrated flux densities of J ≥ 4 H2O lines, to better constrain the physical parameters.
Current usage metrics show cumulative count of Article Views (full-text article views including HTML views, PDF and ePub downloads, according to the available data) and Abstracts Views on Vision4Press platform.
Data correspond to usage on the plateform after 2015. The current usage metrics is available 48-96 hours after online publication and is updated daily on week days.
Initial download of the metrics may take a while.