Fig. 1
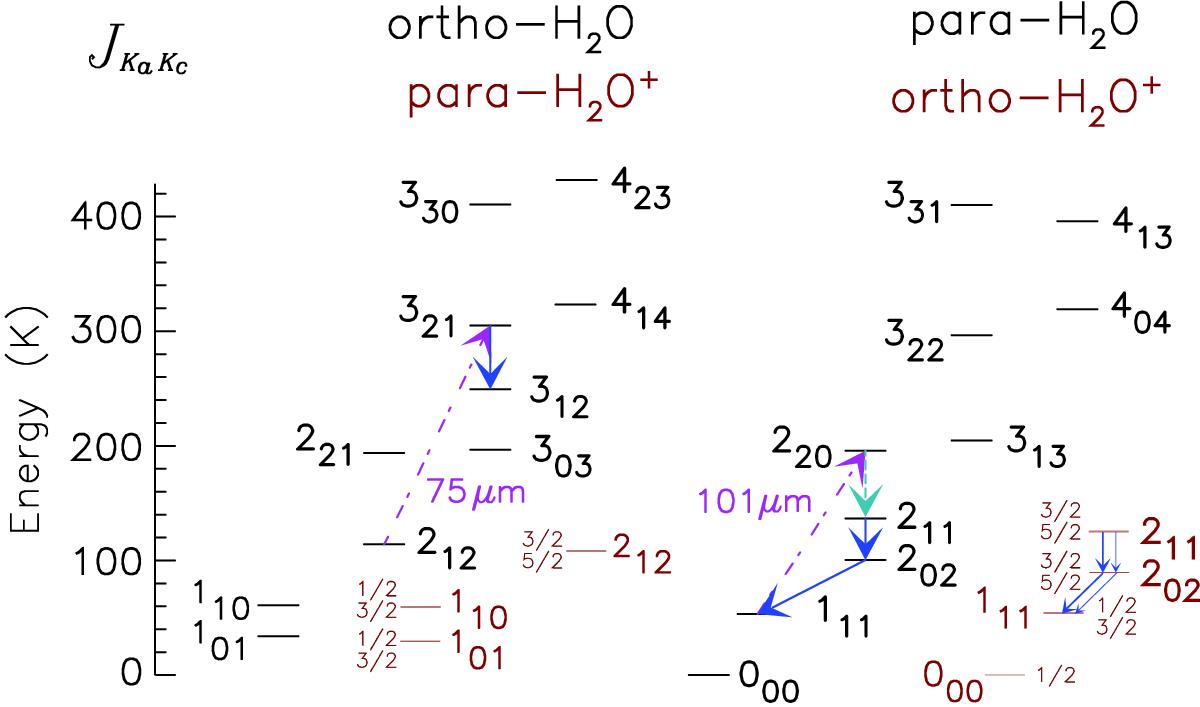
Energy level diagrams of H2O and H2O+ shown in black and red, respectively. Dark blue arrows are the submm H2O transitions we have observed in this work. Pink dashed lines show the far-infrared pumping path of the H2O excitation in the model we use, with the wavelength of the photon labeled. The light blue dashed arrow is the transition from para-H2O energy level 220 to 211 along the cascade path from 220 to 111. Rotational energy levels of H2O and H2O+, as well as fine structure component levels of H2O+ are also shown in the figure.
Current usage metrics show cumulative count of Article Views (full-text article views including HTML views, PDF and ePub downloads, according to the available data) and Abstracts Views on Vision4Press platform.
Data correspond to usage on the plateform after 2015. The current usage metrics is available 48-96 hours after online publication and is updated daily on week days.
Initial download of the metrics may take a while.