Free Access
Fig. 2b
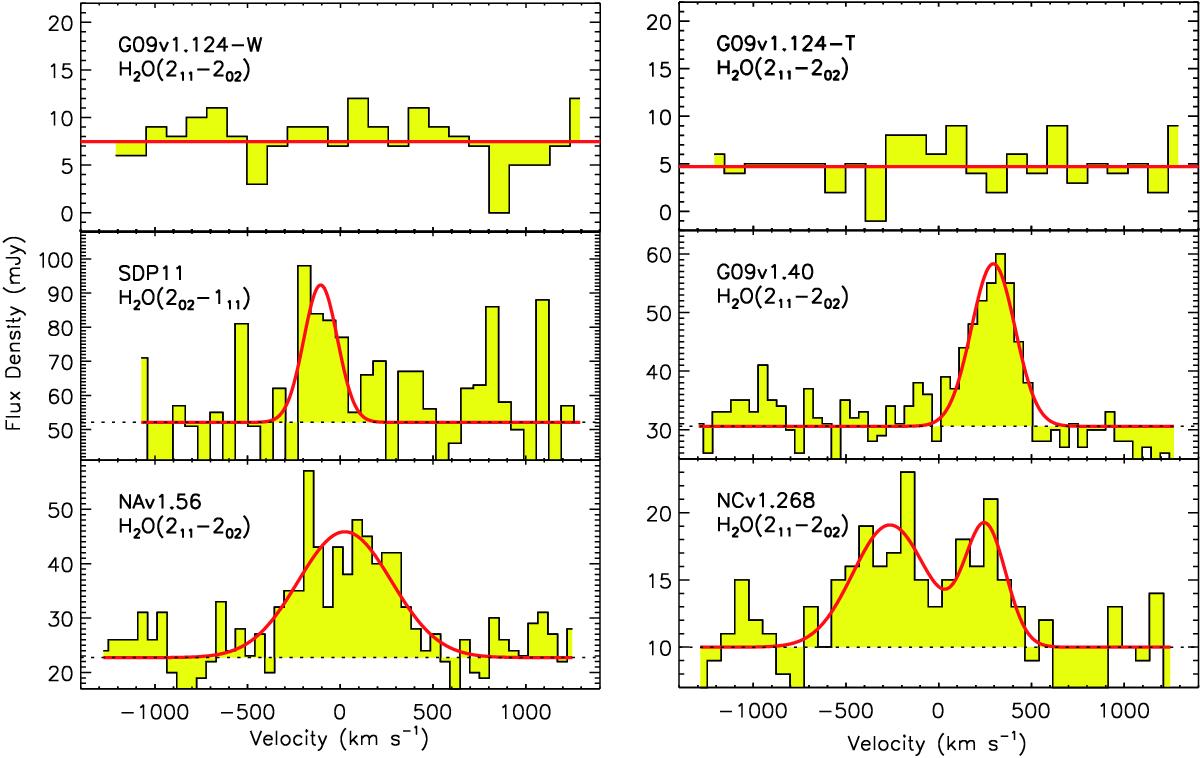
Spatially integrated spectra of H2O of the five sources with only one J = 2 para-H2O line observed. The red lines represent the Gaussian fitting to the emission lines. Except for the H2O line in G09v1.124, all the J = 2 H2O lines are well detected.
Current usage metrics show cumulative count of Article Views (full-text article views including HTML views, PDF and ePub downloads, according to the available data) and Abstracts Views on Vision4Press platform.
Data correspond to usage on the plateform after 2015. The current usage metrics is available 48-96 hours after online publication and is updated daily on week days.
Initial download of the metrics may take a while.